
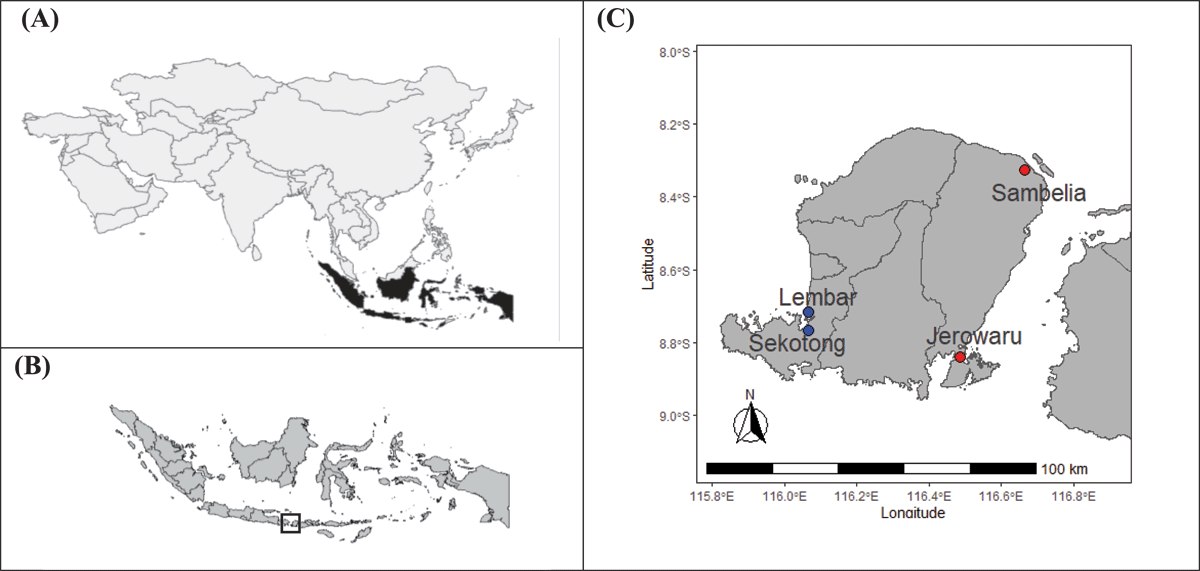
Figure 1
Map of study locations. The location of (A) Indonesia within the world map, (B) Lombok island within Indonesia, and (C) Lembar and Sekotong villages in West Lombok district (blue dots), Jerowaru and Sambelia villages in East Lombok district (red dots). The governance level in the fisheries and aquaculture sector consists of ministerial, provincial, district, and village governments.
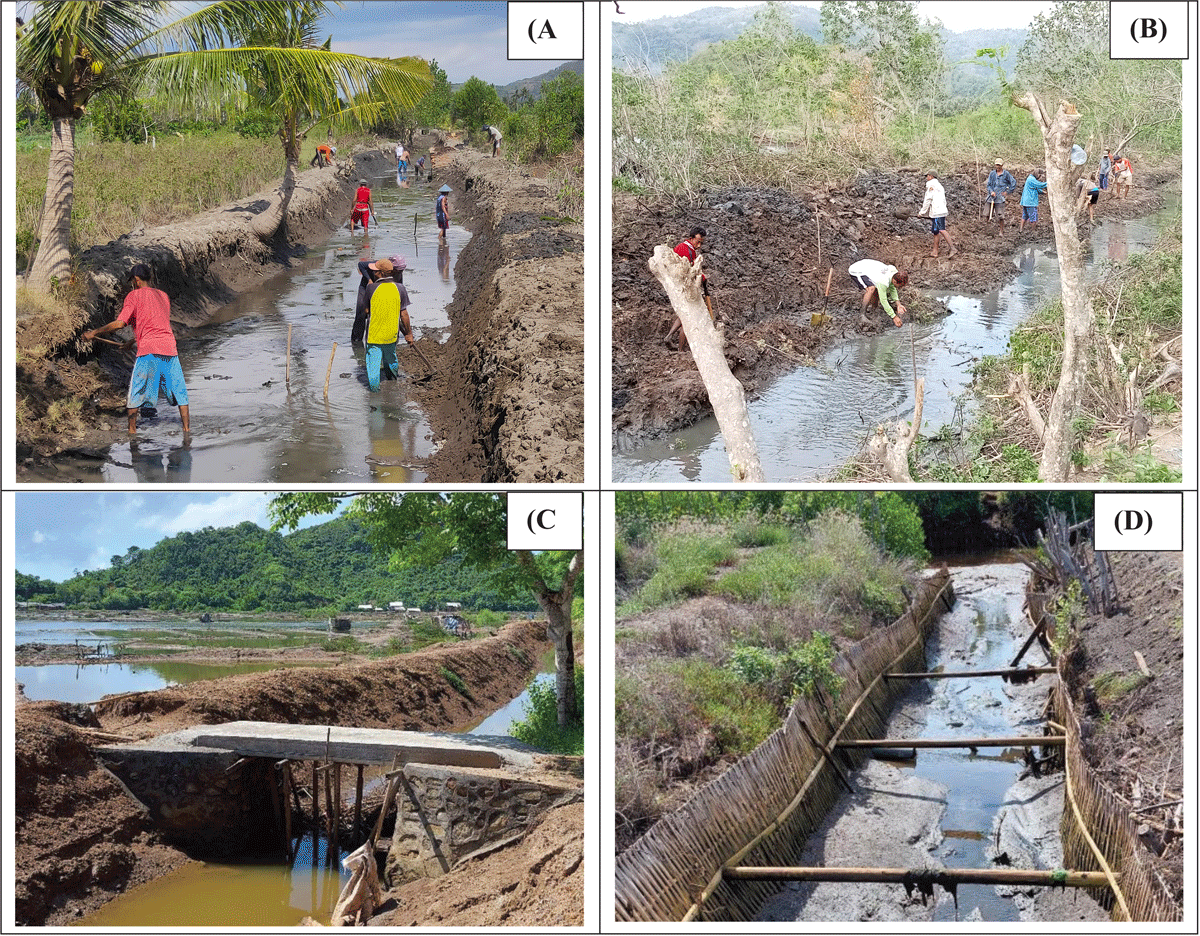
Figure 2
Images of collective action to maintain the irrigation canals in: (A) Lembar in 2022 and (B) Sekotong in 2022. Images of (C) Jerowaru and (D) Sambelia, were taken in 2021 after collective maintenance was completed. All photos were taken by first author during fieldwork in 2022.
Table 1
The main social and ecological characteristics of the four villages, organized by the second-tier SESF variables (McGinnis and Ostrom, 2014).
| SESF VARIABLES | INDICATOR | LEMBAR, WEST LOMBOK | SEKOTONG, WEST LOMBOK | JEROWARU, EAST LOMBOK | SAMBELIA, EAST LOMBOK |
|---|---|---|---|---|---|
| RS 3 – Size of resource system | The average pond cultivation area (based on the total area of pond) | 35–180 acres1 | 10–500 acres | 100–500 acres | 5–10 acres |
| RS4 – Human- constructed facilities | Irrigation canals for rehabilitation from PITAP program | Length 400 m divided into two locationsWidth 2,4 m and Depth 0,9 m | Length 385 m in one locationWidth 4,75 m and depth 0,6 m | Length 600 m in one locationWidth 3,5 m and depth 0,8 m In addition, a bridge construction work | Length 260 m divided in two locations Width 2 m and depth 1 m In addition, water tunnel construction work |
| RS9 – Location | Village location | Kebon Bongor hamlet | Sayong Baru hamlet | Batu Nampar Selatan hamlet | Sugian hamlet |
| RU1 – Resource unit mobility | Water sources | Fresh water source from Pengga and Gebong irrigation areas and rainfall. Saltwater from irrigation canals | Fresh water source from rainfall. Saltwater source from irrigation canals | Fresh water source from Montong Kelek dam. Saltwater source from irrigation canals | Fresh water source from Sambelia irrigation areas and rainfall. Saltwater from irrigation canals |
| RU4 – Economic value | Cultivated species | Milkfish (Chanos-chanos), tiger shrimp (Panaeus monodon), and mud crab (Scylla serrata) | Dry season: saltRainy season: milkfish (Chanos-chanos) | Vannamei shrimp (Litopenaeus vannamei), milkfish (Chanos-chanos), and mud crab (Scylla serrata) | |
| Price per species – price range based on the variety of sizes | Milkfish Rp 30.000 – Rp 40.000 per kg (€1,8–€2,4)2 | ||||
| Tiger shrimp Rp 80.000 – Rp 150.000 per kg (€4,8–€9,1) Mud crab Rp 85.000 – Rp 130.000 per kg (€5,1–€7,8) | Salt per sack (88kg) Rp 80.000 in the dry season, Rp 300.000 in the rainy season (€4,8–€18,2) | Vannamei shrimp Rp 40.000 – Rp 70.000 per kg (€2,4–€4,2) Mud crab Rp 85.000 – Rp 130.000 per kg (€5,1–€7,8) | |||
| A1 – Number of relevant actors | Number of participants | 30 participants who live in Kebon Bongor hamlet | 30 participants who live in the Sayong Baru and Bertong hamlets | 17 participants who live in Temayang and Temayang Indah hamlets | 30 participant who live in Kokok Pedek Barat and Kokok Pedek Timur hamlets |
| Other relevant actors | A facilitator from the government fisheries department (DKP) West Lombok. A technical consultant for irrigation | A facilitator from the government fisheries department (DKP) West Lombok. A technical consultant for irrigation | A technical consultant for irrigation | A technical consultant for irrigation | |
| GS2a – Co-management | POKLINA | POKLINA Mitra Mina Sejahtera | POKLINA Tambak Makmur | POKLINA Sumber Makmur | POKLINA Maju Bersama |
| GS4 – Property rights systems | Ownership of the pond | Ponds owned by people from Java, Bali, and Mataram | Majority of ponds are owned by people from Java, Bali, and Mataram. Only a few local own ponds | Ponds are owned by people from the neighboring hamlet, Batu Nampar | Aquaculture farmers own their ponds |
| GS8 – Monitoring and sanctioning rules | Monitoring rules in PITAP program | Monitored by DKP West Lombok with a facilitator | Monitored by DKP West Lombok with a facilitator | Lack of monitoring by DKP East Lombok, a facilitator was not existent | Lack of monitoring by DKP East Lombok, a facilitator was not existent |
| Sanctioning rules if PITAP program is not implemented accordingly (e.g., timeline, budget allocation) | Not apply | Apply | |||
| I1 – Harvesting | Harvesting cycle in one year | 3–4 times a year | 3–4 times a year | Dry season: salt harvest 8–10 times a year (May – October)Rainy season: milkfish harvest 2–3 times a year (November – April) | 3–4 times a year |
| I5 – Investment | PITAP program budget | PITAP 2021 Rp79.200.000 (€4.800) | PITAP 2021 Rp79.200.000 (€4.800) | PITAP 2020 Rp102.300.000 (€6.200) | PITAP 2020 Rp170.000.000 (€10.303) |
| I7 – Self-organizing activities | Implementation of PITAP by POKLINAs | August-October 2021 with a duration of 30 days | March-May 2021 with a duration of 30 days | August-September 2021 with a duration of 30 days | |
| Wage system | Contractual wage system with Rp 60.000 (€3,6) per m2 | Contractual wage system with Rp 70.000 (€4,2) per m2 | Daily wage system with Rp 100.000 (€6,06) per day | Daily wage system with Rp 80.000 (€4,8) per day | |
| Equipment | Used simple tools: hoe and shovel | Used excavator | Used simple tools: hoe and shovel | ||
| I9 – Monitoring activities | Awig-awig3 | Not present | Present | ||
| ECO2 – Pollution patterns | Waste in irrigation canals | Domestic waste in irrigation canals, pesticides from the agricultural farmers in the irrigation canals | High rates of natural sedimentation | Pesticides from the agricultural farmers in the irrigation canals | |
[i] 1 1 acre is 100 m2.
2 The conversion used in this study is €1 = Rp 16.500.
3 Awig-awig is the informal and unwritten rules or customary law with social sanctions of Sasaknese.
Table 2
The influence of the PITAP program on collective action across the four villages. The interview data and document analysis are transformed into ordinal values by comparing every village against each other. Then, the level of influence is assigned by analyzing each case to the hypothesis of collective action. The level of influence is indicated by (1) an up arrow “↑” to indicate a positive influence enabling collective action, (2) a down arrow “↓” to indicate a negative influence hindering collective action, (3) a horizontal line “–” to indicate no influence on collective action, and (4) an asterisk “*” to indicate contradiction with a theory/hypothesis of collective action.
| SESF VARIABLES | COLLECTIVE ACTION (CA) HYPOTHESIS OF VARIABLE INFLUENCE | LEMBAR, WL | SEKOTONG, WL | JEROWARU, EL | SAMBELIA, EL | ||||
|---|---|---|---|---|---|---|---|---|---|
| ORDINAL VALUE | LEVEL OF INFLUENCE ON CA | ORDINAL VALUE | LEVEL OF INFLUENCE ON CA | ORDINAL VALUE | LEVEL OF INFLUENCE ON CA | ORDINAL VALUE | LEVEL OF INFLUENCE ON CA | ||
| I5 – Investment activities | Monetary incentives from the government (PITAP program) to improve the system can decrease the likelihood of collective action because it can crowd out intrinsic motivations of resource users by relying on the government to solve collective action problems | High | ↓ | High | ↓ | High | ↓ | High | ↑* |
| GS8 – Monitoring and sanctioning rules | The existence of monitoring activities (monitoring by the DKP government during PITAP program) can decrease the likelihood of collective action because it can crowd out intrinsic motivations by overriding prosocial motivations | Presence | ↑* | Presence | ↑* | Absence | – | Absence | – |
| The existence of external sanctions (penalty in PITAP program) can decrease the likelihood of collective action because it can crowd out intrinsic motivations by overriding prosocial motivations | Absence | – | Absence | – | Presence | ↓ | Presence | ↑* | |
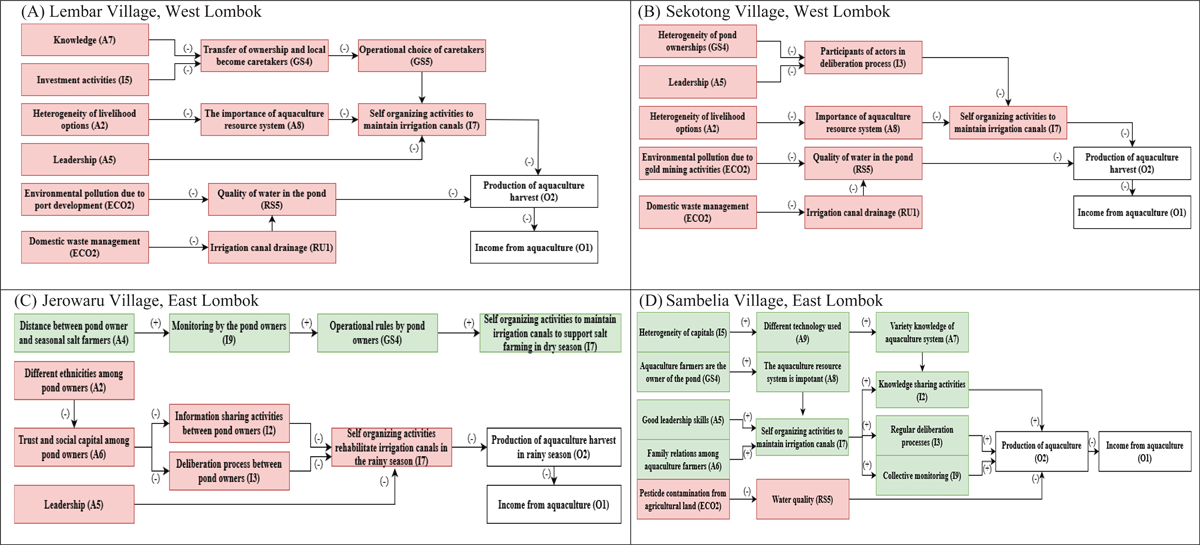
Figure 3
Key social-ecological interactions influencing collective action in (A) Lembar, (B) Sekotong, (C) Jerowaru, (D) Sambelia. The arrow indicates the interaction between SESF variables. A red box indicates a negative influence of a variable on collective action (–). A green box indicates a positive influence of a variable on collective action (+). A white box indicates the final outcome. The interactions of variables are based on researchers’ interpretation of the social and ecological characteristics of each village. The descriptive analysis of this figure is available in section 3.1.1, 3.1.2, and 3.1.3.