
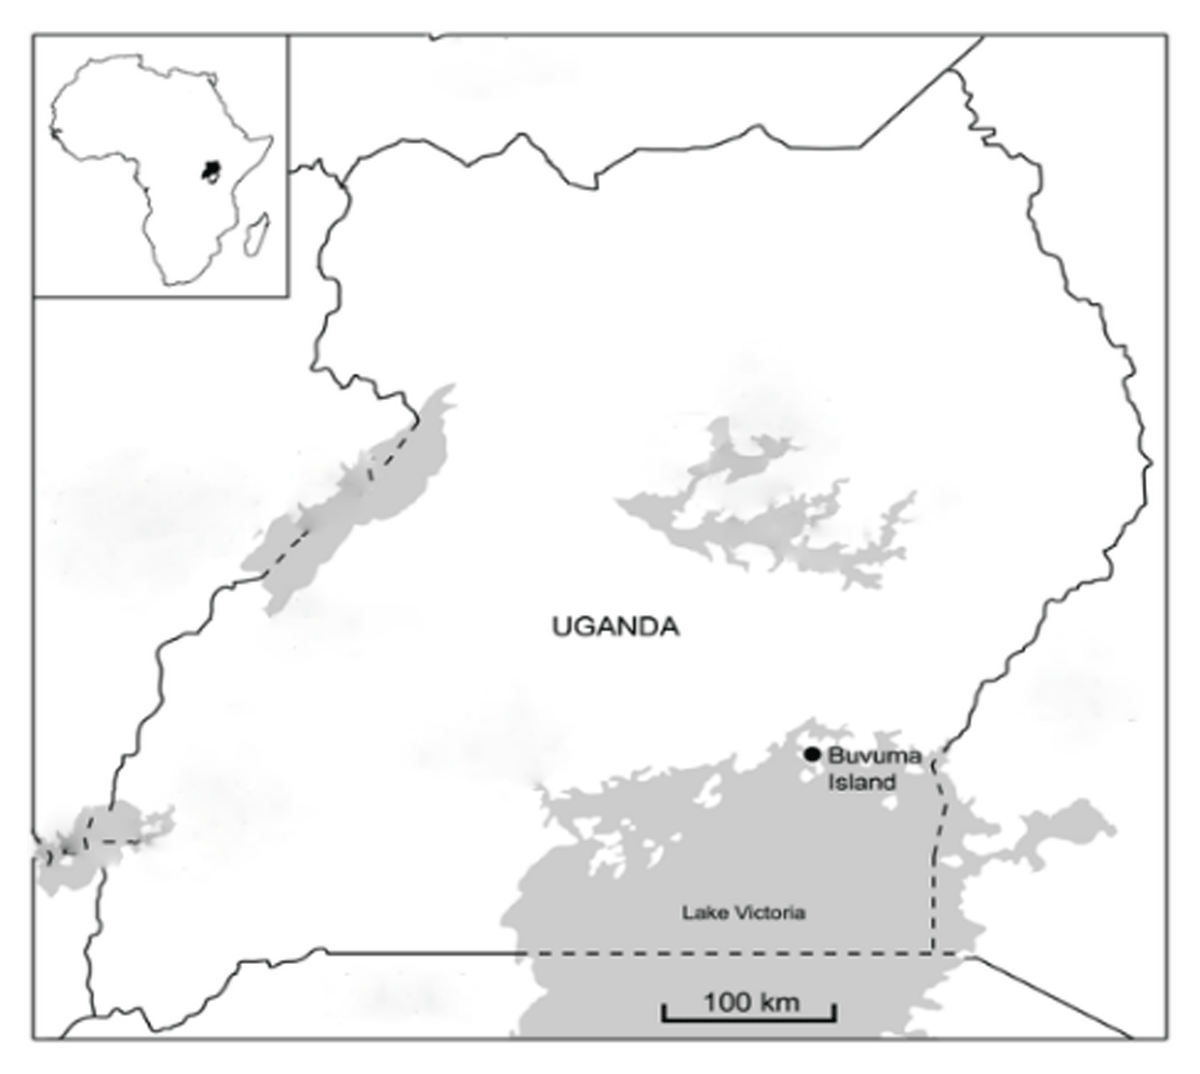
Figure 1
Location of Buvuma Island.
Table 1
Characteristics of some forest reserves on Buvuma Island.
| Forest reserve | Forest area (hectares) | Percentage degraded | Adjacent Communities** |
|---|---|---|---|
| Bukaibale | 980 | 100% | Wabivu (C), Kirongo (C), Galigatya (N) |
| Kakonwa | 700 | 100% | Kitiko (N), Kabubu (N), Bukiyindi (N) |
| Olamusa | 380 | 60% | Namugombe (C), Kifulu (C), Mubale (C), Kasali B (C) |
| Bira | 353 | 30%. | Kyanamu (C), Bukayo (O), Bulima (O), Busamuzi (O) |
| Buloba | 309 | 10% | Kitamiro (O), Walwanda (O), Buwanga (O), Bukambe (O) |
| Bugusa | 283 | 80% | Mayinja (N), Bugabo (N) |
| Kojja | 271 | 60% | Itojwe (C), Kachanga (C) |
| Sozi | 260 | 50% | Galamo (C), Bukagali (N), Ziba (O), Bulima (O) |
| Namabowe | 170 | 15% | Butabula (O), Bugongo (O), Bugema (O) |
| Nakunyi | 151 | 10% | Magyo (O), Kitamiro (O) |
[i] Notes: Forest area and percentage degraded are estimates provided by the NFA office on Buvuma.
** C, N, and V are abbreviations for ‘camp’, ‘new village’ and ‘old village’ (see later section for explanations).
Table 2
Community Typology.
| Proportion of immigrants | The proportion of prospective out-migrants | |
|---|---|---|
| Camp | High | High |
| New village | High | Low |
| Old village | Low | Low |
Table 3
Characteristics of the sampled communities.17
| Community | Community type | When community was first established | Main land tenure arrangement | Estimated % of permanent houses | Estimated No. of households | Adjacent Forest reserve(s) |
|---|---|---|---|---|---|---|
| Mubale | Camp | Early 1970s | “Restricted leasehold” | 0 % | 170 | Olamusa |
| Namagombe | Camp | Late 1980s | “Restricted leasehold” | 0 % | 120 | Olamusa |
| Itojwe | Camp | Mid 1980s | “Restricted leasehold” | 0 % | 130 | Kojja |
| Wabivu | Camp | Mid 1990s | “Restricted leasehold” | 0 % | 190 | Bukaibale |
| Kitamiro | Old village | Before 1960 | Freehold & leasehold | 80 % | 100 | Buloba & Nakunyi |
| Bukayo | Old village | Before 1960 | Freehold & leasehold | 70 % | 80 | Bira |
| Magyo | Old village | Before 1960 | Freehold & leasehold | 90 % | 110 | Nakunyi |
| Butabula | Old village | Before 1960 | Freehold & leasehold | 85% | 90 | Namabowe |
| Kitiko | New village | 2009 | Leasehold | 5% | 190 | Kakonwa |
| Kabubu | New village | 2004 | Freehold & leasehold | 5% | 90 | Kakonwa |
| Mayinja | New village | 2006 | Leasehold | 2% | 100 | Bugusa |
| Bukagali | New village | 2005 | Freehold & leasehold | 8% | 120 | Sozi |
Table 4
Sampling characteristics.
| Sample | Overall | Participated | Was willing but did not participate | Refused to participate |
|---|---|---|---|---|
| Solar (1= solar panel) | 0.67 (0.02) | 0.66 (0.02) | 0.66 (0.09) | 0.70 (0.08) |
| Share of men | 0.69 (0.02) | 0.67 (0.03) | 0.76 (0.08) | 0.78 (0.07) |
| Number of observations | 360 | 293 | 30 | 37 |
[i] Notes: Standard errors are in parentheses. The share of men is a continuous variable. Solar is measured as a binary variable with the indicated category taking the value 1, and 0 otherwise.

Figure 2
Did you immigrate to this community? (yes, no).
Notes: C is camp, N is new village and O is old village.
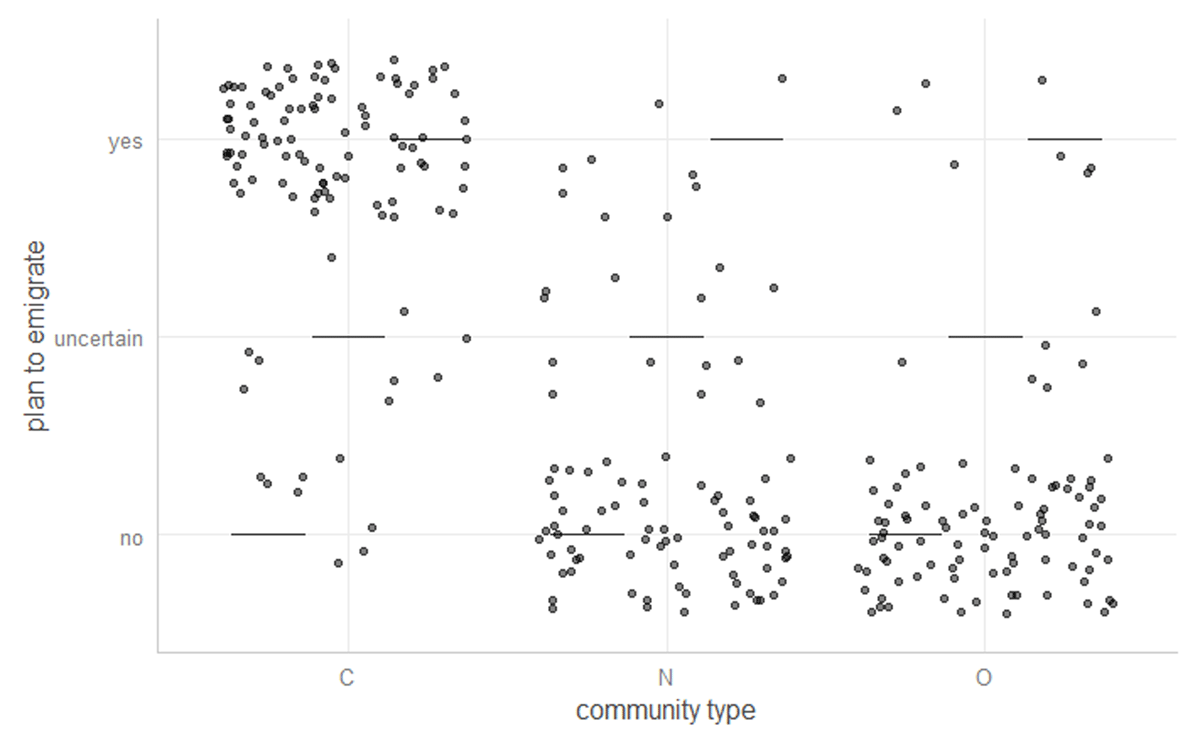
Figure 3
Do you plan to migrate out of this community? (yes, uncertain, no).
Notes: C is camp, N is new village and O is old village.
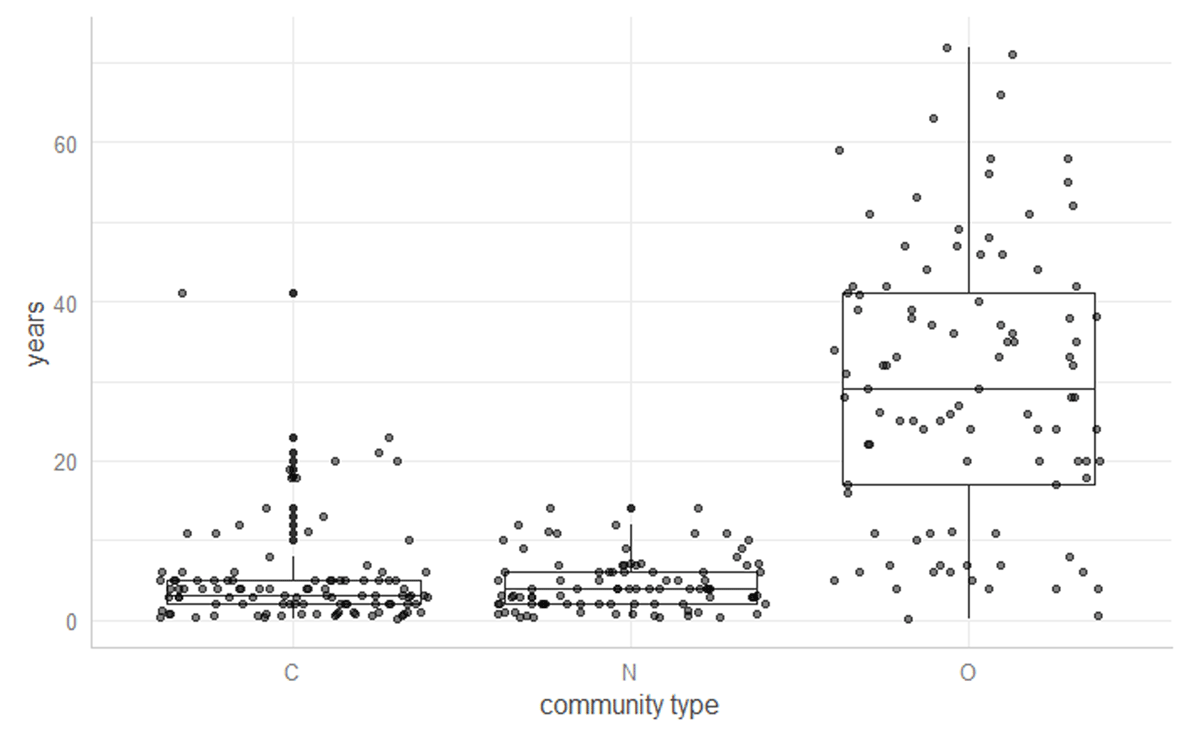
Figure 4
How long have you resided in this community? (years).
Notes: C is camp, N is new village and O is old village.

Figure 5
Do you have a spouse or child (ren) in other communities? (yes, no).
Notes: C is camp, N is new village and O is old village.
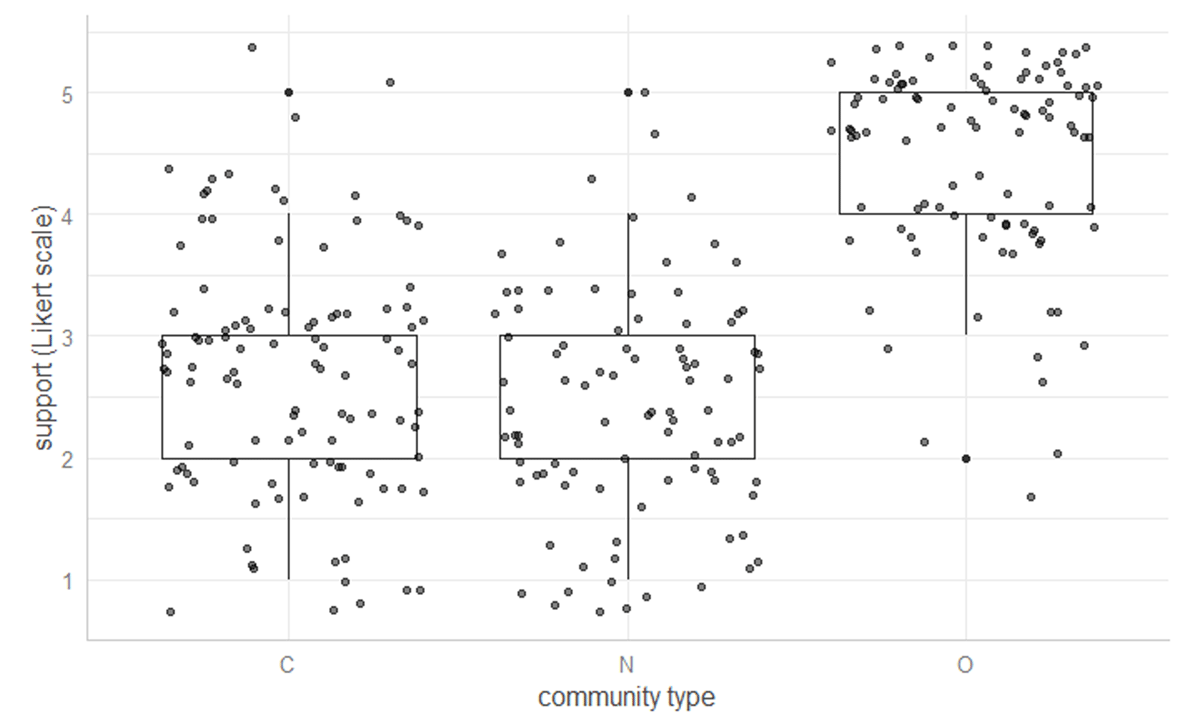
Figure 6
Support for governmental forest rules.
Notes: C is camp, N is new village and O is old village.
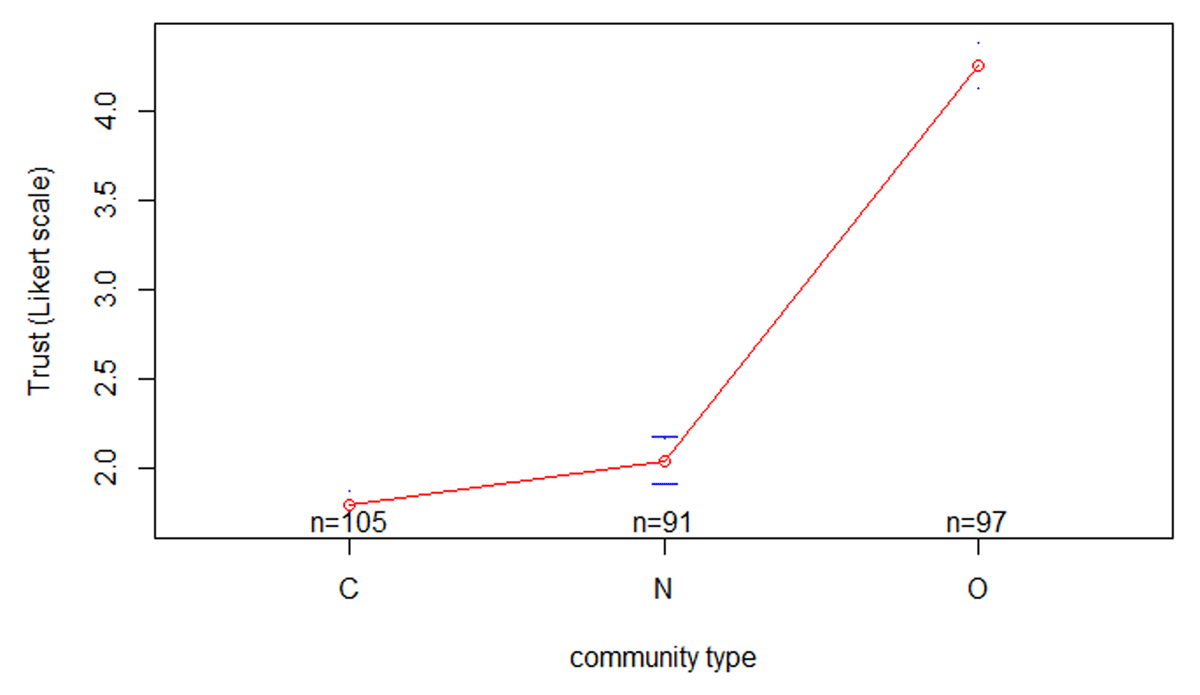
Figure 7
Trust that others support governmental forest rules.
Notes: C is camp, N is new village and O is old village.
Table 5
Community-level & Individual-level variables.
| Variables | Description | Measure/Indicator | Hypothesized relationship* |
|---|---|---|---|
| Community-level | |||
| Residency in a camp | Binary variable: 1 for yes & 0 for no | – | |
| Residency in a new village | Binary variable: 1 for yes & 0 for no | – | |
| Residency in an old village | The baseline relative to which both camp and new village are analyzed | Binary variable: 1 for yes & 0 for no | |
| Ethnic fractionalization | The extent of fractionalization along ethnic lines | Herfindahl index (formally, ELF = 1 – Σ I (Proportion of group j) ²) | – |
| Size of forest reserve(s) near community | Continuous variable (hectares) | – | |
| Individual-level | |||
| Age | Continuous variable (years) | + | |
| Gender | 1 for men and 0 for women | +/– | |
| Source of income | Binary variable: 1 for farmer & 0 otherwise | +/– | |
| Affluence/Poverty | Binary variable: 1 for access to solar electricity & 0 otherwise | +/– | |
| Education beyond secondary | Binary variable: 1 for yes & 0 for no | + | |
| Education beyond primary | Binary variable: 1 for yes & 0 for no | + | |
| Duration of residency | Number of years residing in a community | Continuous variable (years) | + |
| Plan to emigrate | Whether the respondent plans to emigrate from the local community | Binary variable: 1 for yes & 0 otherwise | – |
| Spouse or child(ren) outside the community | Provides a measure of community attachment | Binary variable: 1 for yes & 0 otherwise | – |
[i] * The hypothesized relationship is with both the support for forestry rules and the trust that other community members support forestry rules.
Table 6
Predicting support and trust.
| Model 1 (Support forest rules) | Model 2 (Trust others) | |
|---|---|---|
| (Intercept) | 3.663*** (0.369) | 4.233*** (0.232) |
| R is a resident of a camp | –1.467*** (0.178) | –2.371*** (0.112) |
| R is a resident of a new village | –1.838 *** (0.148) | –2.098*** (0.093) |
| R is a resident of an old village | ||
| R has spouse or child(ren) outside community | –0.013 (0.125) | 0.081 (0.079) |
| Ethnic fractionalization in R’s community | –0.046 (0.366) | –0.117 (0.230) |
| Size (ha) of forest reserves near R’s community | –0.001* (0.001) | –0.001** (0.001) |
| R’s age | 0.019*** (0.005) | 0.001 (0.003) |
| R is male | 0.132 (0.112) | –0.129 (0.070) |
| R is educated beyond primary school | 0.044 (0.113) | –0.048 (0.071) |
| R is educated beyond secondary school | 0.755* (0.309) | 0.355 (0.194) |
| R is a farmer | 0.194 (0.177) | 0.041 (0.111) |
| R has access to solar electricity | –0.099 (0.112) | –0.050 (0.070) |
| Number of observations | 293 | 293 |
[i] Notes: Signif. codes: 0 ‘***’ 0.001 ‘**’ 0.01 ‘*’ 0.05.
R means respondent.
Cells contain coefficients from ordered logit regressions with standard errors in parentheses.
Table 7
Predicting support and trust with additional variables.
| Model 3 (Support for rules) | Model 4(Trust others) | |
|---|---|---|
| (Intercept) | 3.477*** (0.364) | 4.153*** (0.235) |
| R is a resident of a camp | –0.960*** (0.218) | –2.361*** (0.141) |
| R is a resident of a new village | –1.318*** (0.188) | –1.981*** (0.121) |
| R is a resident of an old village | ||
| R’s duration of residence (years) in community | 0.025*** (0.005) | 0.005 (0.003) |
| R plans to emigrate from community | –0.133 (0.169) | 0.138 (0.109) |
| R has spouse or child(ren) outside community | 0.001 (0.123) | 0.066 (0.079) |
| Ethnic fractionalization in R’s community | 0.227 (0.360) | 0.140 (0.233) |
| Size (ha) of forest reserves near R’s community | –0.001 (0.001) | –0.001** (0.001) |
| R’s age | 0.002 (0.006) | –0.001 (0.004) |
| R is male | 0.092 (0.109) | –0.131 (0.070) |
| R is educated beyond primary school | 0.035 (0.110) | –0.050 (0.071) |
| R is educated beyond secondary school | 0.752* (0.300) | 0.370 (0.194) |
| R is a farmer | 0.110 (0.173) | 0.040 (0.112) |
| R has access to solar electricity | –0.106 (0.110) | 0.037 (0.071) |
| Number of observations | 293 | 293 |
[i] Notes: Signif. codes: 0 ‘***’ 0.001 ‘**’ 0.01 ‘*’ 0.05.
R means respondent.
Cells contain coefficients from ordered logit regressions with standard errors in parentheses.
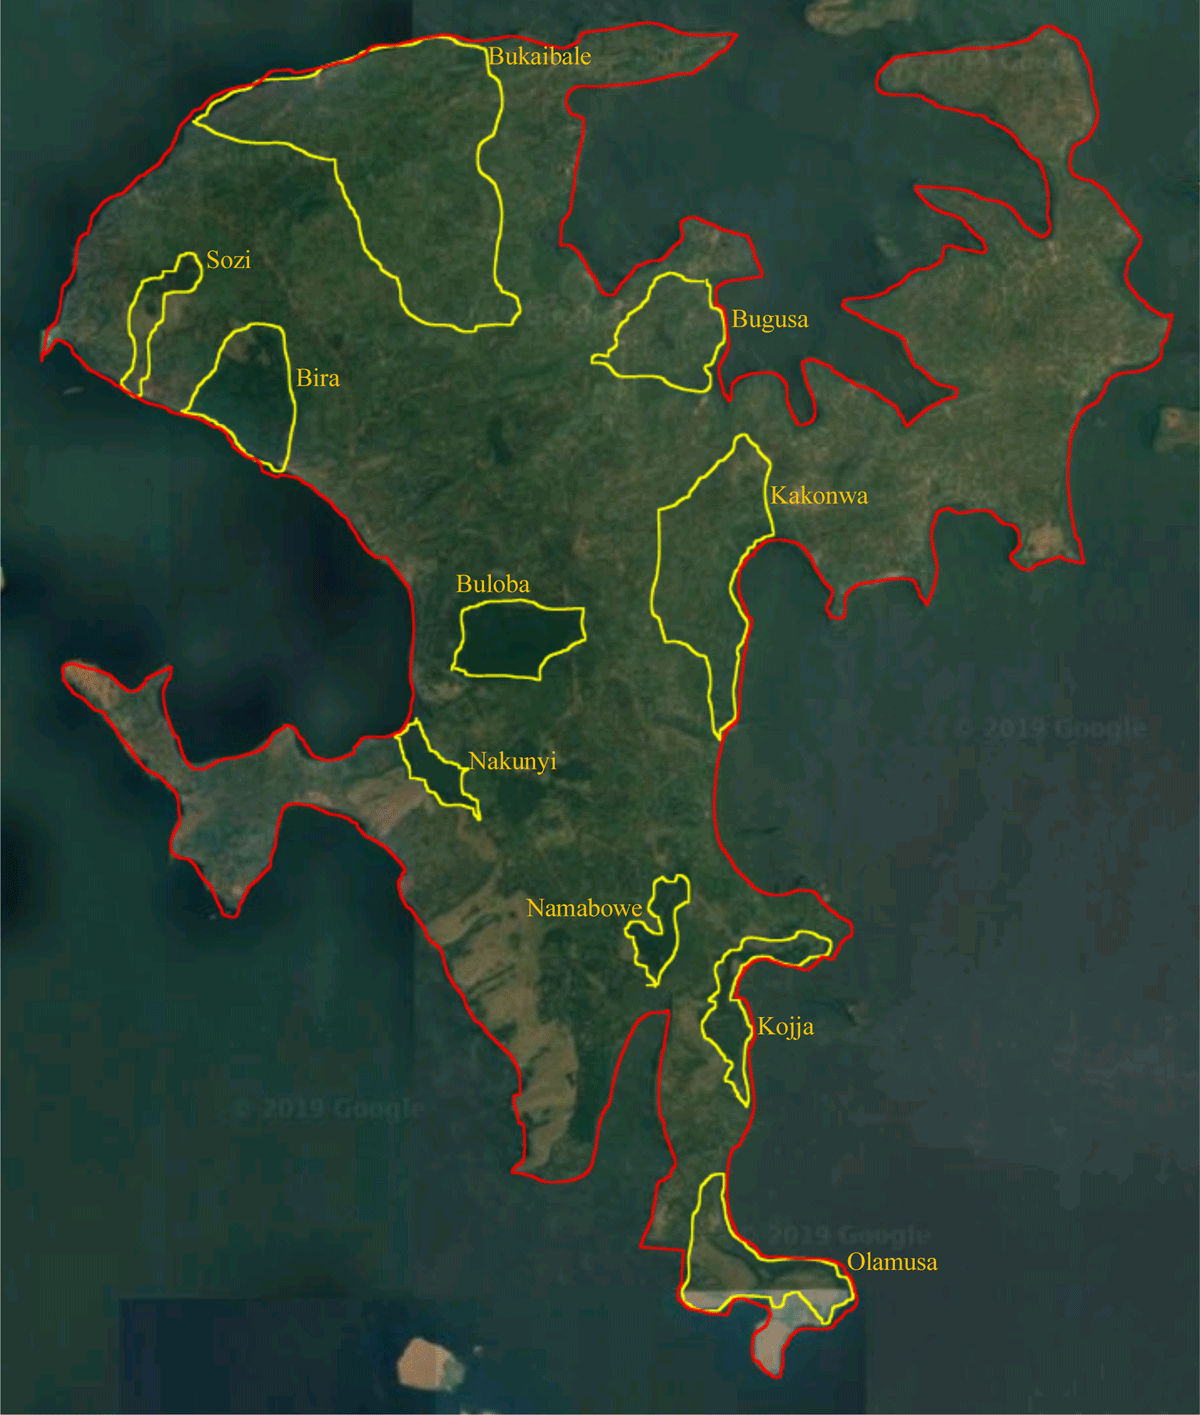
Figure 8
Some forest reserves on Buvuma Island.
Source: Google Maps October 2019 (the forest reserve parameters are sketched by the author)
Notes: Although a proper land-cover study necessitates advanced geographical analysis techniques (such as those availed by GIS), a casual look at the Google Map of Buvuma Island reveals that, of the ten forest reserves under study, the shade of green is darker in some. Importantly, these differences between the colors tend to reflect the estimations made by the NFA officials.
Table 8
Types of rules utilized by Forestry Committees on Buvuma Island.
| Type of rule | Description |
|---|---|
| Position rules | These rules specify the number of possible “positions” that actors in the action situation can assume. The positions in the forestry committees (FCs) are informal social roles. They include that of an overall chairperson and 10 to 15 individuals who regularly monitor forestry activities. |
| Boundary rules | These rules specify who is eligible to play a role. Some key considerations for FC membership are criminal record, age and, length of previous residency in the local community. Interestingly, this last consideration suggests local awareness of the impact of migration on governance schemes. |
| Choice rules | These rules specify what a participant must, must not or may do. The monitors of forestry activities are required to periodically walk through the reserves and to report illegalities to FC leaders, who in turn are required to ensure that encroachers are punished. |
| Payoff rules | These rules assign sanctions (to particular actions) that are graduated to match the severity of the action such as imposition of a fine, reporting of encroachers to the local police for incarceration and, adopting of norms that ostracize rule breakers. |
| Scope rules | These rules define what actions must, must not or may be taken. For example, FCs define rules that limit their actions from affecting the only privately managed forest area within the Island’s forest reserves, that is, the forest area managed by Buvuma Palm Resort. |
| Aggregation rules | These rules determine players’ participation in operational-choice decisions. One key aggregation rule found in the FCs is the requirement that monitoring is done in teams. |
| Information rules | These rules specify the kinds of information and information channels available. The FCs mostly rely on a voluntary exchange of information and mutual monitoring. |
[i] Notes: I compiled this information during my preliminary study on Buvuma Island in 2018.
Table 9
Selected Means.
| Panel A: Data for all respondents | Overall | Camp | Old villages | New villages |
|---|---|---|---|---|
| Proportion of respondents who were born in local community. | 0.25 (0.02) | 0.04 (0.02) | 0.72 (0.05) | 0.00 (0.00) |
| Proportion of respondents with spouse and/or child(ren) outside community. | 0.35 (0.03) | 0.66 (0.04) | 0.08 (0.03) | 0.30 (0.05) |
| Average length of previous residency among community members. | 13.05 (0.93) | 29.70 (1.76) | 4.53 (0.35) | 5.10 (0.60) |
| Proportion of respondents who have resided locally for 3 years or more. | 0.75 (0.02) | 0.63 (0.04) | 0.97 (0.02) | 0.67 (0.05) |
| Proportion of respondents who have resided locally for 5 years or more. | 0.56 (0.03) | 0.36 (0.05) | 0.93 (0.03) | 0.39 (0.05) |
| Proportion of respondents who have resided locally for 10 years or more. | 0.36 (0.03) | 0.14 (0.03) | 0.82 (0.04) | 0.12 (0.03) |
| Proportion of respondents who plan to emigrate from community. | 0.35 (0.03) | 0.84 (0.04) | 0.07 (0.03) | 0.10 (0.03) |
| Proportion of respondents who do not plan to emigrate from community. | 0.54 (0.03) | 0.08 (0.03) | 0.87 (0.03) | 0.76 (0.04) |
| Proportion of respondents who are uncertain about emigrating from community. | 0.11 (0.02) | 0.08 (0.03) | 0.06 (0.02) | 0.14 (0.04) |
| Support for forestry rules (measured on Likert scale) | 3.20 (0.07) | 2.69 (0.09) | 4.47 (0.08) | 2.43 (0.10) |
| Trust that others in community support forest rules (measured on Likert scale) | 2.68 (0.07) | 1.80 (0.04) | 4.24 (0.06) | 2.04 (0.07) |
| Number of observations | 293 | 105 | 97 | 91 |
| Panel B: Data for respondents who in-migrated to a community | ||||
| Proportion of immigrants from a place outside Buvuma Island. | 0.97 (0.01) | 0.96 (0.01) | 0.93 (0.05) | 0.98 (0.01) |
| Proportion of immigrants who moved individually or as part of household. | 0.99 (0.01) | 0.98 (0.01) | 0.96 (0.03) | 1.00 (0.00) |
| Proportion of immigrants who moved to seek better economic opportunities. | 0.92 (0.02) | 0.93 (0.02) | 0.89 (0.06) | 0.91 (0.03) |
| Proportion of immigrants who moved due to conflict in place of origin. | 0.03 (0.01) | 0.03 (0.02) | 0.00 (0.00) | 0.03 (0.02) |
| Proportion of immigrants who moved to follow other relatives. | 0.05 (0.01) | 0.04 (0.02) | 0.07 (0.05) | 0.05 (0.02) |
| Number of observations | 219 | 100 | 28 | 91 |
| Panel C: Data for respondents who plan to emigrate from a community | ||||
| Proportion of prospective out-migrants whose next place of residence is outside Buvuma Island | 0.99 (0.01) | 0.99 (0.01) | 1.00 (0.00) | 1.00 (0.00) |
| Proportion of prospective out-migrants who plan to emigrate individually or as part of household (but not as part of a large social group) | 1.00 (0.00) | 1.00 (0.00) | 1.00 (0.00) | 1.00 (0.00) |
| Proportion of prospective out-migrants whose out-migration is intended to seek better economic opportunities. | 0.25 (0.05) | 0.20 (0.05) | 0.57 (0.21) | 0.44 (0.18) |
| Proportion of prospective out-migrants whose out-migration is intended to seek better public services. | 0.09 (0.03) | 0.08 (0.02) | 0.14 (0.15) | 0.11 (0.10) |
| Proportion of prospective out-migrants whose out-migration is intended to return “home” | 0.62 (0.04) | 0.69 (0.05) | 0.14 (0.15) | 0.33 (0.17) |
| Number of observations | 104 | 88 | 7 | 9 |
[i] Notes: Standard errors are in parentheses. Support for forestry rules and Trust towards other community members are measured as categorical variables on a 5-point Likert scale. All other variables are measured as binary variables with the indicated category taking the value 1, and 0 otherwise.
Table 10
Selected Data.
| Bukayo | Kitamiro | Magyo | Butabula | Kitiko | Kabubu | Mayinja | Bukagali | Mubale | Namugombe | Itojwe | Wabivu | |
|---|---|---|---|---|---|---|---|---|---|---|---|---|
| Average Age of respondents | 37.69 (2.69) | 36.20 (2.30) | 36.48 (2.60) | 35.00 (2.56) | 29.20 (2.26) | 31.67 (1.74) | 28.82 (1.69) | 29.44 (1.60) | 29.92 (1.51) | 31.20 (2.19) | 29.85 (1.43) | 28.67 (1.34) |
| Proportion of male respondents | 0.69 (0.10) | 0.65 (0.09) | 0.61 (0.10) | 0.68 (0.10) | 0.65 (0.11) | 0.54 (0.10) | 0.77 (0.09) | 0.76 (0.09) | 0.77 (0.08) | 0.58 (0.08) | 0.70 (0.09) | 0.70 (0.09) |
| Proportion of married respondents | 1.00 (0.00) | 0.97 (0.03) | 1.00 (0.00) | 1.00 (0.00) | 0.95 (0.05) | 1.00 (0.00) | 1.00 (0.00) | 0.96 (0.04) | 0.96 0.04) | 1.00 (0.00) | 1.00 (0.00) | 0.96 (0.01) |
| Proportion of respondents educated beyond primary school | 0.39 (0.10) | 0.39 (0.09) | 0.48 (0.10) | 0.36 (0.10) | 0.30 (0.10) | 0.50 (0.10) | 0.33 (0.10) | 0.32 (0.10) | 0.35 (0.10) | 0.28 (0.09) | 0.26 (0.09) | 0.26 (0.09) |
| Proportion of respondents educated beyond secondary school | 0.00 (0.00) | 0.07 (0.05) | 0.13 (0.07) | 0.00 (0.00) | 0.00 (0.00) | 0.04 (0.04) | 0.00 (0.00) | 0.04 (0.04) | 0.00 (0.00) | 0.04 (0.04) | 0.00 (0.00) | 0.04 (0.04) |
| Proportion of respondents with access to solar electricity | 0.70 (0.10) | 0.86 (0.06) | 0.83 (0.08) | 0.86 (0.07) | 0.60 (0.11) | 0.54 (0.10) | 0.41 (0.10) | 0.56 (0.10) | 0.54 (0.10) | 0.80 (0.08) | 0.59 (0.10) | 0.63 (0.09) |
| Proportion of respondents who are farmers | 1.00 (0.00) | 0.79 (0.07) | 1.00 (0.00) | 1.00 (0.00) | 0.95 (0.05) | 1.00 (0.00) | 1.00 (0.00) | 1.00 (0.00) | 0.65 (0.09) | 0.76 (0.09) | 0.89 (0.06) | 0.74 (0.08) |
| Proportion of respondents who were born in local community | 0.74 (0.09) | 0.55 (0.09) | 0.83 (0.08) | 0.82 (0.08) | 0.00 (0.00) | 0.00 (0.00) | 0.00 (0.00) | 0.00 (0.00) | 0.07 (0.05) | 0.00 (0.00) | 0.04 (0.04) | 0.04 (0.04) |
| Average length of previous residency among community members | 30.39 (3.58) | 24.12 (3.61) | 33.13 (3.42) | 32.77 (3.17) | 4.38 (0.50) | 4.78 (0.80) | 4.81 (0.85) | 4.16 (0.60) | 4.99 (1.11) | 6.74 (1.76) | 5.69 (1.09) | 2.96 (0.47) |
| Proportion of respondents who have resided locally for 3 years or more | 1.00 (0.00) | 0.93 (0.05) | 1.00 (0.00) | 1.00 (0.00) | 0.75 (0.10) | 0.62 (0.10) | 0.64 (0.10) | 0.68 (0.10) | 0.65 (0.10) | 0.68 (0.10) | 0.74 (0.09) | 0.44 (0.10) |
| Proportion of respondents who have resided locally for 5 years or more | 0.96 (0.04) | 0.86 (0.06) | 0.96 (0.04) | 1.00 (0.00) | 0.55 (0.11) | 0.38 (0.10) | 0.36 (0.10) | 0.32 (0.09) | 0.27 (0.09) | 0.44 (0.10) | 0.44 (0.10) | 0.30 (0.09) |
| Proportion of respondents who have resided locally for 10 years or more | 0.87 (0.07) | 0.69 (0.09) | 0.87 (0.07) | 0.91 (0.06) | 0.00 (0.00) | 0.13 (0.07) | 0.23 (0.09) | 0.08 (0.05) | 0.11 (0.06) | 0.20 (0.08) | 0.22 (0.08) | 0.04 (0.04) |
| Proportion of respondents who plan to emigrate from community | 0.04 (0.04) | 0.17 (0.07) | 0.04 (0.04) | 0.00 (0.00) | 0.15 (0.08) | 0.00 (0.00) | 0.04 (0.04) | 0.20 (0.08) | 0.77 (0.08) | 0.84 (0.07) | 0.89 (0.06) | 0.85 (0.07) |
| Proportion of respondents who do not plan to emigrate from community | 0.87 (0.08) | 0.83 (0.07) | 0.91 (0.07) | 0.86 (0.07) | 0.75 (0.10) | 0.88 (0.07) | 0.68 (0.10) | 0.72 (0.09) | 0.15 (0.07) | 0.08 (0.05) | 0.04 (0.04) | 0.04 (0.04) |
| Proportion of respondents who are uncertain about emigrating from community | 0.09 (0.06) | 0.00 (0.00) | 0.04 (0.04) | 0.14 (0.07) | 0.10 (0.07) | 0.12 (0.07) | 0.28 (0.10) | 0.08 (0.06) | 0.08 (0.05) | 0.08 (0.05) | 0.07 (0.05) | 0.11 (0.06) |
| Level of Support for forestry rules (measured on Likert scale) | 4.56 (0.14) | 4.34 (0.15) | 4.56 (0.14) | 4.40 (0.19) | 2.00 (0.18) | 2.29 (0.24) | 2.68 (0.18) | 2.68 (0.16) | 2.88 (0.19) | 2.64 (0.20) | 2.70 (0.18) | 2.56 (0.18) |
| Level of Trust others to support forest rules (measured on Likert scale) | 4.17 (0.10) | 4.03 (0.11) | 4.52 (0.12) | 4.36 (0.15) | 1.65 (0.11) | 1.92 (0.06) | 2.04 (0.10) | 2.48 (0.16) | 1.88 (0.06) | 1.72 (0.09) | 1.81 (0.07) | 1.78 (0.08) |
| Level of ethnic Fractionalization | 0.589 | 0.806 | 0.480 | 0.389 | 0.480 | 0.715 | 0.248 | 0.760 | 0.805 | 0.822 | 0.821 | 0.877 |
| Level of religious Fractionalization | 0.643 | 0.569 | 0.355 | 0.351 | 0.715 | 0.740 | 0.318 | 0.742 | 0.707 | 0.730 | 0.746 | 0.710 |
| Forest area (hectares) | 353 | 460 | 151 | 170 | 700 | 700 | 283 | 260 | 380 | 380 | 271 | 980 |
| Probability that two immigrants moved from the same district | 0.139 | 0.136 | 0.000 | 0.000 | 0.230 | 0.159 | 0.325 | 0.186 | 0.137 | 0.136 | 0.097 | 0.117 |