
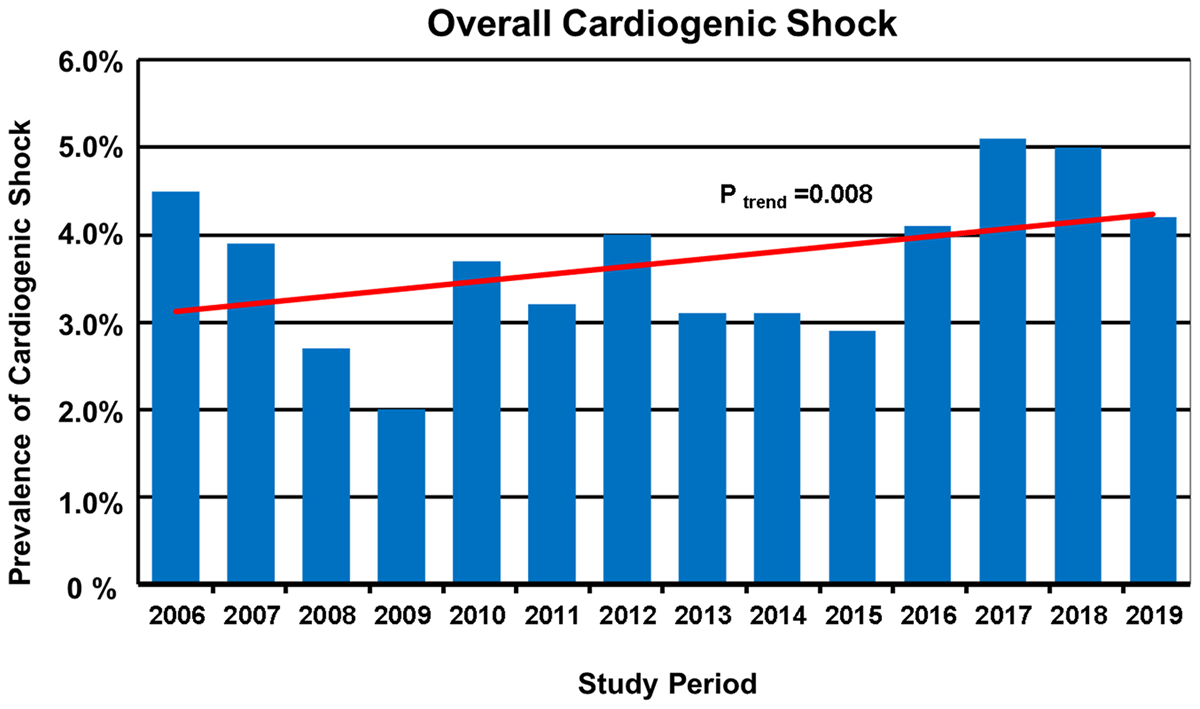
Figure 1
Rates of patients with overall cardiogenic shock (CS) hospitalized by study year between 2006 and 2019 (total n = 22,747).

Figure 2
Rates of patients with cardiogenic shock (CS) associated with acute myocardial infarction (AMI–CS) in patients hospitalized with AMI (n = 12,438) and CS associated with nonischemic etiologies (non-AMI–CS) in patients hospitalized by others causes not related to acute myocardial infarction (n = 10,309) by study year between 2006 and 2019.
Table 1
Baseline Characteristics of Patients With AMI-CS and non-AMI-CS.
| Overall (n = 833) | AMI-CS (n = 620) | Non-AMI-CS (n = 213) | P- Value | |
|---|---|---|---|---|
| Age median, (IQR) (years) | 63 (53–71) | 64 (55–72) | 57 (45–69) | <0.0001 |
| Men, n (%) | 587 (70.5) | 475 (76.6) | 112 (52.6) | <0.0001 |
| Body mass index median, (IQR) (kg/m2) | 26.3 (23.8–29.3) | 26.6 (24.2–29.4) | 25.1 (22.2–27.6) | <0.0001 |
| Medical History | ||||
| Current smoking, n (%) | 205 (24.6) | 188 (30.3) | 17 (8.0) | <0.0001 |
| Hypertension, n (%) | 420 (50.4) | 346 (55.8) | 74 (34.7) | <0.0001 |
| Dyslipidemia, n (%) | 231 (27.7) | 198 (31.9) | 33 (15.5) | <0.0001 |
| Diabetes, n (%) | 371 (44.5) | 319 (51.5) | 52 (24.4) | <0.0001 |
| Previous MI, n (%) | 159 (19.1) | 127 (20.5) | 32 (15.0) | 0.08 |
| Previous CABG, n (%) | 21 (2.5) | 15 (2.4) | 6 (2.8) | 0.74 |
| Previous PCI, n (%) | 73 (8.8) | 57 (9.2) | 16 (7.5) | 0.45 |
| Previous heart failure, n (%) | 229 (27.5) | 69 (11.1) | 160 (75.1) | <0.0001 |
| Previous stroke, n (%) | 49 (5.9) | 24 (3.9) | 25 (11.7) | <0.0001 |
| Previous atrial fibrillation, n (%) | 88 (10.6) | 16 (2.6) | 72 (33.8) | <0.0001 |
| Previous valvular surgery, n (%) | 47 (5.6) | 3 (0.5) | 44 (20.7) | <0.0001 |
[i] AMI-CS, Cardiogenic Shock caused by Acute myocardial infarction; non-AMI-CS, Cardiogenic shock of non-ischemic etiology; MI, myocardial infarction; CABG, coronary artery bypass grafting; PCI, percutaneous coronary intervention.
Table 2
Cardiogenic Shock at admission: Clinical features, laboratory data and echocardiographic findings at hospital admission of Patients With AMI-CS and non-AMI-CS.
| Overall (n = 451) | AMI-CS (n = 292) | Non-AMI-CS (n = 159) | P- Value | |
|---|---|---|---|---|
| Heart rate median, (IQR) (beats/min) | 100 (65–113) | 100 (56–110) | 99 (70–120) | 0.11 |
| Systolic blood pressure median, (IQR) (mmHg) | 80 (70–85) | 80 (70–90) | 78 (67–80) | <0.0001 |
| Diastolic blood pressure median, (IQR) (mmHg) | 48 (40–53) | 50 (40–60) | 40 (34–50) | <0.0001 |
| Mean blood pressure median, (IQR) (mmHg) | 57 (50–63) | 60 (50–67) | 53 (47–60) | <0.0001 |
| LVEF median, (IQR) (%) | 30 (21–40) | 30 (21–40) | 30 (21–50) | 0.15 |
| Haemoglobin median, (IQR) (g/L) | 13.9 (11.9–15.7) | 14.0 (12.4–16.0) | 13.2 (11.0–15.1) | 0.002 |
| Blood glucose level, median, (IQR) (mg/dL) | 177 (116–273) | 212 (149–301) | 120 (89–177) | <0.0001 |
| Hs-CRP, median (IQR) (mg/L) | 58.9 (20.5–144.2) | 68 (27.9–150.0) | 47 (17.0–118.0) | 0.05 |
| Alanine aminotransferase, median, (IQR), (U/L) | 88 (40–408) | 105 (52–432) | 66 (24–353) | 0.001 |
| Aspartate aminotransferase, median, (IQR), (U/L) | 181 (57–649) | 273 (83–698) | 79 (46–329) | <0.0001 |
| Albumin, median (IQR) (g/dL) | 3.2 (2.8–3.5) | 3.2 (2.8–3.5) | 3.2 (2.6–3.6) | 0.55 |
| Renal dysfunction* median, (IQR) (ml/min) | 36.2 (24.3–56.6) | 40.2 (26.5–59.6) | 34.5 (20.0–46.7) | 0.002 |
| Blood Lactate, median (IQR) (mmol/L) | 4.6 (2.8–37.9) | 4.5 (2.5–7.8) | 4.8 (3.0–8.4) | 0.06 |
| Arterial pH, median (IQR) | 7.30 (7.20–7.38) | 7.29 (7.20–7.39) | 7.31 (7.20–7.37) | 0.81 |
| NT-proBNP median, (IQR) (ng/L) | 14,375 (5,126–25,000) | 8,680 (3,360–19,687) | 22,826 (11,121–8,858) | <0.0001 |
[i] * Creatinine depuration ≤60 mL/min at the time of admission ((according to the Cockroft-Gault formula); LVEF, left ventricular ejection fraction; hs-CRP, high-sensitivity C-reactive protein; NT-proBNP, N-terminal prohormone of brain natriuretic peptide.
Table 3
Cardiogenic shock developed after admission: Clinical features, laboratory data and echocardiographic findings at hospital admission of Patients With AMI-CS and non-AMI-CS.
| Overall (n = 382) | AMI-CS (n = 328) | Non-AMI-CS (n = 54) | P- Value | |
|---|---|---|---|---|
| Heart rate median, (IQR) (beats/min) | 91 (75–105) | 90 (75–114) | 100 (86–108) | 0.01 |
| Systolic blood pressure median, (IQR) (mmHg) | 110 (100–130) | 112 (100–130) | 101 (90–116) | 0.001 |
| Distolic blood pressure median, (IQR) (mmHg) | 70 (60–80) | 70 (60–80) | 63 (60–71) | <0.0001 |
| Mean blood pressure median, (IQR) (mmHg) | 85 (74–97) | 87 (77–97) | 77 (70–87) | <0.0001 |
| LVEF median, (IQR) (%) | 33 (25–40) | 34 (25–40) | 30 (22–53) | 0.90 |
| Haemoglobin median, (IQR) (g/L) | 14.3 (12.6–16.0) | 14.4 (13.1–16.0) | 12.9 (11.2–15.3) | <0.0001 |
| Blood glucose level, median, (IQR) (mg/dL) | 169 (128–258) | 178 (136–278) | 126 (103–149) | <0.0001 |
| Hs-CRP, median (IQR) (mg/L) | 42.3 (13.0–114.0) | 43.1 (13.0–112.0) | 38.7 (15.4–122.2) | 0.91 |
| Alanine aminotransferase, median, (IQR), (U/L) | 65 (34–139) | 72 (39–143) | 34 (19–93) | <0.0001 |
| Aspartate aminotransferase, median, (IQR), (U/L) | 106 (44–338) | 136 (50–383) | 44 (28–92) | <0.0001 |
| Albumin, median (IQR) (g/dL) | 3.3 (3.0–3.7) | 3.3 (3.0–3.7) | 3.2 (2.9–3.6) | 0.07 |
| Renal dysfunction* median, (IQR) (ml/min) | 57.5 (38.4–84.6) | 59.1 (39.0–86.4) | 49.4 (26.9–69.6) | 0.01 |
| Blood Lactate, median (IQR) (mmol/L) | 2.0 (1.4–3.2) | 2.1 (1.4–3.3) | 1.8 (1.3–3.0) | 0.10 |
| Arterial pH, median (IQR) | 7.40 (7.34–7.45) | 7.40 (7.33–7.45) | 7.44 (7.37–7.49) | 0.01 |
| NT-proBNP median, (IQR) (ng/L) | 6,278 (2,052–17,475) | 5,387 (1,578–14,908) | 16,905 (9,387–25,000) | <0.0001 |
[i] * Creatinine depuration ≤60 mL/min at the time of admission (according to the Cockroft-Gault formula); LVEF, left ventricular ejection fraction; hs-CRP, high-sensitivity C-reactive protein; NT-proBNP, N-terminal prohormone of brain natriuretic peptide.
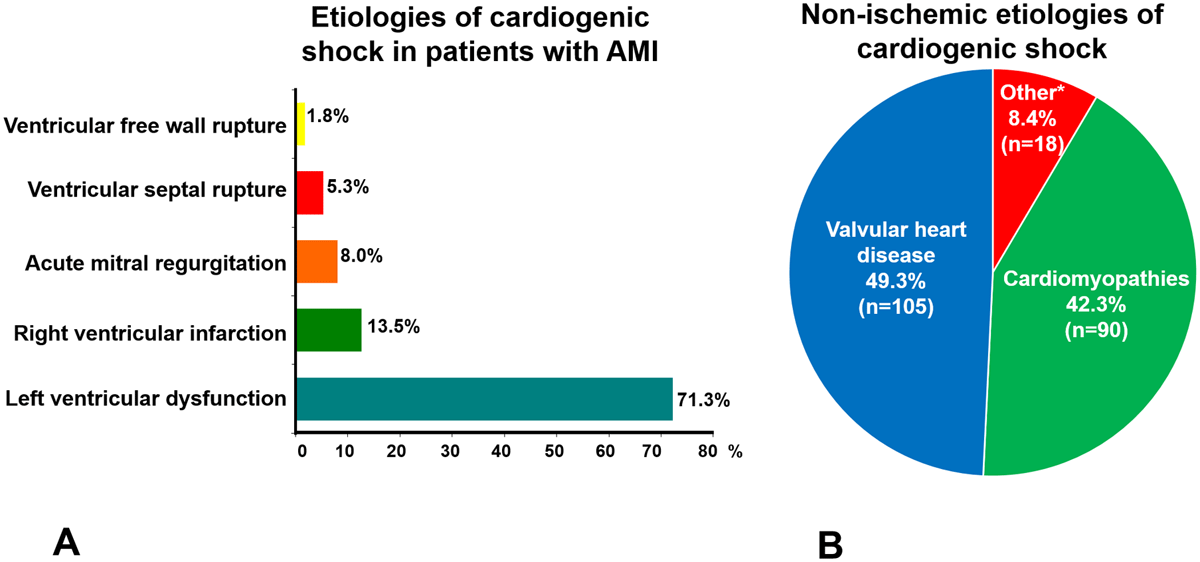
Figure 3
The frequencies of major cardiogenic shock etiologies are shown. A. Etiologies of cardiogenic shock in 620 patients with acute myocardial infarction (AMI). B. Etiologies of cardiogenic shock (CS) not associated with acute myocardial infarction (AMI) in 213 patients. Cardiomyopathies included idiopathic dilated cardiomyopathies (n = 42), chronic ischemic cardiomyopathy (n = 28), hypertension (n = 4), cardiac hypertrophy (n = 1), peripartum cardiomyopathy (n = 1), left ventricular noncompaction (n = 2), Chagas disease cardiomyopathy (n = 6), restrictive cardiomyopathy (n = 2) and myocarditis (n = 4).
* These grouped as ‘other’ included lung disease (n = 10), adult congenital heart disease (n = 5) pericardial disease (n = 1) intracardiac tumor (n = 1), and acute aortic syndrome (n = 1).
Table 4
In-hospital Management and Procedures in Patients With AMI-CS and non-AMI-CS.
| Overall (n = 833) | AMI-CS (n = 620) | Non-AMI-CS (n = 213) | P- Value | |
|---|---|---|---|---|
| Inotropes any, n (%) | 630 (75.6) | 501 (80.8) | 129 (60.6) | <0.0001 |
| Dobutamine, n (%) | 570 (68.4) | 458 (73.9) | 112 (52.6) | <0.0001 |
| Levosimendan, n (%) | 133 (16.0) | 110 (17.7) | 23 (10.8) | 0.01 |
| Dopamine, n (%) | 107 (12.8) | 79 (12.7) | 28 (13.1) | 0.87 |
| Vasopressors any, n (%) | 791 (95.0) | 578 (93.2) | 213 (100) | <0.0001 |
| Norepinephrine, n (%) | 785 (94.2) | 572 (92.3) | 213 (100) | <0.0001 |
| Vasopressin, n (%) | 515 (61.8) | 385 (62.1) | 130 (61.0) | 0.78 |
| Both Vasopressors, n (%) | 509 (61.1) | 379 (61.1) | 130 (61.0) | 0.98 |
| IABP, n (%) | 302 (36.3) | 294 (47.4) | 8 (3.0) | <0.0001 |
| Mechanical ventilation, n (%) | 563 (67.6) | 436 (70.3) | 127 (59.6) | 0.004 |
| Pulmonary artery catheter, n (%) | 183 (22.0) | 171 (27.6) | 12 (5.6) | <0.0001 |
| Renal replacement therapy, n (%) | 98 (11.8) | 70 (11.3) | 28 (13.1) | 0.46 |
| Coronary angiography, n (%) | 502 (60.3) | 488 (78.7) | 14 (6.6) | <0.0001 |
| Total PCI, n (%) | 399 (47.9) | 394 (63.5) | 5 (2.3) | <0.0001 |
| STEMI and reperfusion therapy (n = 506 patients), n (%) | –––– | 187 (37.0) | –––– | –––– |
| Primary PCI, n (%) | –––– | 175 (34.6) | –––– | –––– |
[i] IABP, intra-aortic balloon pump; PCI, percutaneous coronary intervention.

Figure 4
A Overall in-hospital all-cause mortality rates of the 22,747 CCU admissions with and without cardiogenic shock (CS). B. In-hospital all-cause mortality rates among patients with CS in groups with and without acute myocardial infarction (AMI).
Table 5
Univariable analysis for the prediction of in-hospital all-cause mortality in patients with cardiogenic shock associated with acute myocardial infarction (AMI-CS).
| Hazard ratio | 95% Confidence Interval | P Value | |
|---|---|---|---|
| Gender (Female) | 1.38 | 1.12 to 1.72 | 0.003 |
| Age (per 10years) | 1.21 | 1.12 to 1.32 | <0.0001 |
| Diabetes | 1.47 | 1.21 to 1.78 | <0.0001 |
| STEMI | 1.10 | 0.86 to 1.41 | 0.42 |
| NSTEMI | 0.90 | 0.70 to 1.15 | 0.42 |
| Cardiogenic shock to admission | 1.34 | 1.11 to 1.62 | 0.002 |
| LVEF (per 5% decrease) | 1.10 | 1.04 to 1.15 | <0.0001 |
| Systolic blood pressure (per 10 mmHg decrease) | 1.05 | 1.02 to 1.09 | 0.002 |
| Diastolic blood pressure (per 10 mmHg decrease) | 1.11 | 1.05 to 1.17 | <0.0001 |
| Mean blood pressure (per 10 mmHg decrease) | 1.09 | 1.04 to 1.15 | <0.0001 |
| Renal dysfunction | |||
| Creatinine depuration ≥60 mL/min | Reference group | ||
| Creatinine depuration 30–59 mL/min | 1.82 | 1.44 to 2.96 | <0.0001 |
| Creatinine depuration <30 mL/min | 2.70 | 2.09 to 3.48 | <0.0001 |
| Blood Lactate, >2.0 mmol/L | 1.32 | 1.09 to 1.60 | 0.004 |
| NT-proBNP (pg/mL) | 1.0 | 1.0 to 1.0 | 0.005 |
| Absence percutaneous coronary intervention | 1.75 | 1.44 to 2.12 | <0.0001 |
| Intra-aortic balloon pump | 0.86 | 0.71 to 1.04 | 0.13 |
| Mechanical ventilation | 1.27 | 1.02 to 1.58 | 0.03 |
[i] MI, myocardial infarction; CABG, coronary artery bypass grafting; PCI, percutaneous coronary intervention; STEMI, ST-segment-elevation myocardial infarction; NSTEMI, non-ST-segment elevation Myocardial Infarction; LVEF, left ventricular ejection fraction; hs-CRP, high-sensitivity C-reactive protein; cTnI, cardiac troponin I; NT-proBNP, N-terminal pro-brain natriuretic peptide.
Table 6
Univariable analysis for the prediction of in-hospital all-cause mortality in patients with cardiogenic shock no associated with acute myocardial infarction (non-AMI-CS).
| Hazard ratio | 95% Confidence Interval | P Value | |
|---|---|---|---|
| Cardiogenic shock to admission | 1.46 | 1.02 to 2.10 | 0.03 |
| LVEF (per 5% decrease) | 1.05 | 1.00 to 1.10 | 0.05 |
| Systolic blood pressure (per 10 mmHg decrease) | 1.08 | 1.00 to 1.17 | 0.02 |
| Diastolic blood pressure (per 10 mmHg decrease) | 1.13 | 1.00 to 1.27 | 0.03 |
| Mean blood pressure (per 10 mmHg decrease) | 1.11 | 1.01 to 1.21 | 0.02 |
| Blood Lactate, >2.0 mmol/L | 1.75 | 1.19 to 2.56 | 0.004 |
| Valvular surgery | 0.04 | 0.00 to 0.89 | 0.04 |
[i] MI, myocardial infarction; CABG, coronary artery bypass grafting; PCI, percutaneous coronary intervention; STEMI, ST-segment-elevation myocardial infarction; NSTEMI, non-ST-segment elevation Myocardial Infarction; LVEF, left ventricular ejection fraction; hs-CRP, high-sensitivity C-reactive protein; cTnI, cardiac troponin I; NT-proBNP, N-terminal pro-brain natriuretic peptide.
Table 7
Independent predictors of in-hospital all-cause mortality in patients cardiogenic shock associated with acute myocardial infarction (AMI-CS).
| Hazard ratio | 95% Confidence Interval | P Value | |
|---|---|---|---|
| Age (per 10years) | 1.19 | 1.05 to 1.35 | 0.006 |
| Diabetes | 1.31 | 1.01 to 1.69 | 0.04 |
| LVEF (per 5% decrease) | 1.13 | 1.06 to 1.20 | <0.0001 |
| Creatinine depuration ≥60 mL/min | Reference group | ||
| Creatinine depuration 30–59 mL/min | 1.36 | 1.01 to 1.86 | 0.05 |
| Creatinine depuration <30 mL/min | 1.94 | 1.34 to 2.80 | <0.0001 |
| Absence PCI | 1.44 | 1.10 to 1.90 | 0.008 |
| Mechanical ventilation | 1.49 | 1.10 to 2.01 | 0.01 |
[i] PCI, percutaneous coronary intervention; LVEF, left ventricular ejection fraction.
Table 8
In-hospital adverse events.
| Overall (n = 833) | AMI-CS (n = 620) | Non-AMI-CS (n = 213) | P- Value | |
|---|---|---|---|---|
| Reinfarction/infarction, % | 4.4 | 6.0 | 0.0 | <0.0001 |
| Ventricular arrhythmias, % | 36.6 | 39.5 | 28.2 | 0.003 |
| Atrial fibrillation, % | 7.8 | 7.9 | 7.5 | 0.85 |
| Third-degree atrioventricular block, % | 8.6 | 11.1 | 1.4 | <0.0001 |
| Stroke (%)(any type) | 2.8 | 3.1 | 1.9 | 0.36 |
| Major bleeding (%) | 4.4 | 5.8 | 0.5 | 0.001 |
| Nosocomial pneumonia, % | 15.0 | 17.6 | 7.5 | <0.0001 |
[i] AMI-CS, Cardiogenic Shock caused by Acute myocardial infarction; non-AMI-CS, Cardiogenic shock of non-ischemic etiology.