
Figure
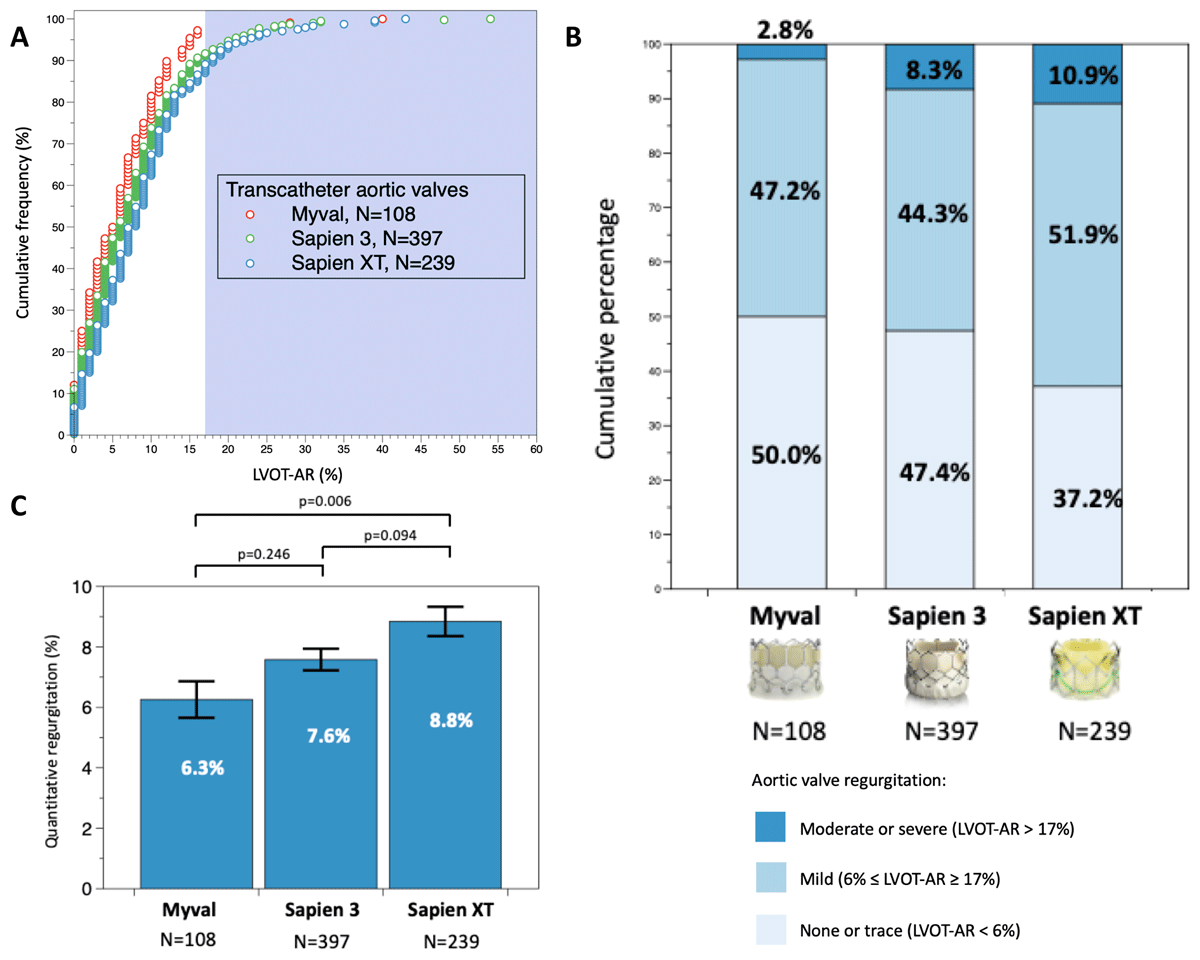
Panel A: Cumulative frequency curves of LVOT-AR after TAVI for the three BEVs. Panel B: Cumulative percentage of the different degrees of post-TAVI aortic regurgitation among the three BEVs by quantitative angiographic assessment. The shaded background shows the area above 17% of aortic regurgitation, indicating moderate or severe regurgitation. Panel C: Comparison of the mean LVOT-AR after TAVI among the three BEVs. Bars denote the mean regurgitation values, and error bars denote standard errors of the mean.
LVOT-AR: quantitative aortic regurgitation in the left ventricular outflow tract; TAVI: transcatheter aortic valve implantation; BEV: balloon expandable valve.