
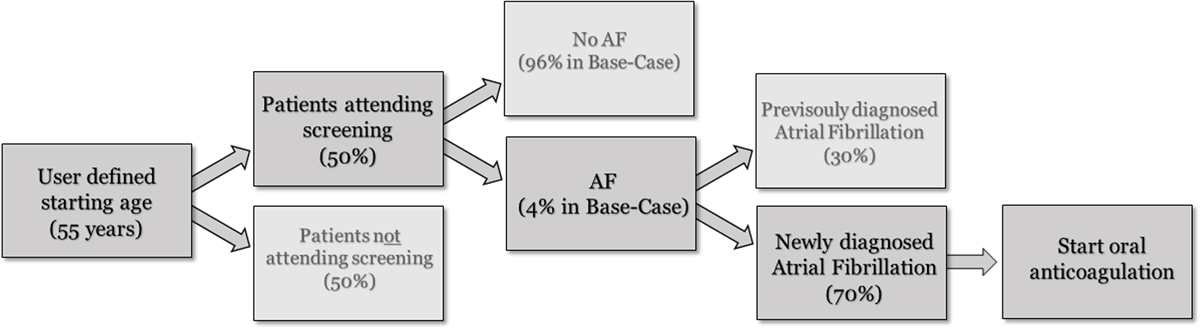
Figure 1
Decision tree for the atrial fibrillation screening procedure.
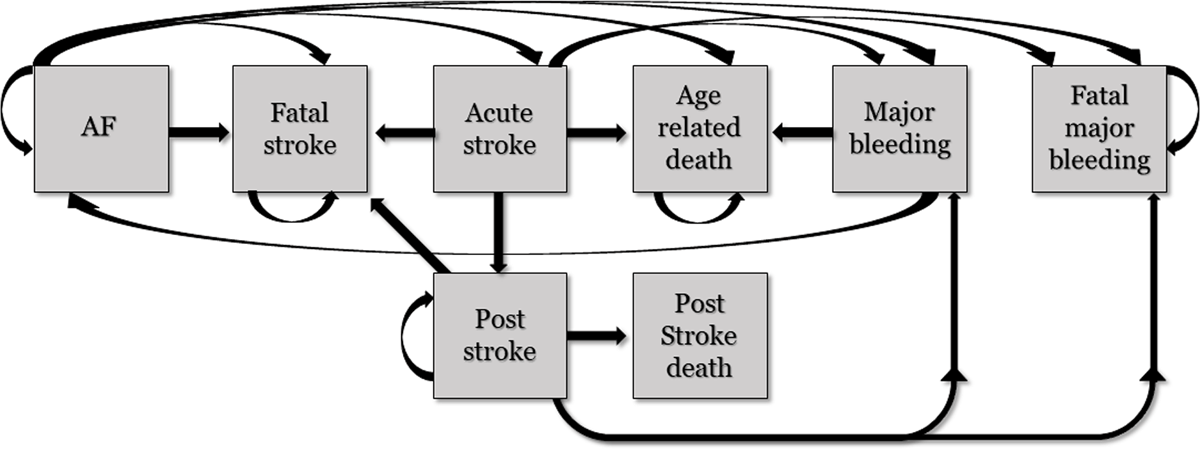
Figure 2
Health states included in the Markov model evaluating life time events in newly diagnosed atrial fibrillation patients. All patients start in the AF state (left).
Table 1
Event probabilities per 6 months for major health states included in the Markov model.
| Event | 6-month probability | Reference |
|---|---|---|
| Stroke (Ischemic stroke and intracranial haemorrhage) | 0.0108 | Temu et al. [19] |
| Stroke acute death | 0.0023 | Alkali et al. [20] |
| Post stroke death | 0.1751 | Alkali et al. [20] |
| Major bleeding | 0.0013 | Hart et al. [21] |
| Major bleeding acute death | 0.0001 | Hart et al. [21] |
| All-cause mortality | Age-dependent | Statistics Nigeria (23) |
Table 2
Relative risk in events probability in patients using oral anticoagulation.
| Event | Relative Risk Reduction |
|---|---|
| Stroke | 0.38 |
| Bleeding | 0.74 |
| Mortality | 2.40 |
Table 4
Overview of model input cost parameters.
| Event costs | Amount (int$) per 6 months | Reference |
|---|---|---|
| Acute stroke | $938 | Birabi et al [18] |
| Post stroke | $6 | WHO CHOICE, Assumption [29] |
| Stroke death | $1,126 | Birabi et al. [18] |
| Major bleeding | $195 | WHO CHOICE, Assumption [29] |
| Major bleeding death | $778 | WHO CHOICE, Assumption [29] |
| All-cause mortality | $0 | N.A. |
| Treatment costs | Amount (int$) per 6 months | |
| NOAC | $448 | Costs for dabigatran (local input) |
| Warfarin | $17 | Based on 5 mg/day (local input) |
| INR monitoring | $30 | Assumption |
Table 5
Total costs, quality-adjusted life years (QALYs) and incremental cost-effectiveness ratio (ICER) over life-time horizon in 126,746 newly detected AF cases with 100% NOAC use.
| Discounted | QALYs | Lys | Costs | ICER |
|---|---|---|---|---|
| On treatment | 232,259 | 281,456 | $192,770,261 | |
| No treatment | 219,157 | 269,191 | $27,857,047 | |
| Δ | 13,102 | 12,266 | $164,913,214 | $12,587/QALY |
| Undiscounted | QALYs | LYs | Costs | ICER |
| On treatment | 304,278 | 372,325 | $250,577,298 | |
| No treatment | 284,176 | 350,724 | $40,398,697 | |
| Δ | 20,102 | 21,602 | $210,178,601 | $10,456/QALY |
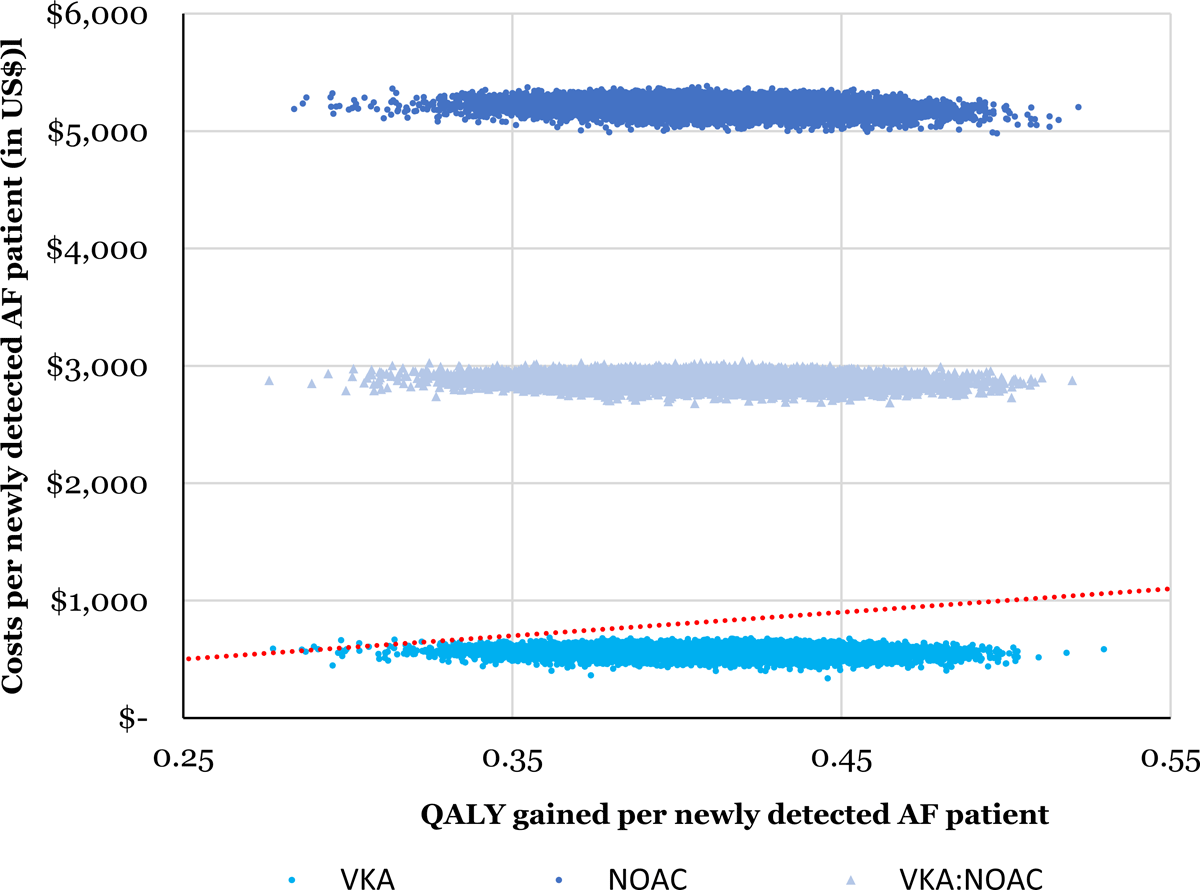
Figure 3
Cost-effectiveness plane showing 10,000 Monte Carlo estimates of incremental costs per patient and benefits per patient of AF screening compared to no screening. Points falling above the linear line have an ICER > $2,000 per QALY gained. Top cloud = 100% NOAC, middle cloud = 50%:50% NOAC:VKA (warfarin), lower cloud = 100% VKA.
Table 6
Results of the sensitivity analyses with 100% NOAC treatment.
| Scenario description | Lower value ICER (US$/QALY) | Upper value ICER (US$/QALY) |
|---|---|---|
| Stroke event probability (50–150%) | $31,063 | $7,993 |
| Age (45–65 years) | $10,067 | $16,490 |
| Stroke utility (50–150%) | $10,728 | $15,226 |
| Pulse palpation for screening (21.0 M€) | $13,280 | |
| Relative risk events on NOAC * | – | $14,528 |
| Stroke costs (50–150%) | $12,885 | $12,289 |
| AF prevalence (0.5–4%) | $13,087 | $12,212 |
| Screening costs (50–150%) | $12,310 | $12,864 |