
Table 1
Baseline characteristics of the healthy sample according to sex and race.
| All ‘Healthy’ sample (n = 543) | Female (n = 318) | Male(n = 225) | P-value | white(n = 402) | non-white (n = 141) | P-value | |
|---|---|---|---|---|---|---|---|
| Age, y | 40 ± 14 | 38 ± 13 | 43 ± 15 | < 0.001 | 41 ± 15 | 37 ± 12 | 0.004 |
| Male, % | 41 | – | – | – | 42 | 40 | 0.615 |
| Race, % | |||||||
| White | 74 | 73 | 75 | 0.908 | – | – | – |
| Black | 6 | 6 | 5 | ||||
| Other | 20 | 21 | 20 | ||||
| Smoking, % | |||||||
| Never | 83 | 89 | 75 | < 0.001 | 81 | 89 | 0.040 |
| Former | 17 | 11 | 25 | 19 | 11 | ||
| Current | 0 | 0 | 0 | 0 | 0 | ||
| Mean 24h-Systolic BP, mmHg | 116 ± 9 | 114 ± 9 | 120 ± 9 | < 0.001 | 117 ± 9 | 116 ± 9 | 0.585 |
| Mean 24h-Diastolic BP, mmHg | 73 ± 7 | 71 ± 7 | 75 ± 8 | < 0.001 | 73 ± 8 | 72 ± 6 | 0.625 |
| BMI, kg/m2 | 24 ± 3 | 24 ± 3 | 24 ± 3 | 0.190 | 24 ± 3 | 24 ± 3 | 0.790 |
| Waist circumf, cm | 86 ± 10 | 86 ± 11 | 87 ± 8 | 0.190 | 86 ± 10 | 86 ± 9 | 0.484 |
| Hip circumf, cm | 96 ± 10 | 97 ± 12 | 95 ± 6 | 0.027 | 96 ± 11 | 98 ± 7 | 0.034 |
| Neck circumf, cm | 34 ± 3 | 33 ± 2 | 37 ± 3 | < 0.001 | 35 ± 3 | 34 ± 3 | 0.447 |
| Total cholesterol, mg/dL | 195 ± 43 | 195 ± 41 | 196 ± 44 | 0.924 | 195 ± 41 | 196 ± 45 | 0.850 |
| LDL, mg/dL | 123 ± 37 | 120 ± 36 | 126 ± 38 | 0.103 | 123 ± 86 | 121 ± 40 | 0.645 |
| HDL, mg/dL | 49 ± 12 | 52 ± 12 | 44 ± 9 | < 0.001 | 48 ± 12 | 51 ± 12 | 0.008 |
| Triglicerydes, mg/dL | 119 ± 60 | 116 ± 54 | 124 ± 68 | 0.157 | 121 ± 61 | 116 ± 58 | 0.400 |
| Glicose, mg/dL | 87 ± 10 | 86 ± 10 | 87 ± 10 | 0.009 | 87 ± 10 | 87 ± 9 | 0.917 |
| HbA1c,% | 5.35 ± 0.50 | 5.30 ± 0.50 | 5.40 ± 0.50 | 0.060 | 5.40 ± 0.50 | 5.20 ± 0.50 | 0.004 |
| Creatinine, mg/dL | 0.84 ± 0.17 | 0.80 ± 0.15 | 0.90 ± 0.15 | < 0.001 | 0.83 ± 0.16 | 0.84 ± 0.17 | 0.344 |
[i] Data are shown as mean ± SD for continuous and percentages for categorical variables. P-value by independent t-test for continuous and by chi-square for categorical variables. BP = blood pressure; BMI = body mass index, chol = cholesterol; LDL = low-density lipoprotein; HDL = high-density lipoprotein; HbA1c = glycated hemoglobin. See Appendix Figure A1 for detailed information about characterization of the ‘Healthy’ sample.
Table 2
HRV Measurements of the Restricted Analytical Sample (those designated as ‘Healthy’), According to Age- and Sex-Related Distribution by Percentiles.
| HRV(n = 543) | n | Sex | Age | Percentile | Mean sex-difference(Male – Female) | P-value for sex-related difference | |||||
|---|---|---|---|---|---|---|---|---|---|---|---|
| Years | 5th | 25th | 50th | 75th | 95th | Mean ± se | |||||
| SDNN, ms | 50 | Male | 18–30 | 116 | 151 | 177 | 226 | 280 | 187 ± 6 | 28 ± 4 | < 0.001 |
| 54 | 30–39 | 114 | 134 | 159 | 190 | 240 | 165 ± 6 | ||||
| 43 | 40–49 | 98 | 128 | 140 | 188 | 218 | 155 ± 7 | ||||
| 43 | 50–59 | 85 | 122 | 149 | 180 | 218 | 152 ± 7 | ||||
| 35 | ≥ 60 | 60 | 116 | 136 | 152 | 276 | 140 ± 7 | ||||
| 87 | Female | 18–30 | 94 | 123 | 143 | 157 | 179 | 140 ± 3 | |||
| 100 | 30–39 | 89 | 120 | 137 | 158 | 197 | 139 ± 3 | ||||
| 67 | 40–49 | 74 | 112 | 126 | 145 | 184 | 128 ± 4 | ||||
| 49 | 50–59 | 77 | 121 | 136 | 155 | 186 | 136 ± 4 | ||||
| 15 | ≥ 60 | 79 | 90 | 110 | 128 | 179 | 115 ± 8 | ||||
| SDANN, ms | 50 | Male | 18–30 | 97 | 130 | 153 | 209 | 256 | 167 ± 5 | 26 ± 3 | < 0.001 |
| 54 | 30–39 | 87 | 121 | 144 | 172 | 221 | 149 ± 5 | ||||
| 43 | 40–49 | 81 | 112 | 126 | 171 | 215 | 140 ± 5 | ||||
| 43 | 50–59 | 71 | 106 | 138 | 163 | 205 | 138 ± 5 | ||||
| 35 | ≥ 60 | 51 | 100 | 120 | 132 | 234 | 121 ± 6 | ||||
| 87 | Female | 18–30 | 77 | 104 | 125 | 138 | 160 | 122 ± 4 | |||
| 100 | 30–39 | 73 | 98 | 120 | 144 | 186 | 122 ± 4 | ||||
| 67 | 40–49 | 57 | 93 | 111 | 138 | 162 | 114 ± 4 | ||||
| 49 | 50–59 | 67 | 108 | 127 | 144 | 178 | 126 ± 5 | ||||
| 15 | ≥ 60 | 60 | 77 | 93 | 113 | 152 | 98 ± 9 | ||||
| rMSSD, ms | 50 | Male | 18–30 | 27 | 44 | 53 | 81 | 106 | 60 ± 3 | 4 ± 2 | 0.070 |
| 54 | 30–39 | 22 | 30 | 40 | 51 | 83 | 43 ± 3 | ||||
| 43 | 40–49 | 17 | 24 | 32 | 45 | 56 | 34 ± 3 | ||||
| 43 | 50–59 | 19 | 23 | 30 | 39 | 58 | 33 ± 3 | ||||
| 35 | ≥ 60 | 12 | 22 | 29 | 51 | 153 | 40 ± 3 | ||||
| 87 | Female | 18–30 | 24 | 34 | 45 | 58 | 78 | 47 ± 2 | |||
| 100 | 30–39 | 18 | 29 | 37 | 49 | 80 | 41 ± 2 | ||||
| 67 | 40–49 | 20 | 25 | 31 | 39 | 64 | 34 ± 2 | ||||
| 49 | 50–59 | 17 | 21 | 27 | 35 | 67 | 30 ± 3 | ||||
| 15 | ≥ 60 | 16 | 25 | 29 | 36 | 105 | 40 ± 5 | ||||
| pNN50, % | 50 | Male | 18–30 | 5 | 13 | 22 | 33 | 46 | 23 ± 1 | 2 ± 1 | 0.017 |
| 54 | 30–39 | 2 | 6 | 9 | 19 | 32 | 13 ± 1 | ||||
| 43 | 40–49 | 1 | 3 | 6 | 12 | 20 | 8 ± 1 | ||||
| 43 | 50–59 | 1 | 3 | 5 | 9 | 17 | 7 ± 1 | ||||
| 35 | ≥ 60 | 0.25 | 1 | 3 | 7 | 38 | 7 ± 2 | ||||
| 87 | Female | 18–30 | 4 | 10 | 15 | 21 | 32 | 16 ± 1 | |||
| 100 | 30–39 | 1 | 5 | 11 | 18 | 35 | 13 ± 1 | ||||
| 67 | 40–49 | 1 | 3 | 7 | 12 | 31 | 9 ± 1 | ||||
| 49 | 50–59 | 0.50 | 2 | 3 | 7 | 14 | 5 ± 1 | ||||
| 15 | ≥ 60 | 1 | 1 | 4 | 6 | 13 | 5 ± 2 | ||||
[i] ‘Healthy’ sample excluded those under medication use, those who had HTN, DM, obesity, current smokers, past stroke, past AMI, cancer, cardiac revascularization or angioplasty (see Appendix Figure A1). Male (n = 225) and Female (n = 318). se = standard error; HTN = hypertension; DM = diabetes mellitus; AMI = acute myocardium infarction; NN = normal-to-normal; SDNN = standard deviation of NN intervals; SDANN = standard deviation of the average of all consecutive 5-minute NN intervals; rMSSD = root mean square of successive difference of NN intervals; pNN50 = percentage of consecutive NN intervals that deviate from one another by more than 50 ms.
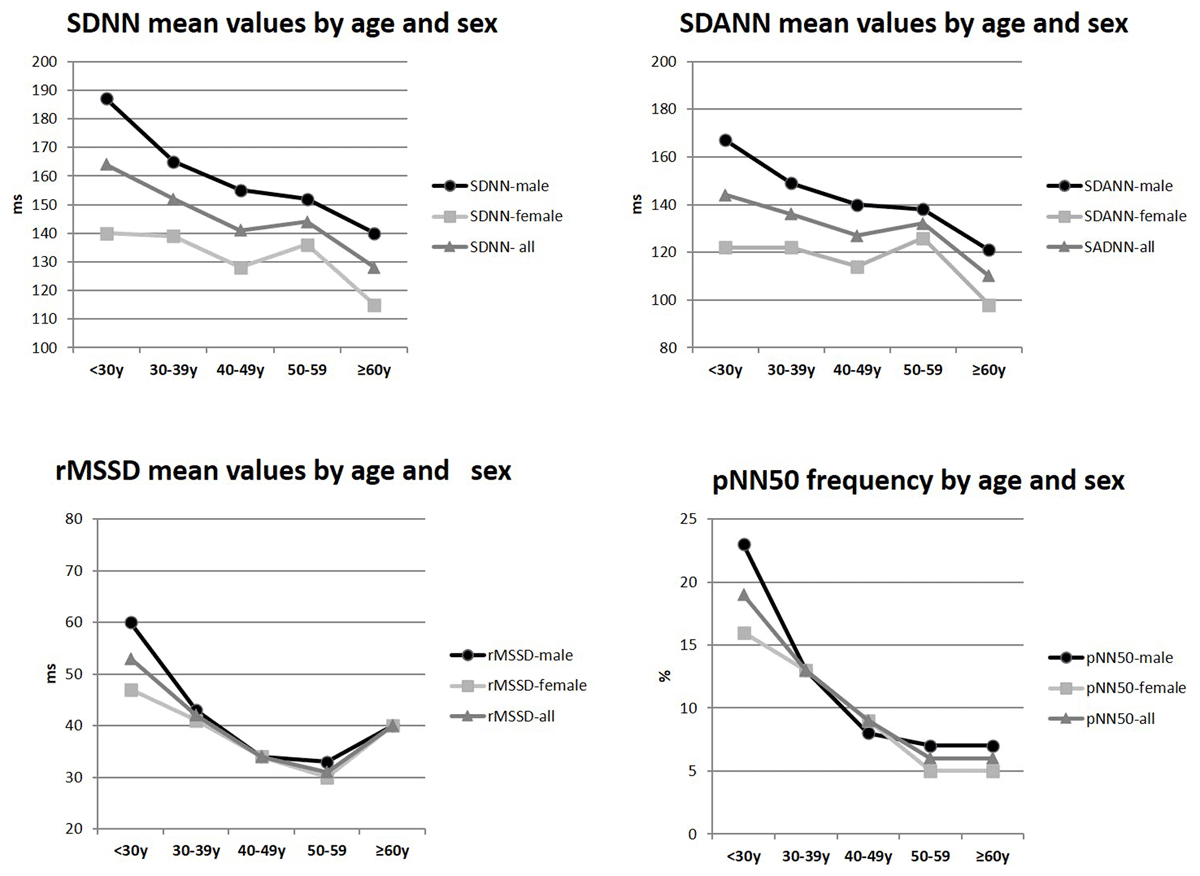
Figure 1
HRV measures showing mean values by age decade and sex distribution of the ‘Healthy’ sample. SDNN = standard deviation of NN intervals; SDANN = standard deviation of the average of all consecutive 5-minute NN intervals; rMSSD = root mean square of successive difference of NN intervals; pNN50 = percentage of consecutive NN intervals that deviate from one another by more than 50 ms. Female (n = 318) and Male (n = 225). Age ≥ 18 and < 30y (n = 137); age 30–39y (n = 154); age 40–49y (n = 110); age 50–59y (n = 92); age ≥ 60y (n = 50). According to 2-way ANOVA, testing difference among groups, for SDNN (p-value for sex = < 0.001, for age-decade = < 0.001 and for age-decade*sex interaction = 0.023); For SDANN (p-value for sex = < 0.001, for age-decade = < 0.001 and for age-decade*sex interaction = 0.011; For rMSSD (p-value for sex = 0.070, for age-decade < 0.001 and for age-decade*sex interaction = 0.096); For pNN50 (p-value for sex = 0.017, for age-decade = < 0.001 and for age-decade*sex interaction = 0.009).
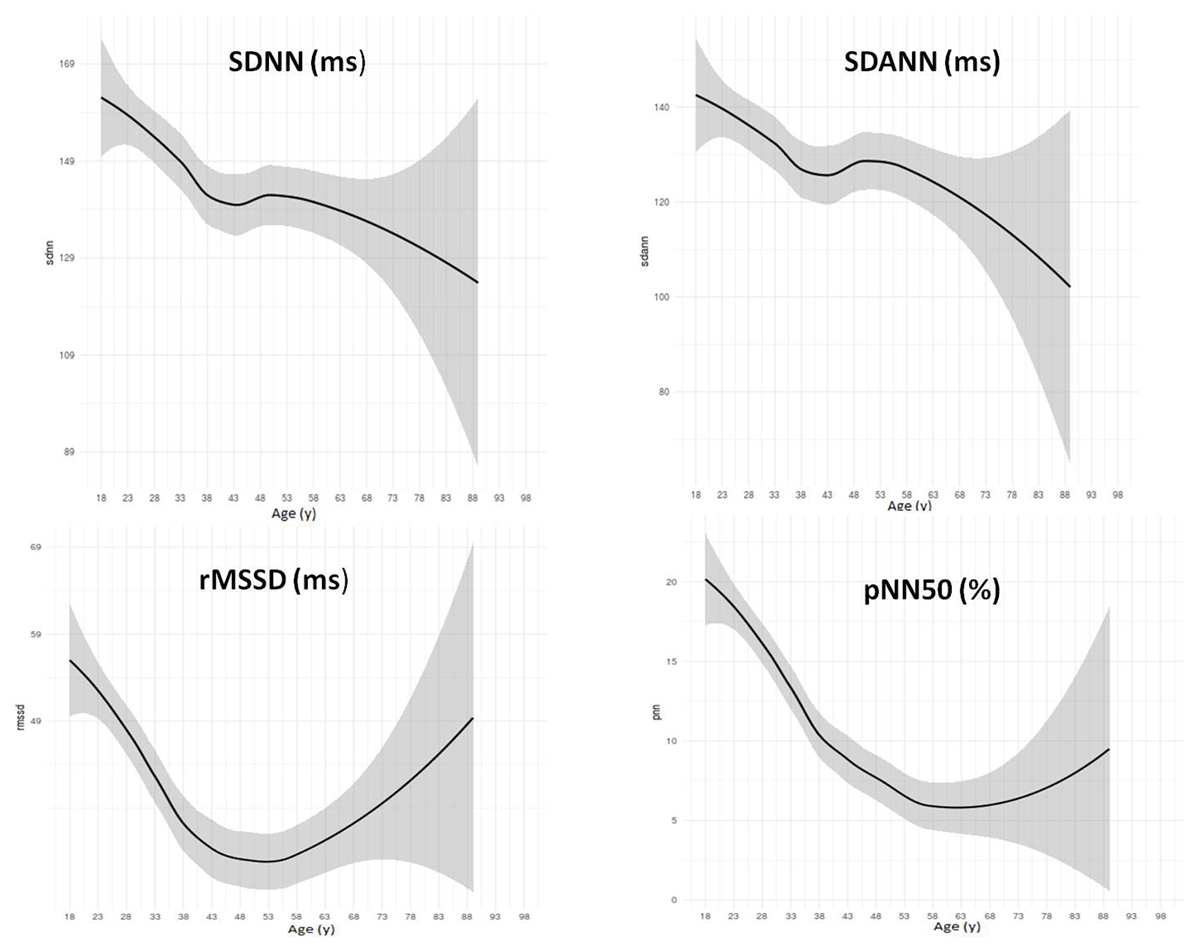
Figure 2
HRV measures showing the LOESS regression curves by 5-year interval of the ‘Healthy’ sample (n = 543). HRV = heart rate variability; LOESS (Locally Weighted Scatterplot Smoothing) regression curve, where the center is the predictive value and shadow represents 95% confidence intervals; SDNN = standard deviation of NN intervals; SDANN = standard deviation of the average of all consecutive 5-minute NN intervals; rMSSD = root mean square of successive difference of NN intervals; pNN50 = percentage of consecutive NN intervals that deviate from one another by more than 50 ms.