
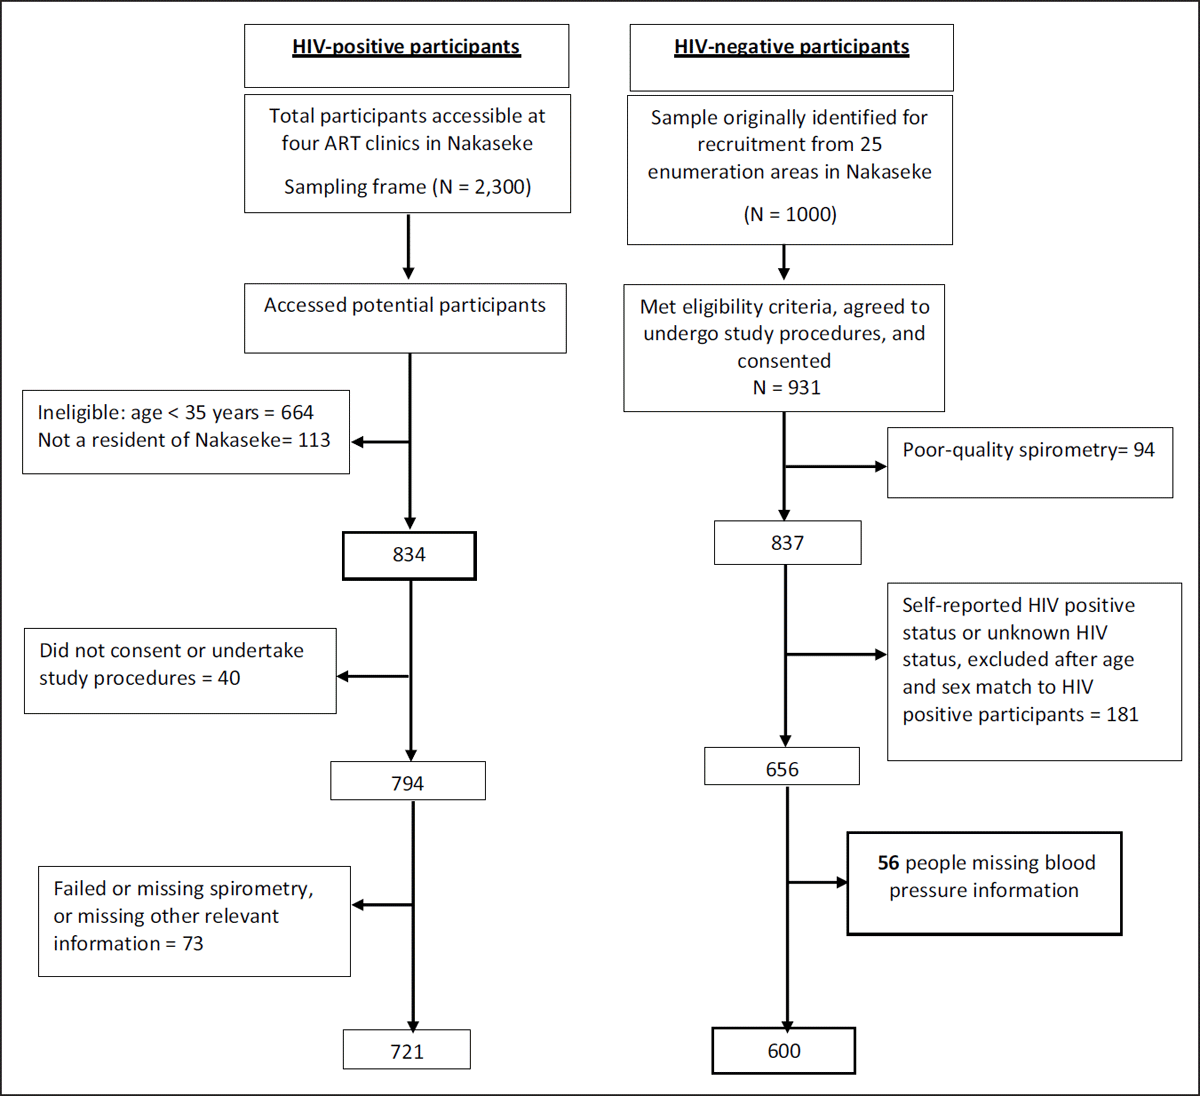
Figure 1
Flow chart for recruitment of HIV-positive and HIV-negative participants and inclusion in the final blood pressure analysis.
Table 1
Demographic and clinical characteristics of participants according to HIV status.
| HIV negative (n = 600) | HIV positive (n = 721) | |
|---|---|---|
| Socio-demographics | ||
| Age (IQR) | 44.3 (38.9, 54.3) | 46.9 (41.5, 53.5) |
| Sex: Female, % | 330 (55.0%) | 431 (59.8%) |
| Marital status, % | ||
| Single | 80 (13.3%) | 97 (13.5%) |
| Married | 406 (67.7%) | 308 (42.7%) |
| Cohabiting | 25 (4.1%) | 156 (21.6%) |
| Separated/Divorced | 39 (6.5%) | 63 (8.7%) |
| Widow/Widower | 50 (8.3%) | 97 (13.5%) |
| Highest level of education, % | ||
| None/incomplete primary | 371 (61.8%) | 280 (38.8%) |
| Primary/incomplete secondary | 185 (30.8%) | 350 (48.5%) |
| Secondary or higher | 44 (7.4%) | 91 (12.7%) |
| Fuel source, n (%) | ||
| Charcoal | 54 (9.0%) | 83 (11.5%) |
| Wood | 545 (90.8%) | 638 (88.5%) |
| Behavioral and clinical characteristics | ||
| Smoking history | ||
| Daily smoker: n (%) | 44 (7.3%) | 39 (5.4%) |
| Occasional smoker: n (%) | 41 (6.8%) | 74 (10.3%) |
| Non-smoker: n (%) | 515 (85.8%) | 608 (84.2%) |
| SBP in mmHg (IQR) | 125 (114, 139) | 121 (111, 133) |
| DBP in mmHg (IQR) | 80 (73, 88) | 76 (69, 85) |
| Elevated BP: n (%) | 361 (60.2%) | 345 (47.8%) |
| Hypertension: n (%) | 201 (33.5%) | 173 (23.9%) |
| BMI in kg/m2 (IQR) | 23.4 (21.0, 26.6) | 21.1 (19.3, 23.6) |
[i] Values are shown as median ± IQR unless otherwise indicated. BMI, body mass index; DBP: Diastolic Blood Pressure; SBP: Systolic Blood Pressure. Elevated blood pressure was defined as SBP ≥130 mmHg or DBP ≥80mmHg. Hypertension was defined as SBP ≥140 mmHg and/or DBP ≥ 90mmHg. IQR: Interquartile Range.
Table 2
Characteristics among HIV positive participants (n = 721).
| Characteristics | n (%) |
|---|---|
| ART | |
| Currently on ART | 652 (90.4%) |
| Not on ART | 69 (9.6%) |
| ART Duration (years) | |
| <1 | 74 (10.2%) |
| 1–4 | 300 (41.6%) |
| 5–9 | 196 (27.2%) |
| 10+ | 77 (10.8%) |
| Missing | 74 (10.2%) |
| Viral Load (VL) | |
| Undetectable VL | 451 (62.6%) |
| Detectable VL | 34 (4.7%) |
| Missing | 236 (32.7%) |
| CD4+T cells (cells/mm3) | |
| <200 | 39 (5.4%) |
| 200–499 | 212 (29.4%) |
| ≥500 | 222 (30.8%) |
| Missing | 248 (34.4%) |
[i] ART: Anti-retroviral therapy, CD4+T: cluster of differentiation CD4 lymphocytes.
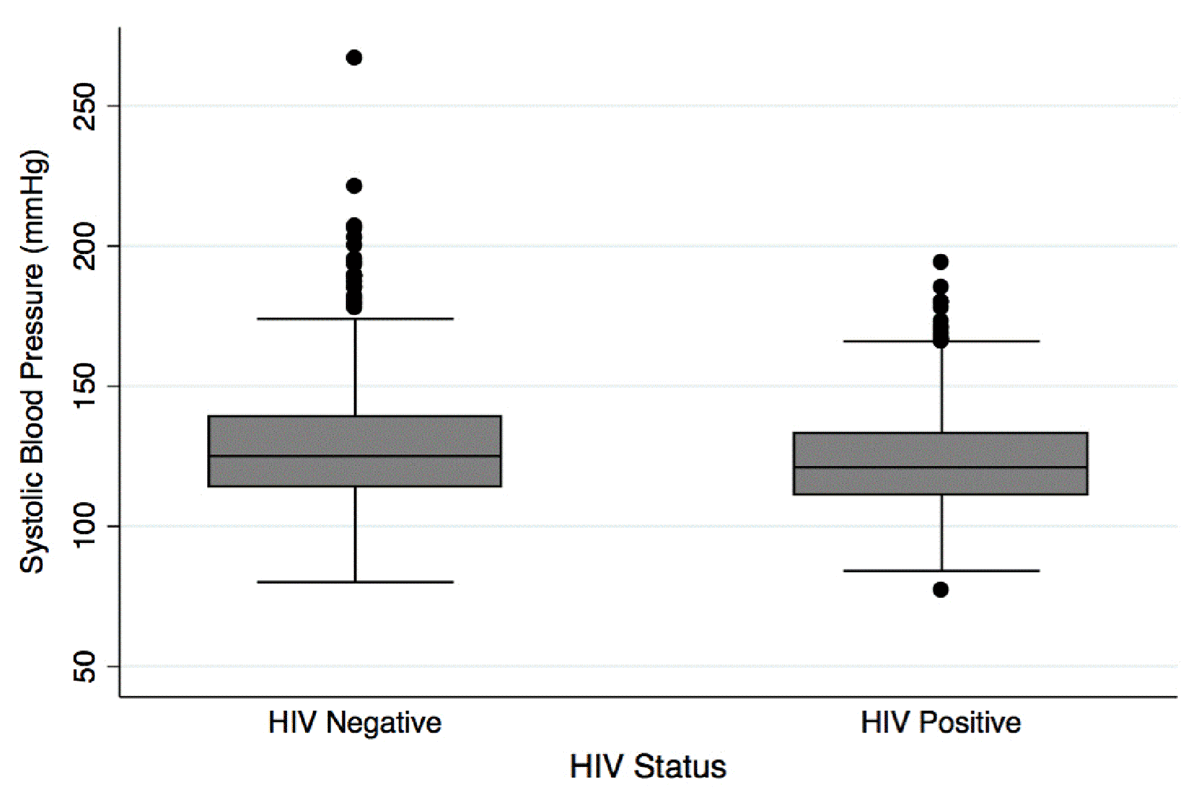
Figure 2
Distribution of systolic blood pressure by HIV status.
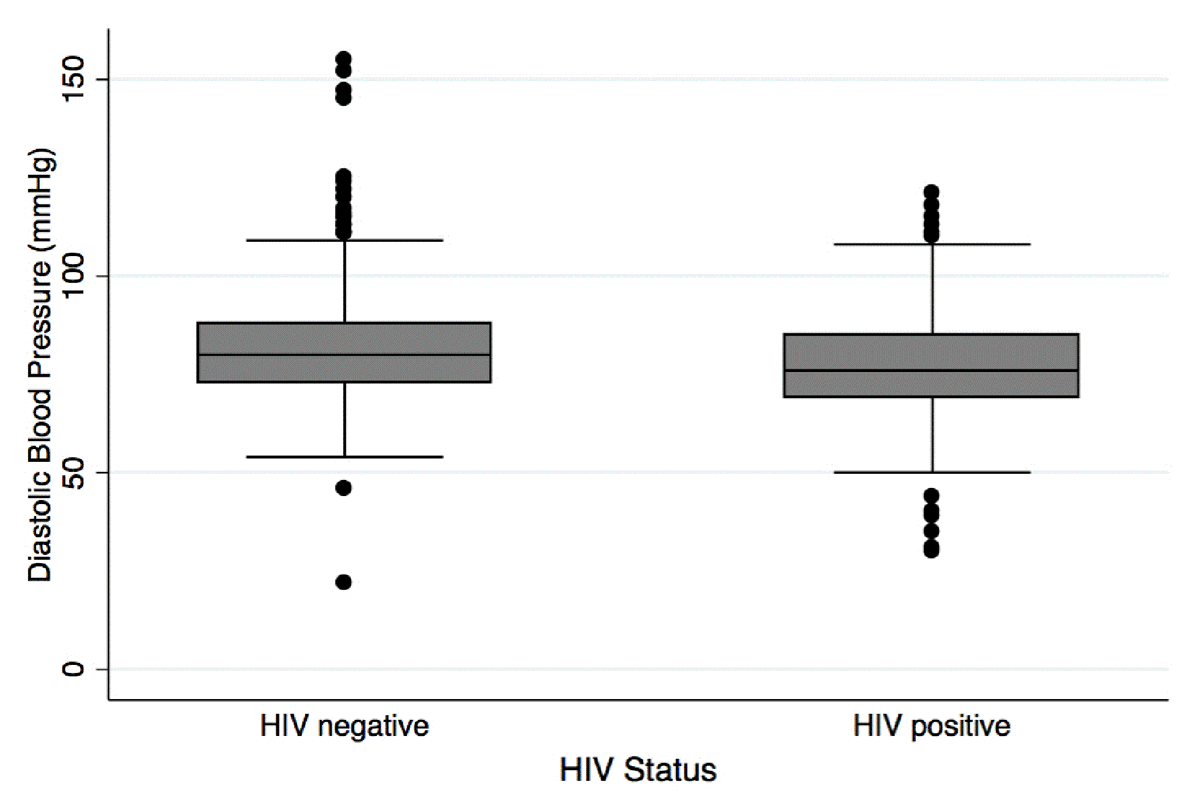
Figure 3
Distribution of diastolic blood pressure by HIV status.
Table 3
Logistic regression results: Associations of HIV status, socio-demographic, and behavioral characteristics with hypertension.
| Unadjusted OR, 95% CI | Adjusted OR, 95% CI | |
|---|---|---|
| HIV Status: positive vs. negative | 0.63 (0.49, 0.80)*** | 0.66 (0.50, 0.88)** |
| Socio-demographics | ||
| Sex: Female vs. Male | 0.96 (0.75, 1.23) | 0.80 (0.60, 1.08) |
| Age | 1.04 (1.02, 1.05)*** | 1.05 (1.03, 1.06)*** |
| Marital status | ||
| Single | Ref | Ref |
| Married | 1.08 (0.75, 1.57) | 1.15 (0.76, 1.73) |
| Cohabiting | 0.94 (0.59, 1.51) | 1.32 (0.80, 2.18) |
| Separated/Divorced | 1.07 (0.62, 1.84) | 1.05 (0.60, 1.86) |
| Widow/Widower | 1.19 (0.73, 1.92) | 1.04 (0.62, 1.74) |
| Highest level of education | ||
| None/incomplete primary | Ref | Ref |
| Primary/incomplete secondary | 1.10 (0.85, 1.41) | 1.29 (0.98, 1.71) |
| Secondary or higher | 1.03 (0.68, 1.56) | 1.19 (0.76, 1.87) |
| Biomass use: Charcoal/Other vs. Wood | 1.12 (0.75, 1.68) | 1.02 (0.66, 1.58) |
| Household size | 0.99 (0.95, 1.04) | 0.97 (0.92, 1.02) |
| Behavioral and clinical characteristics | ||
| Current smoker | ||
| Non-smoker | Ref | Ref |
| Occasional smoker | 0.90 (0.58, 1.38) | 0.83 (0.52, 1.31) |
| Daily smoker | 0.58 (0.33, 1.01) | 0.56 (0.31, 1.02) |
| Body Mass Index (kg/m2): Median (IQR) | 1.07 (1.04, 1.09)*** | 1.08 (1.05, 1.12)*** |
[i] IQR: Interquartile Range; OR: Odds ratio.
Adjusted models included all variables within the table.
P-value: statistical significance (0.049–0.01)*; 0.009–0.001**; less than 0.001***.
Table 4
Logistic regression results showing associations of HIV status (positive vs. negative) with binary hypertension variable, after stratification by participant characteristics.
| Unadjusted OR, 95% CI | Adjusted OR, 95% CI | |
|---|---|---|
| Age | ||
| Age < 55 years | 0.59 (0.45, 0.79)*** | 0.61 (0.44, 0.86)** |
| Age ≥ 55 years | 0.77 (0.48, 1.24) | 0.86 (0.46, 1.59) |
| Sex | ||
| Male | 0.85 (0.60, 1.24) | 0.78 (0.51, 1.20) |
| Female | 0.49 (0.36, 0.68)*** | 0.55 (0.38, 0.84)** |
| Highest level of education | ||
| None/incomplete primary | 0.68 (0.48, 0.97)* | 0.78 (051, 1.19) |
| Primary/incomplete secondary | 0.50 (0.34, 0.74)*** | 0.56 (0.36, 0.88)* |
| Secondary or higher | 0.65 (0.30, 1.43) | 0.61 (0.23, 1.59) |
| Body Mass Index (in kg/m2) | ||
| Quartile 1: ≤20.01 | 0.69 (0.38, 1.24) | 0.44 (0.21, 0.93)* |
| Quartile 2: 20.02–22.05 | 1.17 (0.71, 1.92) | 0.93 (0.52, 1.65) |
| Quartile 3: 22.06–24.95 | 0.70 (0.43, 1.12) | 0.66 (0.38, 1.14) |
| Quartile 4: ≥24.96 | 0.47 (0.29, 0.77)** | 0.41 (0.22, 0.75)** |
| Smoking status | ||
| Non-smoker | 0.62 (0.48, 0.80)*** | 0.62 (0.45, 0.84)** |
| Occasional smoker | 0.58 (0.25, 1.34) | 0.84 (0.27, 2.59) |
| Daily smoker | 0.85 (0.28, 2.55) | 1.40 (0.25, 7.75) |
| Household size | ||
| <6 members | 0.60 (0.44, 0.80)*** | 0.72 (0.51, 1.00) |
| ≥6 members | 0.66 (0.43, 1.03) | 0.51 (0.30, 0.89)* |
| Biomass use | ||
| Charcoal/other | 0.55 (0.26, 1.20) | 0.42 (0.15, 1.21) |
| Firewood | 0.63 (0.49, 0.82)*** | 0.65 (0.49, 0.89)** |
[i] OR: Odds Ratio.
Adjusted models included all variables within the table.
P-value: statistical significance (0.049–0.01)*; 0.009–0.001**; less than 0.001***.
Table 5
Linear regression results: Associations of HIV status, socio-demographic and behavioral characteristics with continuous systolic and diastolic blood pressure.
| Systolic Blood Pressure | Diastolic Blood Pressure | |||
|---|---|---|---|---|
| Unadjusted difference (95% CI) | Adjusted difference (95% CI) | Unadjusted difference (95% CI) | Adjusted difference (95% CI) | |
| HIV Status: positive vs. negative | –5.85 (–7.97, –3.72)*** | –5.07 (–7.40, –2. 37)*** | –4.46 (–5.983, –3.09)*** | –4.02 (–5.57, –2.49)*** |
| Socio-demographics | ||||
| Sex: Female vs. Male | 0.49 (–1.67, 2.66) | –1.93 (–4.36, 0.49) | –0.17 (–1.57, 1.23) | –1.60 (–3.19, –0.00)* |
| Age | 0.49 (0.38, 0.60)*** | 0.54 (0.43, 0.66)*** | 0.09 (0.02, 0.16)* | 0.13 (0.06, 0.21)** |
| Marital status | ||||
| Single | Ref | Ref | Ref | Ref |
| Married | –1.06 (–4.32, 2.21) | –0.37 (–3.64, 2.90) | 0.03 (–2.08, 2.14) | 0.25 (–1.90, 2.40) |
| Cohabiting | –1.57 (–5.67, 2.54) | 1.72 (–2.31, 5.74) | –1.34 (–4.00, 1.31) | 0.94 (–1.71, 3.59) |
| Separated/Divorced | –0.21 (–5.04, 4.62) | –0.40 (–4.99, 4.19) | 0.45 (–2.67, 3.58) | 0.81 (–2.21, 3.83) |
| Widow/Widower | 3.71 (–0.63, 8.04) | 1.83 (–2.39, 6.04) | 0.53 (–2.27, 3.34) | 1.14 (–1.63, 3.91) |
| Highest level of education | ||||
| None/incomplete primary | Ref | Ref | Ref | Ref |
| Primary/incomplete secondary | –1.11 (–3.38, 1.17) | 0.96 (–1.32, 3.24) | 1.16 (–0.31, 2.62) | 2.42 (0.92, 3.92)** |
| Secondary or higher | 2.13 (–5.81, 1.56) | 0.12 (–3.55, 3.78) | –0.91 (–3.28, 1.47) | 0.36 (–2.05, 2.77) |
| Biomass use: Charcoal/Other vs. Wood | 0.99 (–2.52, 4.50) | –0.55 (–4.00, 2.89) | –0.28 (–2.54, 1.99) | 0.02 (–2.24, 2.29) |
| Household size | –0.21 (–0.58, 0.16) | –0.34 (–0.73, 0.04) | –0.13 (–0.38 0.11) | –0.32 (–0.57, –0.06)* |
| Behavioral and clinical characteristics | ||||
| Current smoker | ||||
| Non-smoker | Ref | Ref | Ref | Ref |
| Occasional smoker | –0.59 (–4.40, 3.22) | –1.53 (–5.30, 2.23) | –0.49 (–2.95, 1.97) | –0.26 (–2.73, 2.22) |
| Daily smoker | –2.77 (–7.20, 1.66) | –3.35 (–7.76, 1.06) | –1.72 (–4.58, 1.14) | –1.25 (–4.15, 1.64) |
| Continuous BMI (kg/m2) | 0.80 (0.56, 1.03)*** | 0.88 (0.62, 1.13)*** | 0.61 (0.46, 0.76)*** | 0.61 (0.44, 0.77)*** |
[i] BMI: Body mass index presented as median and Interquartile range. Adjusted models included all variables within the table.
P-value: statistical significance (0.049–0.01)*; 0.009–0.001**; less than 0.001***.
Table 6
Linear regression results: Subgroup analysis showing associations of HIV-related characteristics with continuous systolic and diastolic blood pressure.
| Systolic Blood Pressure | Diastolic Blood Pressure | |||
|---|---|---|---|---|
| Unadjusted difference (95% CI) | Adjusted difference (95% CI) | Unadjusted difference (95% CI) | Adjusted difference (95% CI) | |
| CD4 T cell count | ||||
| ≥300 cells/mm3 | Ref | Ref | Ref | Ref |
| <300 cells/mm3 | –0.55 (–4.75, 3.64) | –1.50 (–5.56, 2.56) | 1.79 (–2.49, 6.08) | –0.79 (–3.60, 2.02) |
| Viral load | ||||
| Undetectable | Ref | Ref | Ref | Ref |
| Detectable | –0.67 (–7.07, 5.73) | –1.83 (–7.95, 4.29) | –0.29 (–3.18, 2.59) | 1.68 (–2.53, 5.90) |
| ART treatment | ||||
| Currently taking | Ref | Ref | Ref | Ref |
| Not taking | –3.11 (–7.55, 1.32) | –2.34 (–6.60, 1.93) | 0.40 (–2.61, 3.41) | 0.75 (–2.21, 3.72) |
| ART duration | ||||
| <5 years | Ref | Ref | Ref | Ref |
| 5–9 | –1.54 (–4.68, 1.59) | –1.66 (–4.70, 1.37) | –1.09 (–3.20, 1.03) | –0.84 (–2.94, 1.25) |
| 10+ | –1.73 (–6.18, 2.71) | –3.15 (–7.49, 1.19) | –0.99 (–3.99, 2.01) | –1.35 (–4.34, 1.65) |
[i] ART: Anti-retroviral therapy, CD4+T: cluster of differentiation CD4 lymphocytes.
Adjusted analyses included age, marital status, highest level of education, biomass use, household size and current smoking status.
P-value: statistical significance (0.049–0.01)*; 0.009–0.001**; less than 0.001***.