
Table 1
Characteristics of risk assessment models for predicting risk of prevalent and/or undiagnosed T2DM.
| Study | Year | Country | Ethnicity | Age (SD)/range | Definition of T2DM as reported (outcome definition) | Cases/Sample size | Risk predictors in the model | Internal validation AUC (95%CI where stated) | Statistical model | Internal (I) and external (E) validation |
|---|---|---|---|---|---|---|---|---|---|---|
| 1. Al Khalaf et al. | 2010 | Kuwait | Caucasians | 36.2 (8.9) | Diagnosis of T2DM based on ADA 2003 criteria, If FPG was ≥ 7.0 mmol/L or random glucose was ≥ 11.1 mmol/L, participants were classified as having newly diagnosed T2DM | 120/560 | Age, waist circumference, blood pressure medication, diabetes in sibling | 0.82 | Logistic | Compared with other risk scores |
| 2. Al-Lawati et al. | 2007 | Oman | Caucasians | Age (SD) Males = 38.4 (13.7)Females = 36.7 (12.8) | T2DM was diagnosed according to 1998 WHO criteria for OGTT (FPG 11.1 mmol/l 2-h post 75-g glucose load | 485/4,881 | Age, waist circumference, BMI, family history of diabetes, HTN | 0.83 (0.82–0.84) | Logistic | I |
| 3. Baan et al. | 1999 | The Netherlands | Caucasians | Range: 55–75 yrs | T2DM defined as use of antidiabetic
medication (insulin or oral hypoglycaemic medication) and/or 2-h PG ≥ 11.1 mmol/L according to WHO criteria | 118/989 | Age, sex, use of antihypertensive medication, obesity (BMI ≥ 30) | 0.74 (0.70–0.78) | Logistic | E Validation: Hoorn study |
| 4. Bang et al. | 2009 | USA | Multi-ethnic (NHANES) | 58.3 (1.65) for the cases | Undiagnosed T2DM defined as FPG ≥ 7.0 mmol/L (≥126 mg/dL) | 210/5,258 | Age, sex, family history of diabetes, HTN, obesity (BMI or waist circumference), physical activity | 0.79 | Logistic | Compared with other models + E Validation: (ARIC/CHS) |
| 5. Barengo et al. | 2016 | Colombia | Caucasians | 47.2 (15.1) | ADA 2004 criteria Individuals who had fasting plasma glucose level ≥ 126 mg/dl or 2h plasma glucose ≥ 200 mg/dl were classified as having T2DM. People with T2DM, IGT or IFG were classified as having IGR | IGR = 565/2,060 | IGR model: age, waist circumference, antihypertensive drug therapy and family history of diabetes (Biological father, mother or sibling) | 0.72 (0.69–0.74) | Logistic | Compared their model with a validated FINDRISC model |
| 6. Berber et al. | 2001 | Mexico | Caucasians | Age (SD) 39.0 (7.1) for men 39.1 (14.3) for women | T2DM was defined as a FPG of 7.0mmol/l and/or 2hPG 11.1mmol/l | Men 172/2,426Women 346/5,939 | Men: Smoking, age, BMIWomen: WHR, BMI, age | NS, but they report the Nagelkerke, r2 = 0.104 for men and Nagelkerke, r2 = 0.031 for women | Logistic | NS |
| 7. Chaturvedi et al. | 2008 | India | Asian | Range: 35–64 yrs | Undiagnosed T2DM defined as those with FPG ≥ 126 mg/dL (≥ 7.0 mmol/L) but who were not aware of their glycaemic status | 199/4,044 | Age, blood pressure, waist circumference, family history of diabetes | 0.72 (0.68–0.75) | Logistic | EValidation: Data from multi-centre cross-sectional baseline survey |
| 8. Chien et al. | 2010 | Taiwan | Asian | HbA1c < 7% (53mmol/mol) = 51.0 (10.9)HbA1c ≥ 7% (53mmol/mol) = 56.6 (10.2) | Abnormally high HbA1c levels were defined as ≥ 7% (53mmol/mol) | 323/17,773 | Age, sex, family history of diabetes, BMI, waist circumference, and systolic blood pressure | 0.71 (0.66– 0.76) | Logistic | I, and they compared the models with the Cambridge model |
| 9. Dong et al. | 2011 | China | Asian | 54.4 (7.8) | Diagnosis of T2DM was made according to the WHO 1999 diagnostic criteria: FPG level ≥ 7.0 mmol/L or 2hPG level ≥ 11.1 mmol/L | Total sample size 2,985, cases NS | Age, BMI, WHR, systolic pressure, diastolic pressure, heart rate, and family history of diabetes (any) | 0.82 (0.78–0.86) | Logistic | I |
| 10. Dugee et al. | 2015 | Mongolia | Asian | 46.4 (8.1) | Undiagnosed T2DM was defined as fasting blood glucose levels ≥ 6.1 mmol/l | 59/1,018 | Sex, waist circumference, HTN or medication for high blood pressure, elevated glucose, leisure time physical activity and sitting time 6 hours or more during day | 0.76 (0.70–0.82) | Logistic | I |
| 11. Gao et al. | 2010 | China | Asian | Men = 26.5 (3.5) Women = 26.1 (3.9) | T2DM defined according to 2006 WHO/IDF criteria. In individuals without known T2DM, undiagnosed T2DM was determined if person had FPG ≥ 7.0 mmol/L and/or postchallenge PG ≥ 11.1 mmol/L | Men = 81/741Women = 113/1,245 | Age, waist circumference, family history of diabetes | 0.64 (0.59–0.68) in men0.69 (0.64–0.72) in women | Logistic | I |
| 12. Glümer et al. | 2004 | Denmark | Caucasians | 46.0 (7.9) | Individuals without known T2DM and with FPG ≥ 7.0 mmol/L or 2-h PG ≥ 11.1 mmol/L defined as having SDM | 135/3,250 | Age, BMI, sex, known HTN, physical activity at leisure time, family history of diabetes | 0.80 (0.77–0.84) | Logistic | I and E Validation: ADDITION pilot study |
| 13. Gray et al. | 2013 | Portugal | Caucasians | 51.5 (16.5) | Participants were classified as having IFG if their fasting glucose was ≥ 5.6 mmol/l and T2DM was defined as a fasting glucose result of ≥ 7.0 mmol/l | IFG = 338/3,374T2DM = 50/3,374 | Age, sex, BMI and current HTN | For IFG/T2DM.0.70 (0.68, 0.72) | Logistic | EValidation: EPI-Porto study |
| 14. Gray et al. | 2012 | UK | Multi-ethnic i.e. 76.5% Caucasian and 23.5 % other ethnicities (91% being south Asians) | 57.3 (9.6) | IGR diagnosed using WHO 2011 diagnostic
criteria and T2DM diagnosed using OGTT or HbA1c ≥ 6.5% (48 mmol/mol) For this study IGR refers to the composite of IGT and/or IFG | IGR/DM = 1,412/6,390 | Age, ethnicity, sex, family history of diabetes (any type), antihypertensive therapy and BMI | 0.70 (0.68, 0.72) | Logistic | EValidation: Screening Those At Risk (STAR) |
| 15. Gray et al. | 2010 | UK | Multi-ethnic (i.e. 73% white European, 22% South Asian and others) | Aged 40–75 years 57.3 (9.6) | Participants diagnosed with T2DM according to WHO criteria with FPG ≥ 7mmol/L and/or 2-h PG ≥ 11.1 mmol/L. IFG defined as FPG between 6.1 and 6.9 mmol/L inclusive | IGR/DM = 1,249/6,186 | Age, ethnicity, sex, first-degree family history of diabetes, antihypertensive therapy or history of HTN, waist circumference, BMI | 0.69 (0.68–0.71) | Logistic | EValidation: Screening Those At Risk (STAR |
| 16. Gül et al. | 2014 | US | Caucasians | For DM = 57.4 (7.7) | T2DM self-reported using a questionnaire on medical history | 2,593/5,639 | Familial diabetes history, high blood pressure, cholesterol, and BMI | 0.77 | Logistic | NS |
| 17. Hao zhou et al. | 2017 | China | Asian | 48.2 (6.8) | The cases of undiagnosed T2DM were ascertained by fasting glucose level without OGTT or HBA1c | 234/5,453 | Sex, age, family history of diabetes, physical activity, waist circumference, dyslipidemia, diastolic blood pressure, BMI | 0.72 (0.71–0.73) | Logistic | E and compared with other scores Validation: Henan population |
| 18. Heianza et al. | 2013 | Japan | Asian | 48.4 (9.6) | The cases of undiagnosed T2DM were ascertained by fasting plasma glucose ≥ 7.0 mmol/L or glycated hemoglobin ≥ 6.5%) | 965/33,335 | Age, sex, family history of diabetes, current smoking habit, BMI, and HTN | 0.77 (0.76–0.78) | Logistic | E and compared with existing scoresValidation: Toranomon Hospital Health Management Center |
| 19. Keesukphan et al. | 2007 | Thailand | Asian | 48.4 (10.9) | T2DM defined based on 75-g OGTT and WHO Diabetes Study Group | NS/429 | Age, BMI, known HTN | 0.74 | Logistic | EValidation: NS clearly |
| 20. Lee et al. | 2012 | South Korea | Asian | 51.2 (0.8) | Undiagnosed T2DM was defined as a fasting plasma glucose ≥ 126 mg/dL and/orNon-fasting plasma glucose ≥ 200mg/dL | 341/9,602 | Age, family history of diabetes, HTN, waist circumference, smoking and alcohol intake | 0.73 (0.72–0.74) | Logistic | I |
| 21. Pires de Sousa et al. | 2009 | Brazil | Multi-ethnic | Age range 25–64yrs | FPG > 126 mg/dL (7.0 mmol/L), that is, provisional diagnosis of T2DM according to ADA criteria, classified as T2DM patients | 118/1,224 | Age, BMI, known HTN | 0.77 | Logistic | EValidation: Ouro Preto, Brazil |
| 22. Pongchaiyakul et al. | 2011 | Thailand | Asian | 47.0 (10.4) for women 49.4 (11.0) for men Mean age (range) = 48(15–85yrs) | T2DM was diagnosed using the
WHO Criteria using FPG 126 mg/dl and repeated within 1 week | n = 125/1,693 for men n = 98/2,621 for women n = 223/4,314 for total population | Age, BMI and SBP for both men and women | 0.75 (0.71–0.78) total
population 0.70 for women 0.77 for men. | Logistic | I |
| 23. Wang et al. | 2013 | China | Asian | 53.2 (10.4) | T2DM was defined as having a fasting plasma glucose level of more than 7.0 mmol/L and/or self- reported current treatment with anti-diabetes medication (insulin or oral hypoglycemic agents) | 561/6,480 | Sex, family history of diabetes, physical activity, pulse pressure and waist circumference. | 0.74 (0.72–0.76) | Logistic | I |
| 24. Xie et al. | 2010 | China | Asian | 35–74 years | Participants without a previous diagnosis of T2DM were categorized as follows: undiagnosed T2DM (FPG ≥ 7.0 mmol/L) and impaired fasting glycaemia (6.1 to 6.9 mmol/L). T2DM was defined as self-reported history of diabetes plus undiagnosed T2DM | 994/15,540 | Men: waist circumference, age, and
WHR Women: WHR, waist circumference and BMI | Men = 0.71 Women = 0.73 | Logistic | I |
| 25. Zhou et al. | 2013 | China | Asian | Age range 20–74 years Men 44 (14) Women 44 (13) | Undiagnosed T2DM was detected based on fasting plasma glucose ≥ 7.0 mmol/L or 2-h plasma glucose ≥ 11.1 mmol/L | 2,720/41,809 | Age, sex, waist circumference, BMI, systolic blood pressure, and family history of diabetes | 0.75 (0.74–0.76) | Logistic | EValidation: Two studies in Qingdao. |
[i] AUC, area under the curve; ADA, American Diabetes Association; BMI, body mass index; T2DM, type 2 diabetes mellitus; WHO, World Health Organization; FPG, fasting plasma glucose; OGTT, oral glucose tolerance test; 2hPG, two-hour 75-g post load plasma glucose level; IFG, impaired fasting glucose; IGT, impaired glucose tolerance; IGR, impaired glucose regulation; NS, not stated; WHR, waist to hip ratio; HbA1c, glycated hemoglobin; SBP, systolic blood pressure; DBP, diastolic blood pressure; SDM, screen detected diabetes; HTN, hypertension.
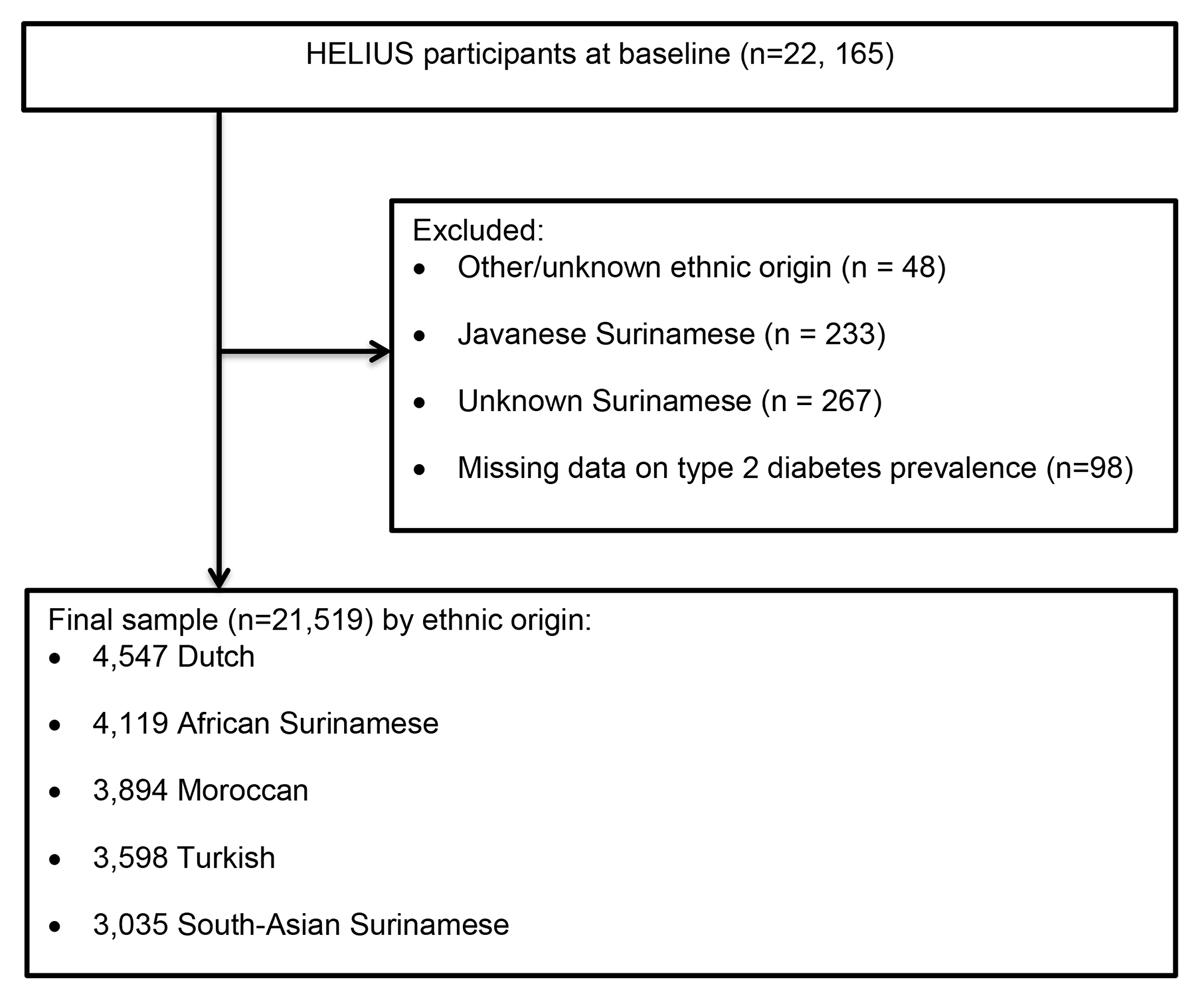
Figure 1
Flow chart of participants included (n = 21,519) and excluded (n = 646) in the current study.
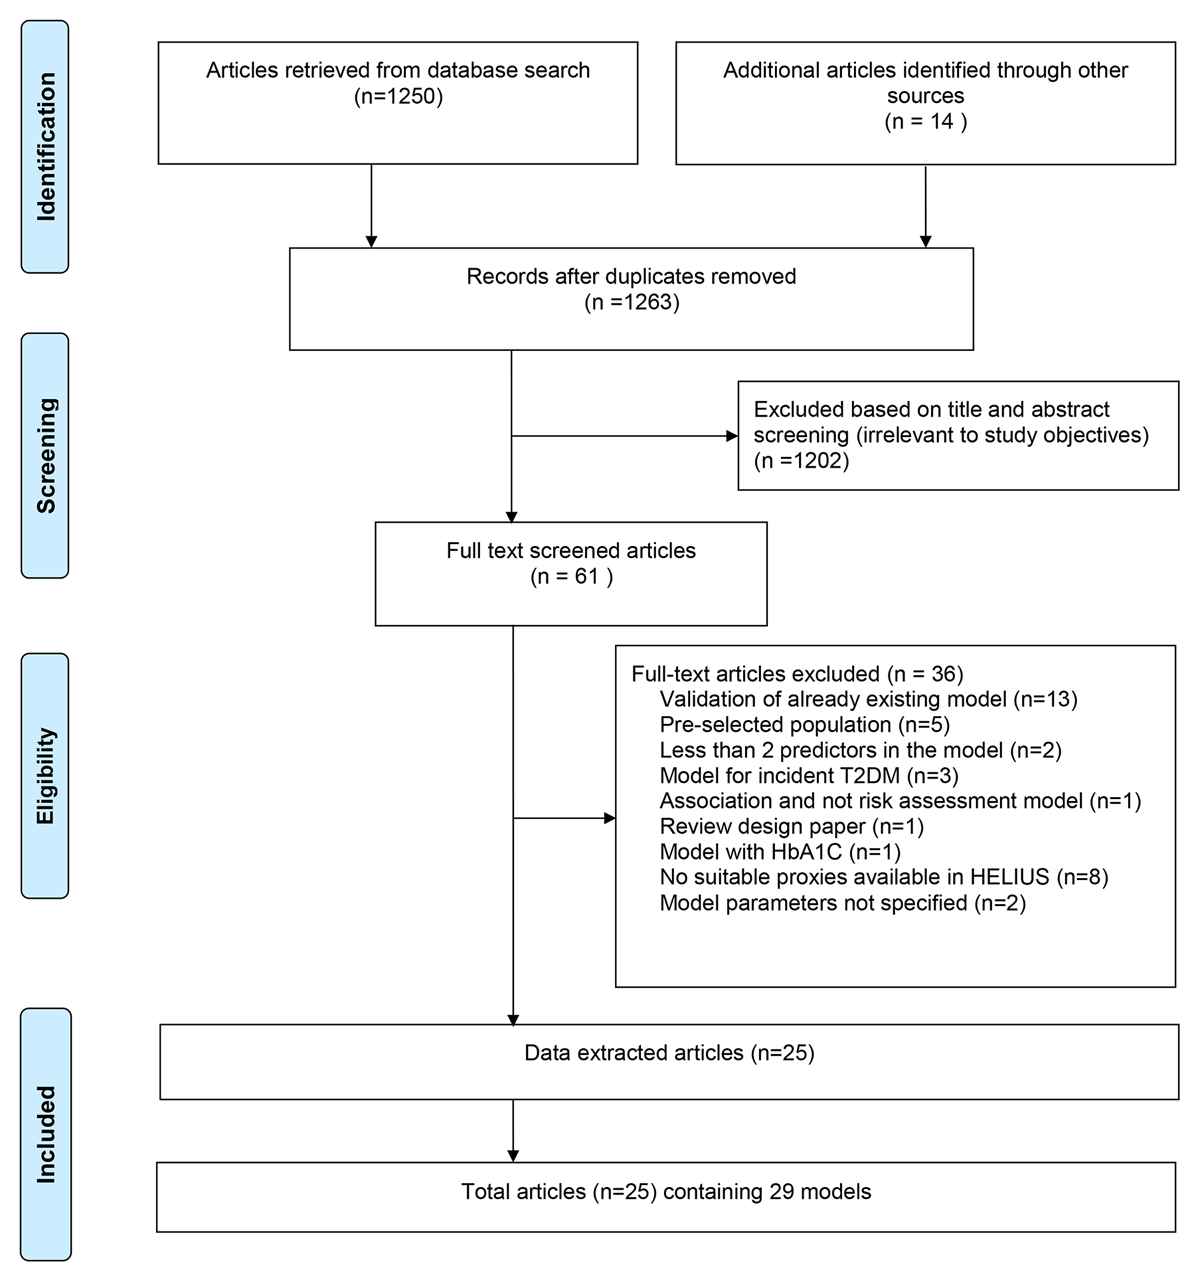
Figure 2
Overview of identified (n = 25) and excluded (n = 1,239) studies included in the review.
Table 2
Performance (Areas under the Curves with 95%CIs) of 29 models for prediction of prevalent or undiagnosed T2DM, for the total population and stratified by the ethnic groups in HELIUS.
| Study | Ethnic group | |||||||
|---|---|---|---|---|---|---|---|---|
| Internal validation AUC | Total population | Dutch | South Asian Surinamese | AfricanSurinamese | Ghanaian | Turkish | Moroccan | |
| Asian models | ||||||||
| Chaturvedi et al. 2008 | 0.72 | 0.80 (0.79–0.81) | 0.83 (0.81–0.86) | 0.78 (0.76–0.80) | 0.75 (0.72–0.77) | 0.73 (0.69–0.76) | 0.82 (0.79–0.84) | 0.83 (0.82–0.85) |
| Chien et al. 2010 | 0.71 | 0.82 (0.81–0.83) | 0.86 (0.81–0.91) | 0.80 (0.78–0.82) | 0.79 (0.76–0.81) | 0.76 (0.72–0.80) | 0.86 (0.83–0.88) | 0.83 (0.81–0.86) |
| Dong et al. 2011 | 0.82 | 0.88 (0.87–0.88) | 0.91 (0.89–0.94) | 0.89 (0.87–0.90) | 0.89 (0.87–0.91) | 0.84 (0.81–0.88) | 0.92 (0.90–0.94) | 0.93 (0.92–0.94) |
| Dugee et al. 2015 | 0.76 | 0.81 (0.80–0.82) | 0.81 (0.79–0.84) | 0.83 (0.81–0.84) | 0.79 (0.77–0.81) | 0.76 (0.73–0.79) | 0.82 (0.80–0.84) | 0.82 (0.80–0.84) |
| Gao et al. 2010 | ||||||||
| men | 0.64 | 0.80 (0.79–0.82) | 0.85 (0.81–0.88) | 0.79 (0.76–0.82) | 0.78 (0.74–0.82) | 0.72 (0.67–0.78) | 0.82 (0.78–0.85) | 0.81 (0.78–0.85) |
| women | 0.69 | 0.85 (0.84–0.86) | 0.92 (0.89–0.96) | 0.80 (0.77–0.83) | 0.82 (0.79–0.85) | 0.82 (0.78–0.86) | 0.86 (0.83–0.88) | 0.87 (0.85–0.89) |
| Hao zhou et al. 2017 | 0.72 | 0.82 (0.81–0.83) | 0.87 (0.84–0.89) | 0.79 (0.77–0.81) | 0.79 (0.77–0.81) | 0.74 (0.70–0.78) | 0.83 (0.81–0.85) | 0.83 (0.81–0.85) |
| Heianza et al. 2013 | 0.77 | 0.79 (0.78–0.80) | 0.85 (0.82–0.87) | 0.78 (0.76–0.81) | 0.74 (0.72–0.77) | 0.72 (0.68–0.76) | 0.79 (0.76–0.81) | 0.83 (0.81–0.85) |
| Keesukphan et al. 2007 | 0.74 | 0.76 (0.75–0.77) | 0.81 (0.77–0.84) | 0.74 (0.72–0.77) | 0.73 (0.70–0.76) | 0.70 (0.65–0.74) | 0.77 (0.74–0.80) | 0.77 (0.75–0.80) |
| Lee et al. 2012 | 0.73 | 0.75 (0.74–0.76) | 0.79 (0.76–0.82) | 0.73 (0.71–0.75) | 0.71 (0.69–0.74) | 0.71 (0.67–0.75) | 0.75 (0.72–0.77) | 0.77 (0.75–0.79) |
| Pongchaiyakul et al. 2011 | ||||||||
| men | 0.70 | 0.74 (0.72–0.75) | 0.81 (0.77–0.85) | 0.72 (0.68–0.75) | 0.73 (0.69–0.77) | 0.67 (0.61–0.74) | 0.75 (0.71–0.79) | 0.76 (0.73–0.80) |
| women | 0.77 | 0.78 (0.76–0.79) | 0.83 (0.78–0.89) | 0.75 (0.72–0.79) | 0.73 (0.70–0.77) | 0.70 (0.64–0.76) | 0.82 (0.79–0.85) | 0.79 (0.77–0.82) |
| Wang et al. 2013 | 0.74 | 0.76 (0.75–0.77) | 0.84 (0.81–0.86) | 0.73 (0.71–0.75) | 0.76 (0.74–0.78) | 0.71 (0.68–0.73) | 0.78 (0.76–0.80) | 0.78 (0.76–0.80) |
| Xie et al. 2010 | ||||||||
| men | 0.71 | 0.73 (0.71–0.74) | 0.80 (0.76–0.84) | 0.70 (0.66–0.73) | 0.75 (0.70–0.79) | 0.70 (0.64–0.77) | 0.73 (0.69–0.77) | 0.73 (0.69–0.77) |
| women | 0.73 | 0.81 (0.79–0.82) | 0.88 (0.84–0.93) | 0.76 (0.73–0.79) | 0.76 (0.72–0.79) | 0.72 (0.66–0.77) | 0.82 (0.79–0.85) | 0.84 (0.82–0.87) |
| Zhou et al. 2013 | 0.75 | 0.80 (0.79–0.81) | 0.88 (0.86–0.91) | 0.81 (0.79–0.83) | 0.80 (0.77–0.82) | 0.76 (0.72–0.79) | 0.85 (0.83–0.87) | 0.86 (0.84–0.87) |
| Caucasian models | ||||||||
| Al Khalaf et al. 2010 | 0.82 | 0.81 (0.80–0.82) | 0.85 (0.82–0.88) | 0.78 (0.76–0.80) | 0.78 (0.76–0.81) | 0.76 (0.72–0.80) | 0.83 (0.80–0.85) | 0.81 (0.79–0.83) |
| Al-Lawati et al. 2007 | 0.83 | 0.81 (0.80–0.82) | 0.85 (0.82–0.88) | 0.78 (0.76–0.80) | 0.77 (0.74–0.79) | 0.74 (0.72–0.79) | 0.81 (0.79–0.84) | 0.83 (0.80–0.85) |
| Baan et al. 1999 | 0.74 | 0.82 (0.81–0.83) | 0.87 (0.85–0.89) | 0.82 (0.81–0.84) | 0.81 (0.79–0.82) | 0.75 (0.72–0.78) | 0.83 (0.81–0.85) | 0.86 (0.84–0.87) |
| Barengo et al. 2016 | 0.72 | 0.76 (0.75–0.77) | 0.79 (0.77–0.80) | 0.75 (0.74–0.77) | 0.75 (0.73–0.76) | 0.70 (0.68–0.72) | 0.76 (0.74–0.78) | 0.78 (0.77–0.80) |
| Berber et al. 2001 | ||||||||
| men | NS | 0.77 (0.75–0.78) | 0.82 (0.78–0.86) | 0.78 (0.76–0.81) | 0.73 (0.69–0.78) | 0.65 (0.58–0.71) | 0.81 (0.77–0.84) | 0.82 (0.79–0.85) |
| women | NS | 0.82 (0.81–0.83) | 0.90 (0.85–0.94) | 0.79 (0.76–0.82) | 0.77 (0.74–0.80) | 0.74 (0.68–0.79) | 0.86 (0.83–0.88) | 0.86 (0.84–0.88) |
| Glümer et al. 2004 | 0.80 | 0.82 (0.81–0.83) | 0.86 (0.83–0.89) | 0.81 (0.79–0.83) | 0.78 (0.76–0.81) | 0.74 (0.70–0.78) | 0.84 (0.82–0.86) | 0.85 (0.84–0.87) |
| Gray et al. 2013 | 0.70 | 0.78 (0.77–0.78) | 0.81 (0.79–0.82) | 0.77 (0.76–0.79) | 0.75 (0.74–0.77) | 0.71 (0.69–0.73) | 0.80 (0.79–0.82) | 0.81 (0.80–0.83) |
| Gül et al. 2014 | 0.77 | 0.67 (0.66–0.68) | 0.77 (0.73–0.81) | 0.66 (0.64–0.68) | 0.70 (0.67–0.72) | 0.61 (0.57–0.65) | 0.69 (0.67–0.72) | 0.69 (0.67–0.72) |
| Multi-ethnic models | ||||||||
| Bang et al. 2009 | 0.79 | 0.82 (0.81–0.83) | 0.86 (0.84–0.89) | 0.80 (0.77–0.82) | 0.78 (0.75–0.80) | 0.77 (0.73–0.80) | 0.83 (0.81–0.85) | 0.84 (0.82–0.86) |
| Gray et al. 2010 | 0.69 | 0.73 (0.72–0.74) | 0.79 (0.77–0.80) | 0.75 (0.74–0.77) | 0.75 (0.74–0.77) | 0.69 (0.67–0.72) | 0.77 (0.75–0.78) | 0.78 (0.77–0.80) |
| Gray et al. 2012 | 0.70 | 0.75 (0.74–0.76) | 0.80 (0.78–0.81) | 0.78 (0.77–0.80) | 0.77 (0.76–0.79) | 0.71 (0.70–0.73) | 0.79 (0.78–0.81) | 0.81 (0.80–0.83) |
| Pires de sousa et al. 2009 | 0.77 | 0.79 (0.78–0.80) | 0.85 (0.82–0.88) | 0.78 (0.76–0.80) | 0.76 (0.73–0.78) | 0.70 (0.65–0.74) | 0.81 (0.79–0.84) | 0.82 (0.80–0.84) |
[i] NS means Not stated.