
Table 1
Bivariate Analysis of the Variables Associated with Insulin Resistance in a Population of Patients with Chagas Disease.
| Variable | Insulin resistance (Yes) n = 74 | Insulin resistance (No) n = 126 | p-value |
|---|---|---|---|
| Sex | |||
| Females | 46 (62.16) | 61 (48.41) | 0.060 |
| Males | 28 (37.84) | 65 (51.59) | |
| Age (Years) | 54.9 ± 10.3 | 54.4 ± 13.3 | 0.792 |
| Education | |||
| None | 13 (17.57) | 10 (7.94) | 0.298* |
| Incomplete Primary School | 28 (37.84) | 53 (42.06) | |
| Complete Primary School | 18 (24.32) | 36 (28.57) | |
| Incomplete Secondary School | 2 (2.70) | 5 (3.97) | |
| Complete Secondary School | 8 (10.81) | 17 (13.49) | |
| Technical | 1 (1.35) | 1 (0.79) | |
| Incomplete University | 0 (0.00) | 2 (1.59) | |
| Complete University | 4 (5.41) | 2 (1.59) | |
| Occupation | |||
| None | 30 (40.54) | 49 (38.89) | 0.238 |
| Student | 0 (0.00) | 3 (2.38) | |
| Employee | 9 (12.16) | 5 (3.97) | |
| Independent | 28 (37.84) | 53 (42.06) | |
| Unemployed/Dismissed | 5 (6.76) | 13 (10.32) | |
| Pensioner/Retired | 2 (2.70) | 3 (2.38) | |
| Social Security | |||
| Contributory | 25 (33.78) | 40 (31.75) | 0.677 |
| Subsidized | 47 (63.51) | 81 (64.29) | |
| Prepaid | 1 (1.35) | 0 (0.00) | |
| Special Regime | 1 (1.35) | 3 (2.38) | |
| None | 0 (0.00) | 2 (1.59) | |
| Area of Residence | |||
| Urban | 47 (63.51) | 56 (44.44) | 0.009 |
| Rural | 27 (36.49) | 70 (55.56) | |
| Smoking | |||
| No | 73 (98.65) | 122 (96.83) | 0.653 |
| Yes | 1 (1.35) | 4 (3.17) | |
| Alcohol Consumption | |||
| No | 59 (79.73) | 90 (71.43) | 0.240 |
| Yes | 15 (20.27) | 36 (28.57) | |
| Physical Activity | |||
| Low | 46 (36.51) | 34 (45.95) | 0.423* |
| Moderate | 31 (24.60) | 19 (25.68) | |
| High | 49 (38.89) | 21 (28.38) | |
| NYHA | |||
| I | 62 (83.78) | 97 (76.98) | 0.252* |
| II | 10 (13.51) | 24 (19.05) | |
| III | 2 (2.70) | 5 (3.97) | |
| BMI (kg/m2) | 29.5 (25.9–32.3) | 24.1 (21.8–26.8) | 0.000 |
| HWI | 0.93 ± 0.07 | 0.89 ± 0.08 | 0.000 |
| SBP (mmHg) | 125 ± 17 | 119 ± 15 | 0.014 |
| DBP (mmHg) | 76 ± 11 | 71 ± 9.3 | 0.000 |
| MAP (mmHg) | 93 ± 12 | 87 ± 10 | 0.000 |
| LVEF (%) | 56 (45–60) | 58 (43–64) | 0.479 |
| Glycaemia (mg/dL) | 99 (95–109) | 95 (91–101) | 0.000 |
| Serum Insulin Levels (mIU/L) | 15.3 (12.7–18.9) | 6.0 (4.3–7.9) | 0.000 |
| Hb1Ac (%) | 5.5 (5.2–5.7) | 5.4 (5.1–5.6) | 0.010 |
| PCR (mg/L) | 2.2 (1.3–4.4) | 1.2 (0.6–2.8) | 0.000 |
| Total Cholesterol (mg/dL) | 202 (178–234) | 189 (153–215) | 0.017 |
| LDL (mg/dL) | 122 (96–145) | 113 (87–136) | 0.140 |
| HDL (mg/dL) | 38 (33–47) | 48 (42–55) | 0.000 |
| Triglycerides (mg/dL) | 178 (125–279) | 110 (83–151) | 0.000 |
| NT-proBNP (pg/ml) | 101 (42–338) | 92 (48–957) | 0.236 |
| Aldosterone (pg/mL) | 53.5 (36.6–77.5) | 58.2 (40.7–94.9) | 0.181 |
| Angiotensin-2 (pg/mL) | 27.2 (17.5–39.5) | 26.2 (16.5–39.1) | 0.581 |
| Norepinephrine (pg/mL) | 204.1 (95.4–361.1) | 233.9 (121.7–404.1) | 0.218 |
| HOMA-IR Index | 3.9 (3.1–5.1) | 1.4 (1.0–1.9) | 0.000 |
| ACEI/ARB | |||
| No | 41 (55.41) | 79 (62.70) | 0.370 |
| Yes | 33 (44.59) | 47 (37.30) | |
| Beta-blockers | |||
| No | 38 (51.35) | 77 (61.11) | 0.178 |
| Yes | 36 (48.65) | 49 (38.89) | |
| Aldosterone Antagonists | |||
| No | 55 (74.32) | 90 (71.43) | 0.658 |
| Yes | 19 (25.68) | 36 (28.57) | |
| Diuretics | |||
| No | 59 (79.73) | 104 (82.54) | 0.621 |
| Yes | 15 (20.27) | 22 (17.46) | |
| Digoxin | |||
| No | 68 (91.89) | 119 (94.4) | 0.480 |
| Yes | 6 (8.11) | 7 (5.56) | |
[i] This table contains n (%) for categorical variables and median (first and third quartile) or mean (standard deviation) for continuous variables, * Chi2 trend.
Abbreviations: BMI: Body Mass Index; HWI: Hip Waist Index ACEI/ARB: Angiotensin-Converting Enzyme Inhibitor/Angiotensin Receptor Blocker.
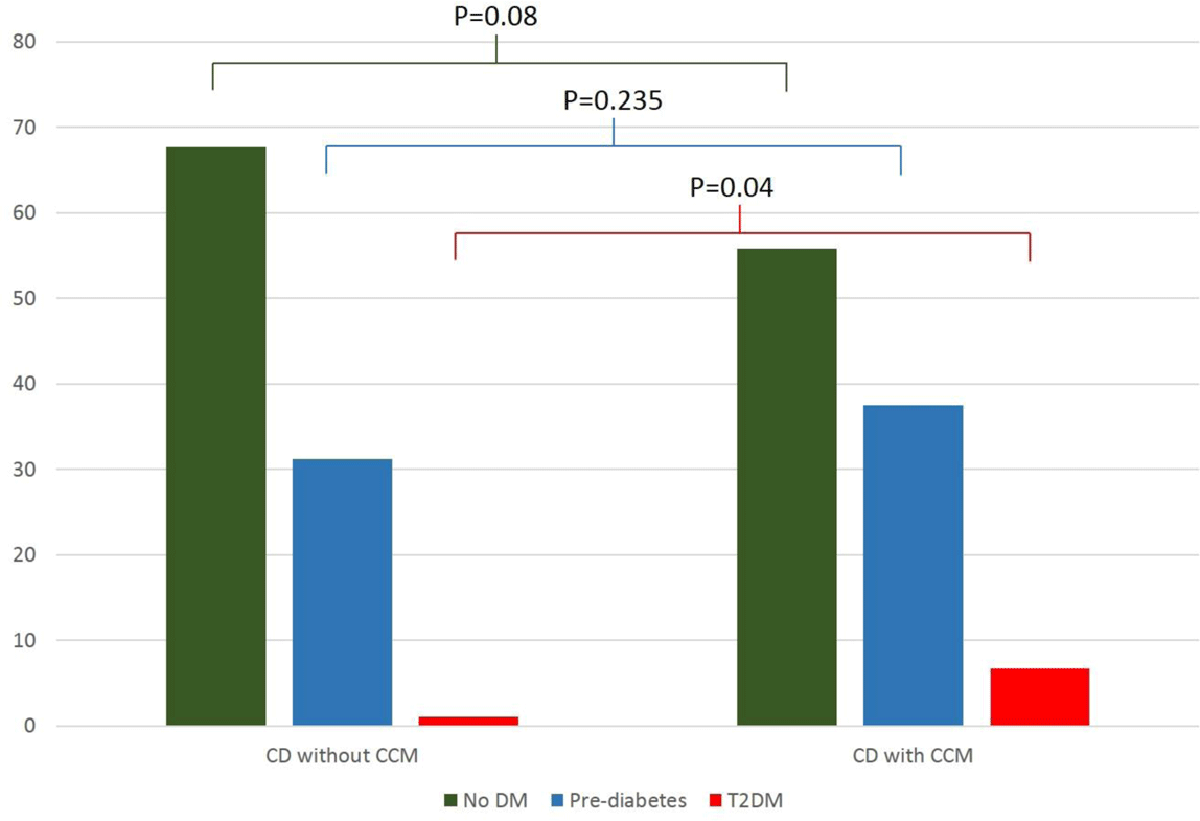
Figure 1
Percentages of Newly Diagnosed DM and Pre-diabetes in Individuals with Chagas Disease with and without Chronic Chagas Cardiomyopathy.
Abbreviations: T2DM = type-2 Diabetes Mellitus; CCM = Chagas cardiomyopathy.
Table 2
Statistical Models Evaluating the Association between Heart Failure and Insulin Resistance Considering the Potential Confounders.
| Insulin resistance | Model 1 | Model 2 | Model 3 | ||||||
|---|---|---|---|---|---|---|---|---|---|
| OR | 95% CI | p-value | OR | 95% CI | p-value | OR | 95% CI | p-value | |
| CCM (Yes/No) | 0.68 | 0.11–4.31 | 0.683 | 4.08 | 1.55–10.74 | 0.004 | 0.38 | 0.02–6.81 | 0.516 |
| Sex (Men vs Women) | 0.49 | 0.24–1.01 | 0.054 | 0.56 | 0.26–1.21 | 0.142 | 0.11 | 0.01–1.57 | 0.103 |
| Age, years (>60 vs ≤60) | 0.18 | 0.07–0.45 | 0.000 | 0.19 | 0.08–0.49 | 0.001 | 1 | omitted | |
| MAP, mmHg (>100 vs ≤100) | 2.93 | 1.21–7.11 | 0.017 | 2.83 | 1.12–7.11 | 0.027 | 4.34 | 0.04–465.2 | 0.538 |
| Alcohol consumption (Yes/No) | 0.55 | 0.24–1.22 | 0.142 | 0.54 | 0.23–1.26 | 0.155 | 0.19 | 0.01–4.44 | 0.306 |
| HWI (Yes/No) | 2.02 | 0.47–8.66 | 0.345 | — | — | — | — | — | — |
| Group*HWI interaction | 5.94 | 0.78–44.96 | 0.084 | — | — | — | — | — | — |
| Total Cholesterol, mg/dl (>200 vs ≤200) | 1.61 | 0.81–3.23 | 0.175 | 1.70 | 0.80–3.61 | 0.165 | 0.77 | 0.04–14.2 | 0.861 |
| CRP mg/dl (>3 vs ≤3) | 1.85 | 0.87–3.94 | 0.109 | 1.59 | 0.71–3.61 | 0.260 | 9.79 | 0.52–183.7 | 0.127 |
| Physical activity (Low) | |||||||||
| Moderate | 1.38 | 0.59–3.19 | 0.452 | 1.18 | 0.48–2.87 | 0.718 | 8.99 | 0.48–167.4 | 0.141 |
| High | 1.06 | 0.41–2.72 | 0.909 | 0.98 | 0.35–2.73 | 0.976 | 0.30 | 0.01–19.53 | 0.576 |
[i] Abbreviations: CCM: Chronic Chagas Cardiomyopathy; MAP: Mean arterial pressure; HWI: Hip Waist Index; CRP: Reactive protein C.
Model 1 = Analysis with HWI interaction.
Model 2 = Including only patients with HWI alteration.
Model 3 = Including only patients without HWI alteration.
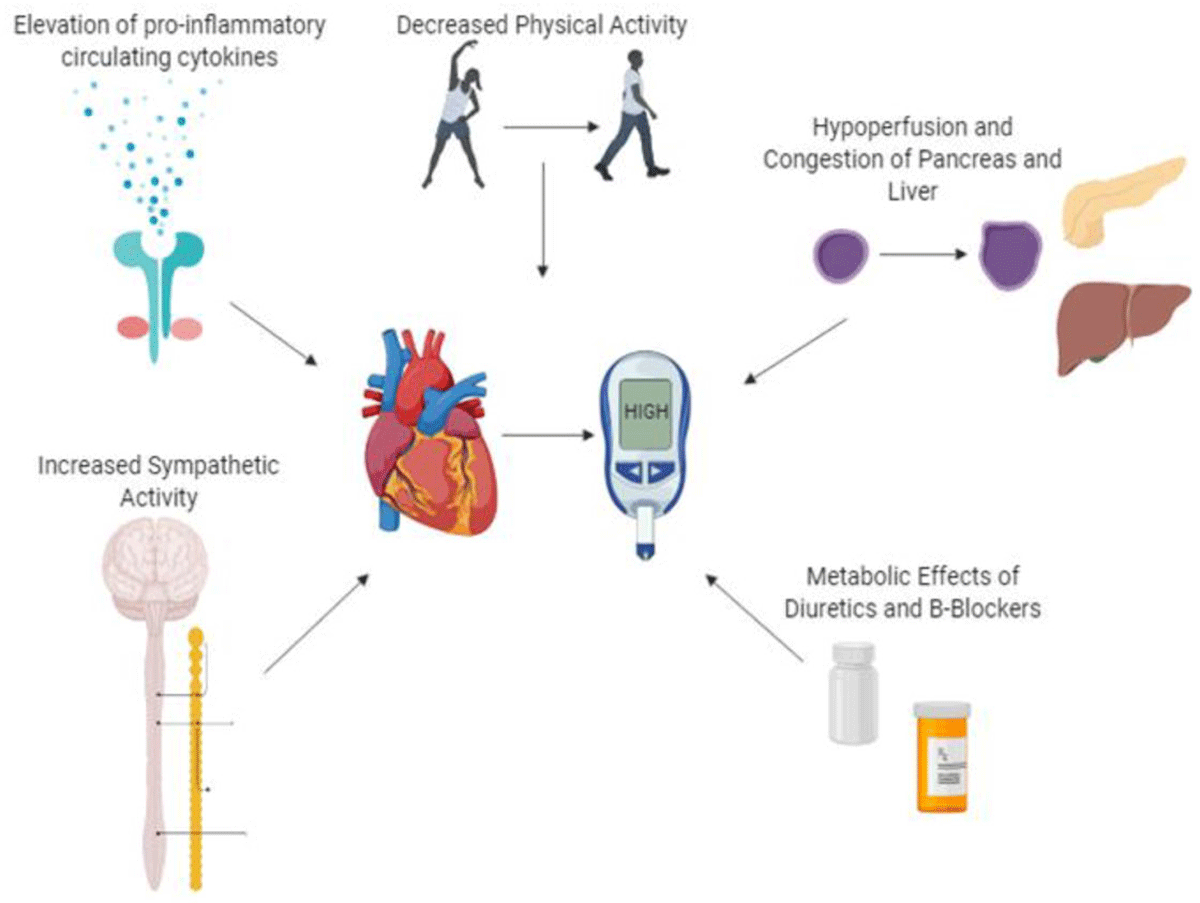
Figure 2
Pathophysiological Pathways for Insulin Resistance in Heart Failure.