
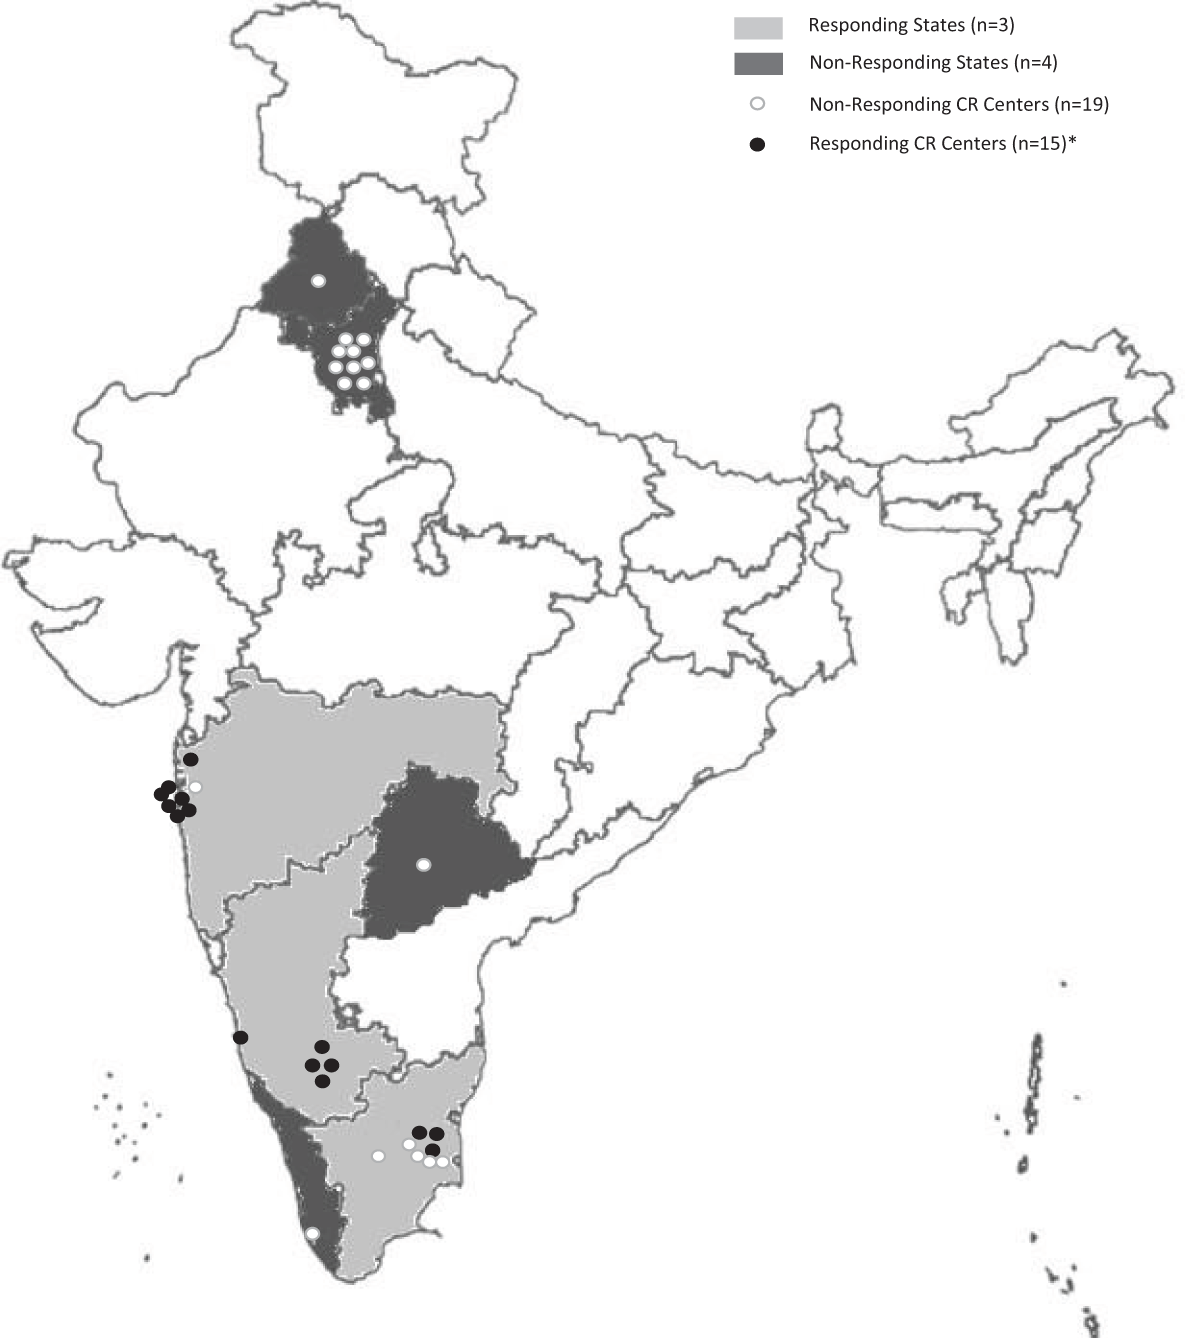
Figure 1
Distribution of cardiac rehabilitation centers in India. States not in grayscale did not have CR centers. * A total of 18 responses were received. However, three centers did not reveal their location.
Table 1
Description of cardiac rehabilitation programs.
| Nature of Program | n (%) or mean ± SD |
|---|---|
| CR setting | |
| Urban | 10 (66.6%) |
| Suburban | 5 (33.3%) |
| Rural | 0 (0.0%) |
| Location of the CR program | |
| Tertiary care hospital | 13 (92.8%) |
| Community hospital | 0 (0.0%) |
| Rehabilitation hospital | 1 (7.1%) |
| Not in hospital | 3 (21.4%) |
| Program cost payment source* | |
| Patient | 14/15; 93.3% |
| Insurance | 4/15; 26.6% |
| Hospital | 1/15; 6.6% |
| Government | 1/15; 6.6% |
| Average direct cost to the patient where they pay (in Indian Rupees; n = 12) | ₹5893.3 ± 3689.6 Median (IQR): ₹6000 (1500, 96000) |
| Referral frequency from Cardiology | |
| Regularly | 5/14; 35.7% |
| Sometimes | 9/14; 64.2% |
| Rarely | 0 |
| Cardiac indications for referral accepted by programs | |
| 1. Post-MI/ACS | 13/13 (100%) |
| 2. Stable CAD, without a recent event or procedure | 9/13 (69.2%) |
| 3. Post PCI | 10/13 (76.9%) |
| 4. Post CABG | 13/13 (100%) |
| 5. Heart failure | 11/13 (84.6%) |
| 6. Patients who have had valve surgery/repair or TAVI | 7/13 (53.8%) |
| 7. Heart transplant | 5/13 (38.5%) |
| 8. Patients with ventricular assist devices | 4/13 (30.8%) |
| 9. Arrhythmias (hemodynamically-stable) | 9/13 (69.2%) |
| 10. Patients with implanted devices for rhythm control (i.e., ICD/CRT, pacemaker) | 8/13 (61.5%) |
| 11. Congenital heart disease | 5/13 (38.5%) |
| 12. Cardiomyopathy | 7/13 (53.8%) |
| 13. Rheumatic heart disease | 6/13 (46.1%) |
| 14. Pulmonary hypertension | 1/13 (7.7%) |
| Non-cardiac indications for referral accepted by programs | 11/13 (84.6%) |
| 14, Patients at high-risk of cardiovascular disease (primary prevention) | 2/13 (15.4%) 8/13 (61.5%) |
| Health care professionals on the CR team Cardiologist (n = 15) | |
| Dedicated to CR | 3 (20%) |
| Part-time | 10 (66.6%) |
| None | 2 (13.3%) |
| Physiatrist (n = 15) | |
| Dedicated to CR | 2 (13.3%) |
| Part-time | 1 (6.6%) |
| None | 12 (80%) |
| Sports Medicine Physician (n = 15) | |
| Dedicated to CR | 0 |
| Part-time | 3 (20%) |
| None | 12 (80%) |
| Other Physician (n = 15) | |
| Dedicated to CR | 2 (13.3%) |
| Part-time | 6 (40%) |
| None | 7 (46.6%) |
| Physiotherapist (n = 15) | |
| Dedicated to CR | 10 (66.6%) |
| Part-time | 4 (26.6%) |
| None | 1 (6.6%) |
| Nurse (n = 15) | |
| Dedicated to CR | 3 (20%) |
| Part-time | 5 (33.3%) |
| None | 7 (46.6%) |
| Nurse practitioner (n = 15) | |
| Dedicated to CR | 1 (6.6%) |
| Part-time | 1 (6.6%) |
| None | 13 (86.6%) |
| Psychiatrist (n = 14) | |
| Dedicated to CR | 0 |
| Part-time | 5 (35.7%) |
| None | 9 (64.2%) |
| Psychologist (n = 15) | |
| Dedicated to CR | 1 (6.6%) |
| Part-time | 9 (60%) |
| None | 5 (33.3%) |
| Social worker (n = 15) | |
| Dedicated to CR | 1 (6.6%) |
| Part-time | 1 (6.6%) |
| None | 13 (86.6%) |
| Dietitian (n = 15) | |
| Dedicated to CR | 5 (33.3%) |
| Part-time | 10 (66.6%) |
| None | 0 |
| Kinesiologist (n = 15) | |
| Dedicated to CR | 1 (6.6%) |
| Part-time | 2 (13.3%) |
| None | 12 (80%) |
| Pharmacist (n = 15) | |
| Dedicated to CR | 1 (6.6%) |
| Part-time | 0 |
| None | 14 (93.3%) |
| Exercise specialist (n = 15) | |
| Dedicated to CR | 5 (33.3%) |
| Part-time | 1 (6.6%) |
| None | 9 (60%) |
| Community health worker (n = 14) | |
| Dedicated to CR | 1 (7.1%) |
| Part-time | 1 (7.1%) |
| None | 12 (85.7%) |
[i] * Respondents directed to select all that apply.
Abbreviations: ACS – Acute coronary syndrome, CABG – Coronary artery bypass graft surgery, CR – Cardiac rehabilitation, CRT – Cardiac resynchronization therapy, ICD – Implantable cardioverter defibrillator, MI – Myocardial infarction, TAVI – Transcatheter aortic valve implantation, SD – standard deviation.
Table 2
Services delivered in cardiac rehabilitation centers across India (N = 15).
| Element | n (%) |
|---|---|
| Initial assessment | 15 (100.0%) |
| Individual consultation with a physician | 14 (93.3%) |
| Individual consultation with a nurse | 2 (13.3%) |
| Exercise stress test | 12 (80.0%) |
| Other functional capacity test | Yes: 15 (100%) |
| Assessment of strength (e.g. handgrip) | Yes: 10 (66.6%) |
| Assessment of comorbidities/issues that could impact exercise (e.g. cognition, vision, musculoskeletal/mobility issues, frailty, and/or balance/fall risk) | Yes: 15 (100%) |
| Exercise prescription | Yes: 15 (100%) |
| Physical activity counseling | Yes: 15 (100%) |
| Supervised exercise training | Yes: 15 (100%) |
| Heart rate measurement training for patients | Yes: 15 (100%) |
| Resistance training | Yes: 15 (100%) |
| Management of cardiovascular risk factors | Yes: 15 (100%) |
| Prescription and/or titration of secondary prevention medications | Yes: 14 (93.3%) |
| Nutrition counseling | Yes: 15 (100%) |
| Depression screening | Yes: 12 (80%) |
| Psychological counseling | Yes: 13 (86.6%) |
| Smoking cessation sessions/classes | Yes: 11 (73.3%) |
| Vocational counseling/support for return-to-work | Yes: 10 (66.6%) |
| Stress management/relaxation techniques | Yes: 15 (100%) |
| Alternative forms of exercise, such as yoga, dance or tai-chi | Yes: 10 (66.6%) |
| Women-only classes | Yes: 2 (13.3%) |
| End of program re-assessment | Yes: 14 (93.3%) |
| Communication of patient assessment results with their primary care provider | Yes: 14 (93.3%) |
| Follow-up after outpatient program | Yes: 13 (86.6%) |