
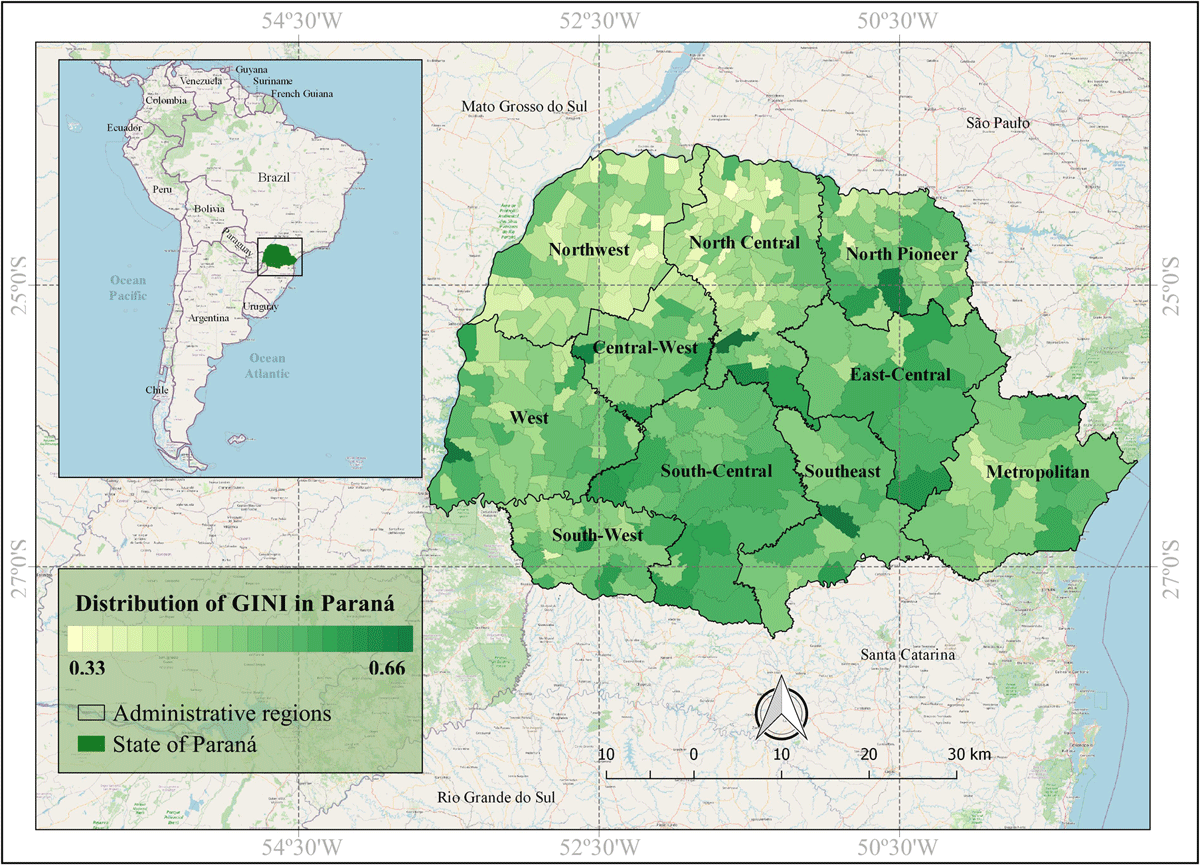
Figure 1
Geographic location of South America, Brazil (bigger insert) and Paraná State (green, in smaller insert) and location of Parana State’s 10 geographical mesoregions and indication of it’s municipalities according to GINI Index variation, Brazil (2019).
Table 1
Data sources used for the analysis of this study.
| Source | Variables | Period | Link |
|---|---|---|---|
| DATASUS – Mortality Information System (SIM) |
| 2013–2017 | https://datasus.saude.gov.br/ |
| CNES National Register of Health Facilities |
| 2013–2017 | http://cnes.datasus.gov.br/ |
| ITCG Paraná Land, Cartography and Geology Institute |
| 2015 | http://www.itcg.pr.gov.br/modules/faq/category.php?categoryid=8 |
| IBGE Brazilian Institute of Geography and Statistics |
| 2013–2017 | https://www.ibge.gov.br/ |
| PNUD United Nations Development Program |
| 2010 | http://www.atlasbrasil.org.br/2013/pt/download/ |
| Software R (microdatasus) DATASUS – Hospital information system – SIH |
| 2013–2017 | https://www.scielo.br/scielo.php?script=sci_arttext&pid=S0102-311X2019001104001 https://datasus.saude.gov.br/ |
| PMAQ Portal of the Secretariat of Primary Health Care |
| 2015 | https://aps.saude.gov.br/ape/pmaq |
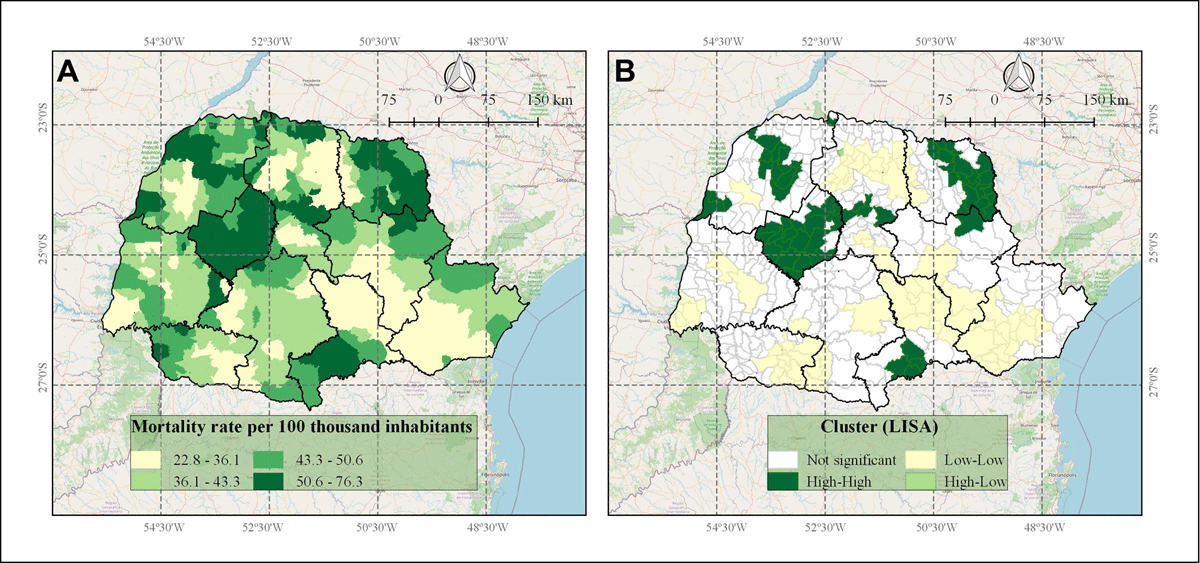
Figure 2
Spatial distribution of IHD mortality rates in the 399 municipalities of Parana State, Brazil, and its clusters. A) IHD mortality rates by adjusted population/100 thousand inhabitants in Parana State, 2013 to 2017; B) Local Indicators of Spatial Association (LISA) analysis indicating clusters according to high and low IHD mortality rates distribution patterns.
Table 2
Results of global OLS and local GWR multivariate analysis considering the Parana State municipalities’ IHD mortality rates as dependent variables.
| Variables | Global OLS coefficient | Local coefficientof GWR | ||||||||
|---|---|---|---|---|---|---|---|---|---|---|
| Est | Std Error | T value | VIF | Pr(>|t|) | Min | IstQu | Median | 3rd | Max | |
| Access index of Cardiologists | –3.70 | 1.31 | –2.83 | 4.17 | < 0.01** | –2.59 | –9.83 | –4.73 | –6.45 | 1.34 |
| Access of chemical reperfusion centers | 3.51 | 9.20 | 3.82 | 1.18 | < 0.01** | –7.13 | 2.08 | 3.32 | 5.54 | 1.21 |
| Access of mechanical reperfusion centers | –2.46 | 2.58 | –0.09 | 3.63 | 0.92 | –6.00 | –5.86 | 7.20 | 1.33 | 3.37 |
| Aging rate | 1.02 | 0.28 | 3.64 | 1.42 | < 0.01** | –4.31 | 7.07 | 1.03 | 1.34 | 2.22 |
| Income ratio | –1.88 | 0.07 | –2.64 | 1.17 | < 0.01** | –1.05 | –3.05 | –1.89 | –4.36 | –6.16 |
| Illiteracy | 0.41 | 0.14 | 2.91 | 1.48 | < 0.01** | –8.20 | 2.37 | 4.56 | 7.30 | 2.02 |
| Proportion of Family health program coverage | –5.12 | 0.03 | –0.19 | 1.29 | 0.85 | –9.63 | –3.75 | 1.03 | 4.49 | 1.19 |
| Catheterization rate | –2.14 | 0.53 | 4.01 | 1.16 | < 0.01** | –6.78 | –2.44 | –1.72 | –9.86 | 2.08 |
| Scintigraphy rate | 0.28 | 0.22 | 1.28 | 3.56 | 0.20 | –1.45 | –4.55 | 9.90 | 6.45 | 1.47 |
| Angioplasty rate | –2.61 | 1.25 | –2.10 | 1.77 | 0.04* | –1.69 | –6.87 | –4.63 | –2.24 | 1.66 |
| Chemical reperfusion rate | –1.51 | 5.85 | –0.26 | 1.13 | 0.80 | –3.89 | –7.89 | 1.01 | 9.41 | 5.18 |
| Echocardiography rate | –1.72 | 1.34 | –1.28 | 3.62 | 0.20 | –8.63 | –3.82 | –1.17 | 2.96 | 9.72 |
| Revascularization rate | 2.71 | 1.19 | 2.28 | 1.79 | 0.02* | –8.72 | –1.57 | 2.72 | 5.92 | 1.81 |
| Exercisetest rate | 0.004 | 0.10 | 0.05 | 2.15 | 0.96 | –6.70 | –1.29 | 3.37 | 2.42 | 6.37 |
| Intercepto | 37.86 | 3.73 | 10.15 | – | < 0.01** | 2.07 | 3.32 | 3.62 | 4.11 | 5.09 |
| Moran’s I Residuals | 0.05 | – | – | – | – | 0.00 | – | – | – | – |
| Moran’s p Residuals | 0.00 | – | – | – | – | 0.08 | – | – | – | – |
| R2 adjusted | 0.28 | – | – | – | – | 0.72 | – | – | – | – |
| AIC | 2896.85 | – | – | – | – | 2639.51 | – | – | – | – |
[i] P valuesignificance: *<0.05; **< 0.01.
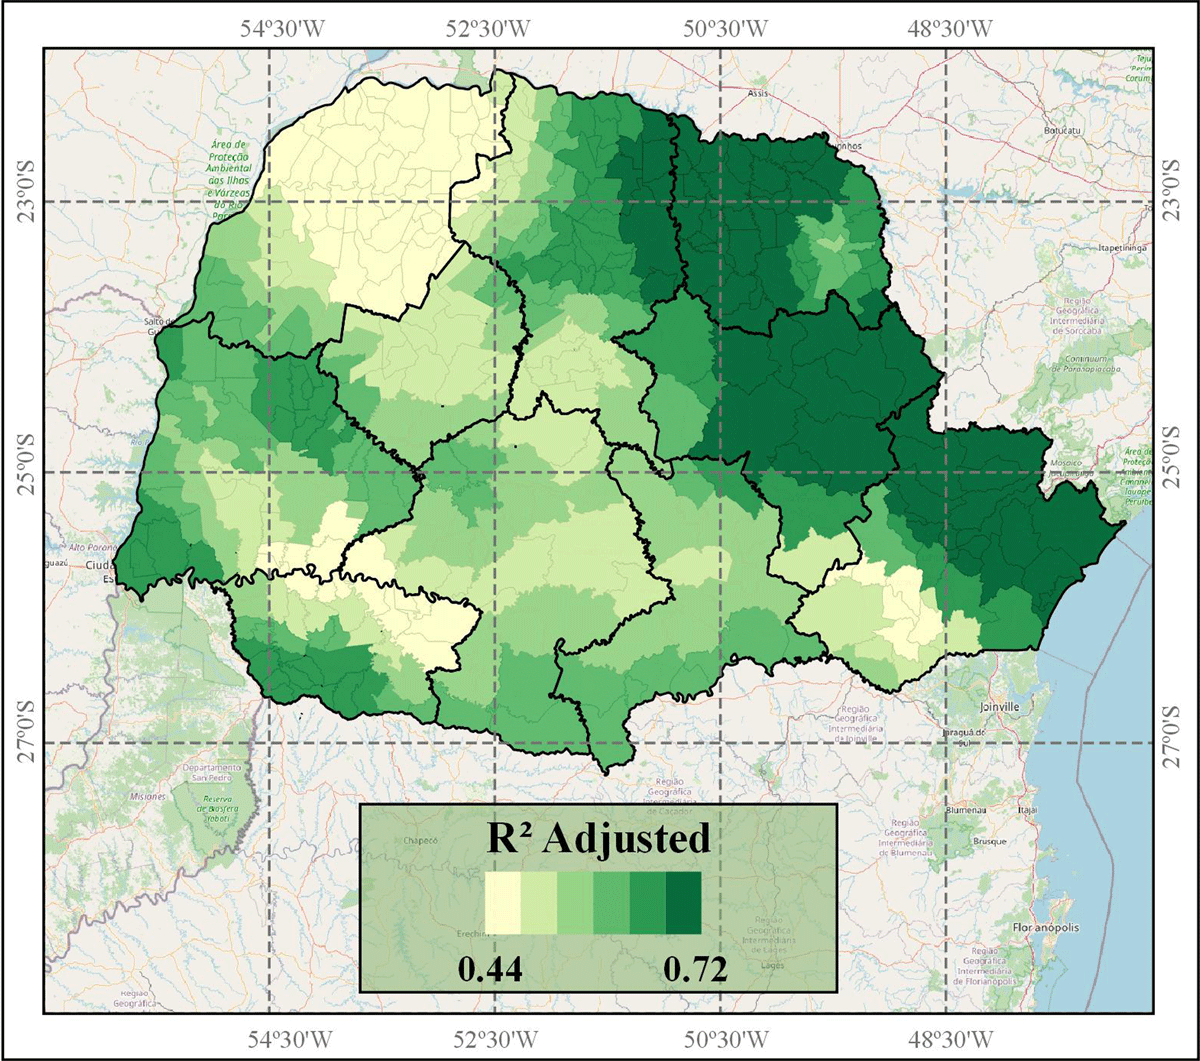
Figure 3
Spatial distribution of local GWR adjusted R2 values according to each Parana State municipality, located in mesoregions.
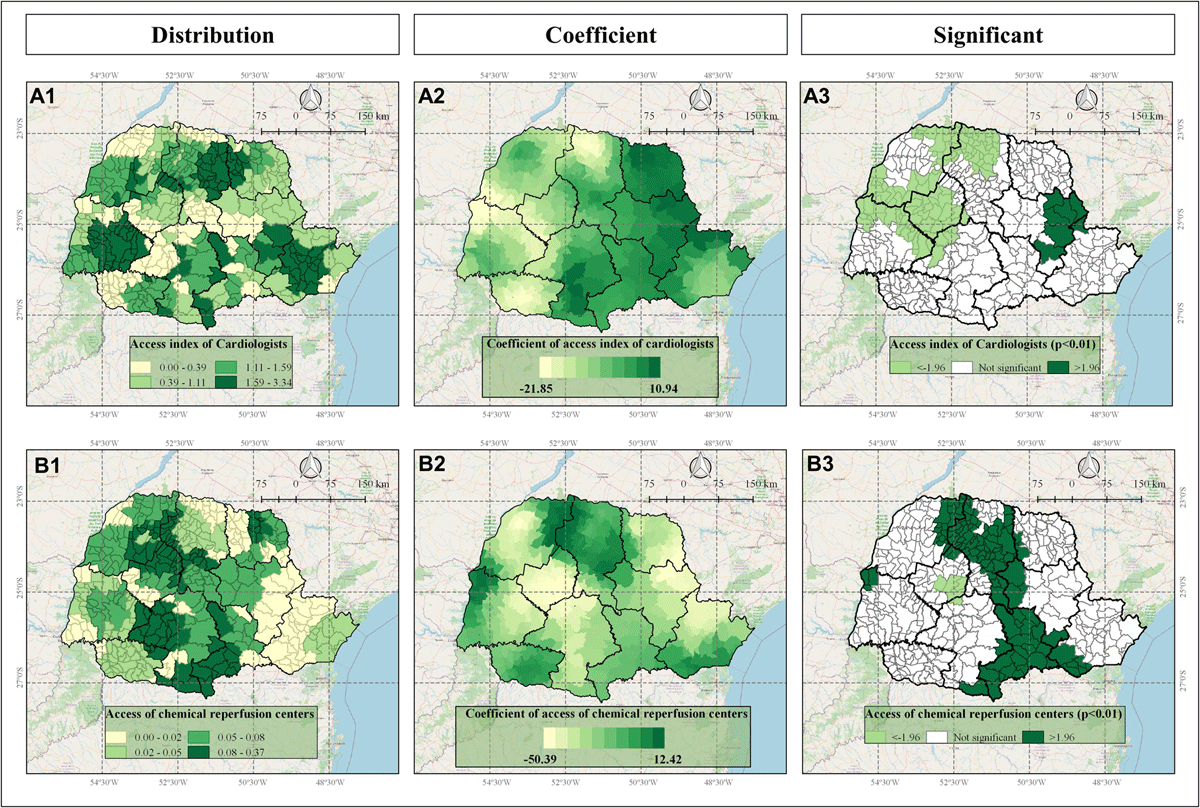
Figure 4
Indicators of accessibility to cardiologists (Panels A) and to chemical reperfusion centers (Panels B) in Parana state, Brazil, according to Frequency Distribution (1), values of GWR coefficients (2) and significance (3) where <– 1.96 (light green) indicates significant negative correlation and >1.96 indicates significant positive correlation (dark green).
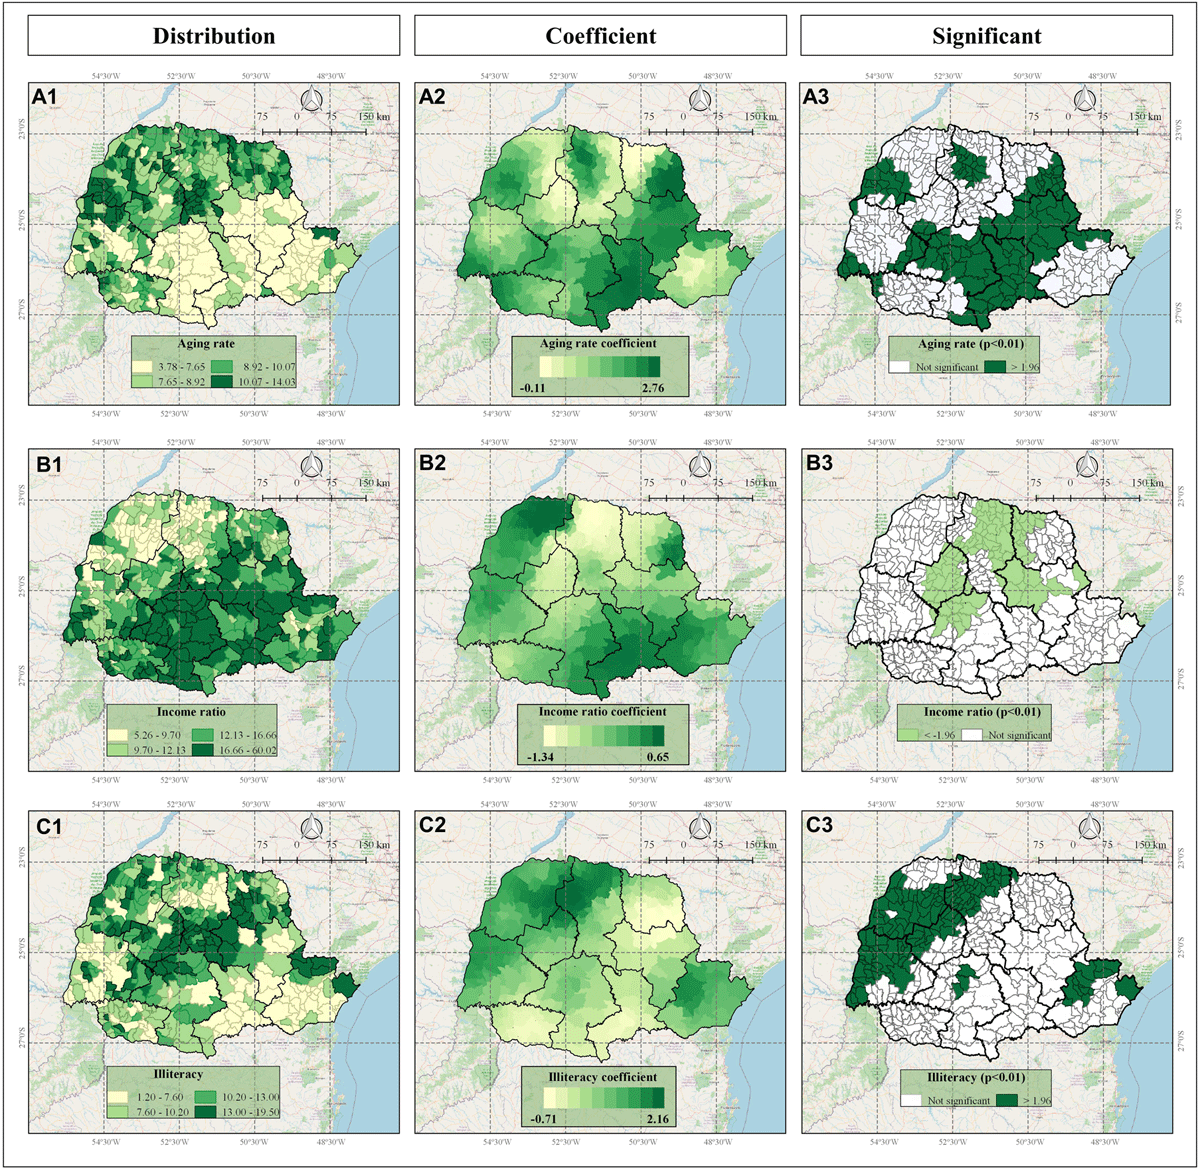
Figure 5
Socioeconomic indicators: aging rate (Panels A); income ratio (Panels B) and illiteracy (Panels C) in Parana state, Brazil, according to Frequency Distribution (1), values of GWR coefficients (2), and significance (3) where <–1.96 (light green) indicates significant negative correlation and >1.96 indicates significant positive correlation (dark green).
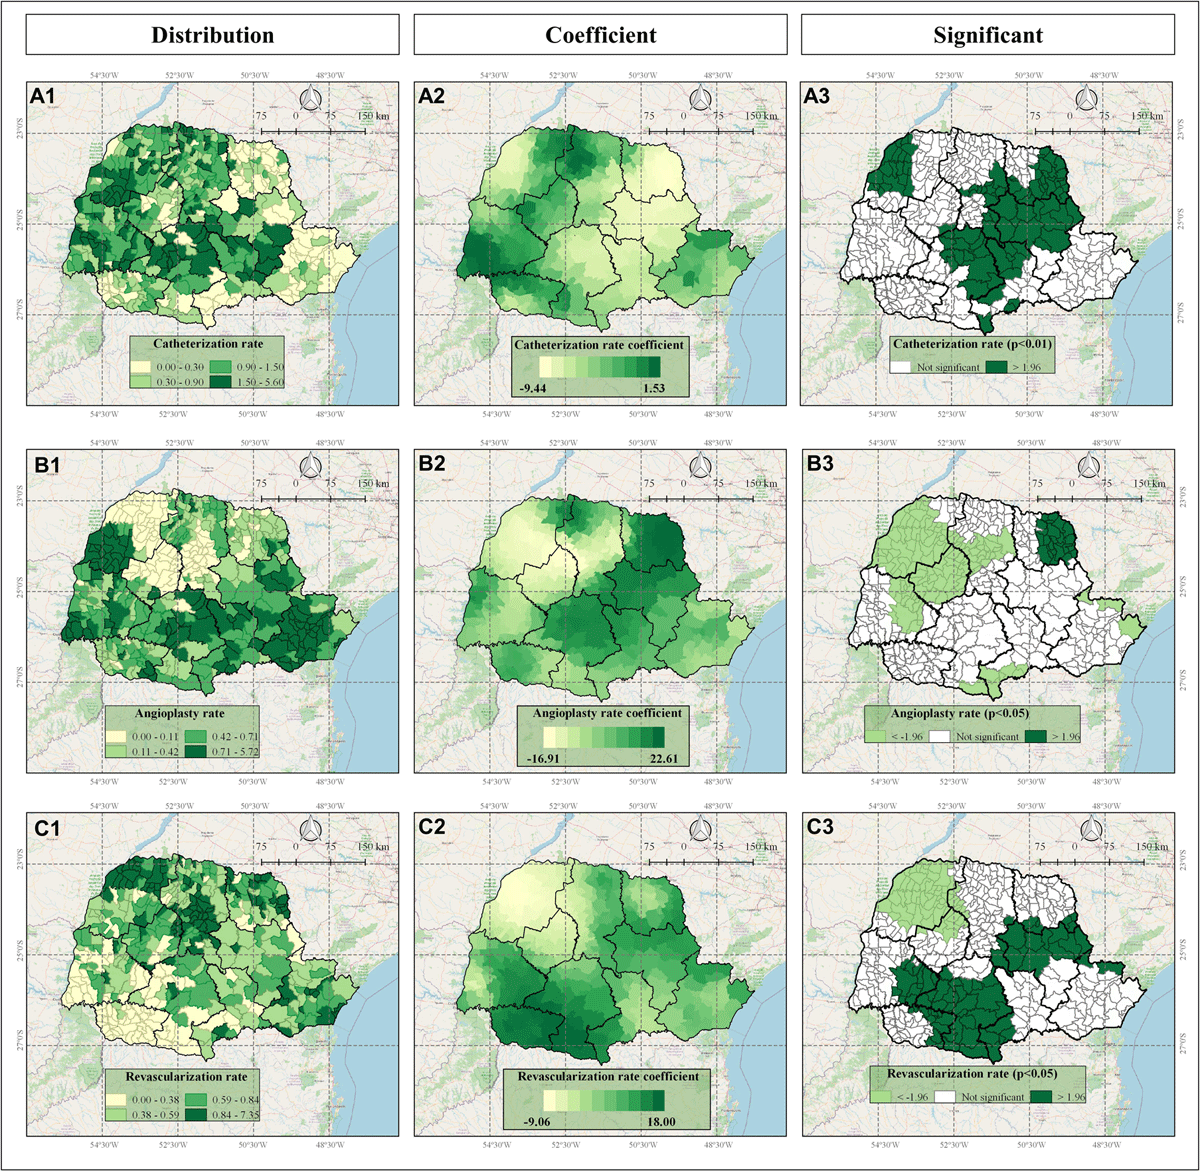
Figure 6
Exam coverage variables: catheterization rate (Panels A); angioplasty rate (Panels B) and Revascularization rate (Panels C) in Parana state, Brazil, according to Frequency Distribution (1), values of GWR coefficients (2), and significance (3) where <–1.96 (light green) indicates significant negative correlation and >1.96 indicates significant positive correlation (dark green).