
Table 1
Baseline characteristics at time of presentation to care.
| Cardiac Cases (n = 97) | Controls (n = 242) | p-value | |
|---|---|---|---|
| Age, median (range) | 26 (16–50) | 28 (18–41) | 0.0069 |
| Gravidity, median (range) | 2 (1–8) | 2 (1–6) | 0.1505 |
| Parity, median (range) | 1 (0–8) | 1 (0–5) | 0.1094 |
| Nulliparous, n (%) | 35 (36.1) | 107 (44.2) | |
| Parity 1–2, n (%) | 33 (34.0) | 86 (35.5) | |
| Parity ≥ 3, n (%) | 29 (29.9) | 49 (20.3) | |
| Received antenatal care, n (%) 1 | 73 (97.3) | 214 (97.3) | 1.000 |
| History of non-obstetric, comorbid medical condition during pregnancy, n (%) 2 | 11 (4.6) | 9 (9.3) | 0.124 |
| Obstetric high-risk, n (%) 3 | 39 (40.2) | 75 (31.0) | 0.127 |
[i] 1 Had one or more antenatal visit. Antenatal care unknown for 22 cardiac cases (n = 75), 22 control cases (n = 220).
2 Includes: hypertension, diabetes mellitus, HIV, pulmonary disease, renal disease, thyroid disease.
3 Includes: previous preterm birth, previous C-section, previous IUFD, multiple gestations (current pregnancy), or seen in high-risk antenatal clinic.
Table 2
Clinical Profile of Cardiac Disease Cases in Pregnancy at MTRH.
| Type of Cardiac Disease, n (%) | Cases (n = 97) |
|---|---|
| Acquired | 90 (92.8) |
| RHD | 73 (75.3) |
| Cardiomyopathy1 | 4 (4.1) |
| Primary pulmonary hypertension | 15 (15.5) |
| Congenital | 7 (7.2) |
| Electrical/Arrhythmia | 15 (15.5) |
| Valvular Lesions 2 | |
| Mitral Regurgitation | 45 (63.4) |
| Mitral Stenosis | 40 (56.3) |
| Severe | 22 (31.0) |
| Moderate | 8 (11.3) |
| Mild | 6 (8.5) |
| Aortic regurgitation | 24 (33.8) |
| Aortic stenosis | 4 (5.6) |
| Severity of Disease and Symptoms at First Admission | |
| NYHA Class at presentation3 | |
| I or II | 22 (38.6) |
| III or IV | 35 (61.4) |
| Systolic BP, median (range) | 114 (80–180) |
| Diastolic BP, median (range) | 70 (40–122) |
| HR, median (range), n = 96 | 92 (56–205) |
| Oxygen saturation, median (range) | 92 (56–99) |
| LVEF < 45%, n (%)4 | 9 (9.8) |
| Right Ventricular Systolic Pressure, mmHg, median (IQR) | 64 (39–120) |
| RVSP ≥ 35 mmHg, n (%) | 57 (61.3) |
| RVSP < 35 mmHg, n (%) | 36 (38.7) |
| Timing of Cardiac Diagnosis, n (%) 5 | |
| Before Pregnancy | 50 (53.8) |
| During Pregnancy | 22 (23.7) |
| 1st Trimester (GA < 14 weeks) | 1 (1.1) |
| 2nd Trimester (GA 14–27.6 weeks) | 5 (5.4) |
| 3rd Trimester (GA > 28 weeks) | 16 (17.2) |
| Intra-partum (labor – <24-hrs post-delivery) | 5 (5.4) |
| Postpartum (≥24-hrs – 6 weeks post-delivery) | 16 (17.2) |
| Seen by any cardiologist prior to this pregnancy, n (%) 6 | 48 (52.2) |
| Cardiac Event before Pregnancy, n (%) | 10 (10.3) |
| Heart Failure | 9 (9.3) |
| Arrhythmia | 2 (2.1) |
| Stroke/TIA or MI | 0 (0) |
| History of cardiac surgery, n (%) | 10 (10.4) |
| Valve repair | 2 (2.1) |
| Valve replacement | 7 (7.3) |
[i] 1 Includes: peripartum or dilated cardiomyopathy.
2 TTE data missing for 2 RHD cases (n = 71).
3 Unknown for 40 cases (n = 57).
4 Unknown for 5 cases (n = 92).
5 Unknown for 4 cases (n = 93).
6 Unknown for 5 cases (n = 92).
Table 3
Adverse cardiac, obstetric and neonatal events during pregnancy.
| Variable | Cardiac Cases | Controls | P-value |
|---|---|---|---|
| Maternal mortality, n (%) | 9 (9.3) | 0 (0) | <0.001 |
| Any Adverse Event 1 | 71 (79.8) | 54 (25.1) | <0.001 |
| Any Cardiac Event, n (%) | 54 (55.6) | 1 (0.4) | <0.001 |
| Cardiac arrest | 3 (3.1) | 0 (0) | 0.023 |
| Arrhythmia | 7 (7.2) | 0 (0) | <0.001 |
| Congestive Heart Failure | 41 (42.3) | 0 (0) | <0.001 |
| Stroke | 2 (2.1) | 0 (0) | 0.081 |
| CCU admission | 21 (21.7) | 1 (0.4) | <0.001 |
| Any Obstetric Event, n (%) 2 | 63 (72.4) | 73 (30.8) | <0.001 |
| Cesarean-section | 14 (15.4) | 42 (17.6) | 0.743 |
| Vacuum-assisted delivery | 18 (19.8) | 0 (0) | <0.001 |
| Induction of labor | 30 (37.0) | 24 (10.3) | <0.001 |
| Postpartum hemorrhage | 5 (5.2) | 5 (2.1) | 0.157 |
| Pre-eclampsia/eclampsia | 14 (14.4) | 13 (5.4) | 0.008 |
| Venous thromboembolism | 10 (10.3) | 1 (0.4) | 0.000 |
| Any Neonatal Event, n (%) | 49 (61.3) | 58 (27) | <0.001 |
| Intrauterine fetal demise | 10 (11.2) | 7 (3.0) | 0.009 |
| Neonatal death | 4 (5.1) | 2 (0.9) | 0.039 |
| Preterm delivery | 32 (41.6) | 23 (10.8) | <0.001 |
| Low birth weight | 24 (30.4) | 18 (7.8) | <0.001 |
| Newborn Unit admission | 16 (23.8) | 23 (10.2) | 0.007 |
| APGARS < 7 (at 1, 5, or 10 min) | 6 (9.7) | 11 (5.0) | 0.223 |
| Timing of first hospitalization | |||
| Antenatal, n (%)3 | 60 (67.4) | 5 (2.1) | <0.001 |
| GA in weeks, median (range) | 33.2 (6.3–39.5) | 35.1 (14.1–37.4) | |
| Intrapartum, n (%) | 28 (29.8) | 230 (95.0) | <0.001 |
| Postpartum, n (%) | 9 (9.3) | 7 (2.9) | 0.020 |
| Days postpartum, median (range) | 12 (2–27) | 1 (0–21) |
[i] 1 Any maternal death, cardiac or neonatal adverse event.
2 Unknown for 10 cases and 10 controls (n = 87 cases, n = 237 controls).
3 Unknown for 8 cardiac cases (n = 89).
Table 4
Description of all maternal deaths.
| Time of Death | Gravida Parity | Cardiac Disease | Time of Cardiac Diagnosis | NYHA Class | ECHO Characteristics | ECG | Method of Delivery | Pregnancy outcome |
|---|---|---|---|---|---|---|---|---|
| Antenatal – 27.4 weeks | G2P1 | RHD | Before Pregnancy | IV | LVEF > 55% Severe MS RVSP 71 mmHg | NSR | N/A | Miscarriage |
| Intrapartum | G1P0 | Pulmonary Hypertension | During pregnancy – 3rd trimester | Unknown | LVEF > 55% RVSP 41 mmHg | NSR | Induction of labor | Live birth |
| Intrapartum | G2P1 | RHD | During pregnancy – 3rd trimester | III | LVEF > 55% RVSP 92 mmHg | NSR | Induction of labor | IUFD |
| Postpartum – 2 hours | G5P4 | RHD | During pregnancy – 1st trimester | IV | LVEF 30–45% Severe MS RVSP 77 mmHg | A. fib. | N/A | Miscarriage |
| Postpartum – 13 hours | G2P0 | RHD | Before Pregnancy | III | LVEF 30–45% Severe MS RVSP 69 mmHg | A. fib. | Emergent C-section | IUFD |
| Postpartum – day 17 | G4P3 | RHD | Unknown | Unknown | LVEF 45–55% Severe MS RVSP 140 mmHg | NSR | Spontaneous vaginal delivery | Live birth |
| Postpartum – day 26 | G1P0 | PPCM | Postpartum | Unknown | LVEF <30% RVSP 53 mmHg pericardial effusion, LV apical thrombus | STEMI | Emergent C-section | IUFD |
| Postpartum – day 31 | G2P2 | Congenital | Before Pregnancy | IV | EF 30–45% RVSP 164 mmHg | NSR | Unknown | Unknown |
| Postpartum – day 58 | G1P0 | RHD | During pregnancy – 2nd trimester | Unknown | LVEF > 55% | NSR | Induction of labor | Neonatal death |
[i] Abbreviations: RHD = rheumatic heart disease; LVEF = left ventricular ejection fraction; RVSP = right ventricular systolic pressure; PPCM = peripartum cardiomyopathy; IUFD = intrauterine fetal demise; NSR = normal sinus rhythm; A fib = atrial fibrillation; STEMI = ST-elevation myocardial infarction; N/A = Not applicable.
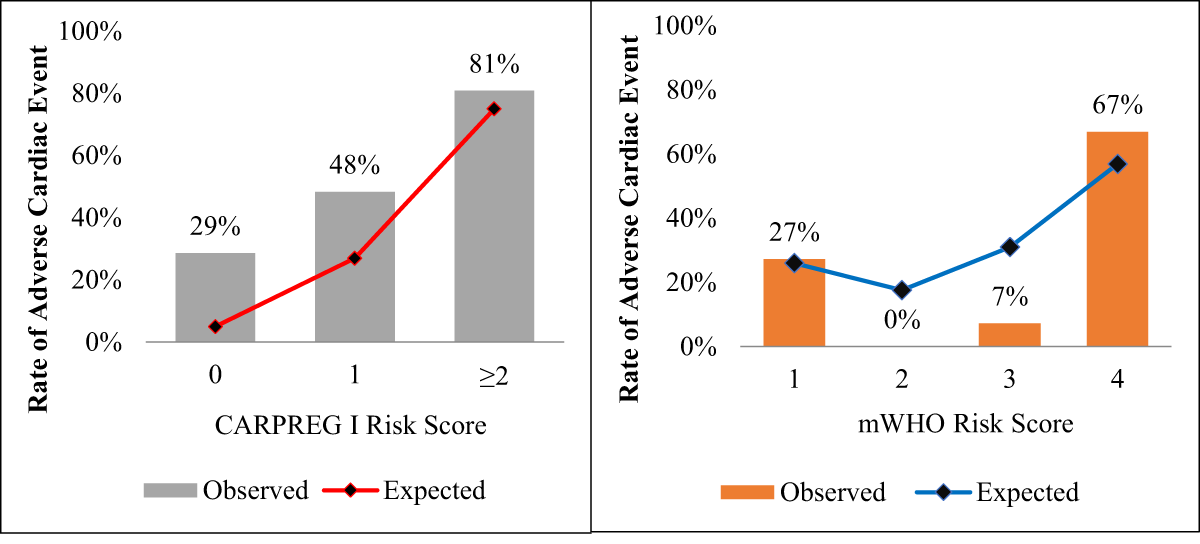
Figure 1
Observed vs. Expected Cardiac Event Rates based on CARPREG I and mWHO Scores. Observed rates of adverse cardiac events were higher than predicted by the CARPREG I score with expected rates of 5%, 27 and 75% for scores 0, 1 and ≥2), whereas rates of adverse cardiac events were more closely predicted by the mWHO score for caes in low mWHO class (I) and high mWHO (IV) classes (9.9% vs. 50.3%, respectively).
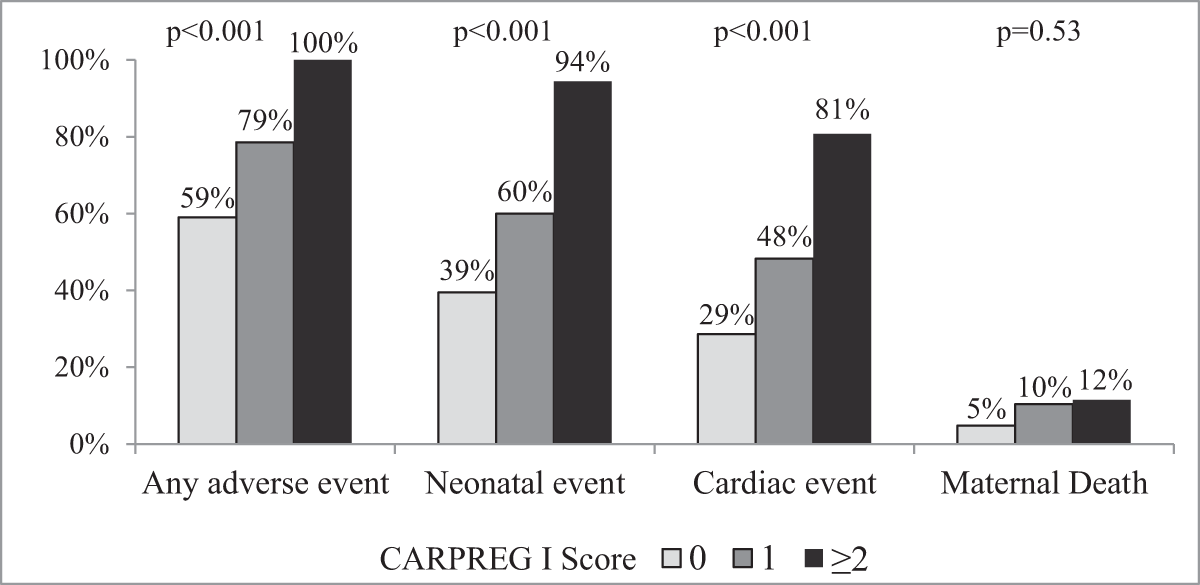
Figure 2
Observed Rates of Adverse Events based on CARPREG I Score. High rates of adverse cardiac and neonatal events were observed despite low and intermediate CARPREG I scores (0 or 1), while a high score (≥2) was associated with nearly universal rates of adverse events.
Table 5
Comparison of Adverse Events using CARPREG I and mWHO Risk Scores.
| N (%) | Cardiac Event, n (%) | Neonatal Event, n (%)^ | Maternal Death, n (%) | |
|---|---|---|---|---|
| CARPREG I score | 97 | 47 (48.5) | 47 (58.0) | 8 (8.3) |
| 0 | 42 (43.3) | 12 (28.6) | 15 (39.5) | 2 (4.8) |
| 1 | 29 (29.9) | 14 (48.3) | 15 (60.0) | 3 (10.3) |
| 2 | 22 (22.7) | 17 (77.3) | 14 (93.3) | 1 (4.6) |
| 3 | 4 (4.1) | 4 (100) | 3 (100) | 2 (50.0) |
| mWHO class | 95* | 47 (49.5) | 46 (58.2) | 8 (8.4) |
| I | 22 (23.2) | 6 (27.3) | 10 (47.6) | 2 (9.1) |
| II | 1 (1.1) | 0 (0) | 0 (0) | 0 (0) |
| III | 7 (7.4) | 1 (14.3) | 2 (33.3) | 0 (0) |
| IV | 65 (68.4) | 40 (61.5) | 34 (66.7) | 6 (9.2) |
[i] ^ Neonatal data only available for n = 81 cases.
* Unable to calculate mWHO scores for 2 cases due to missing data.