
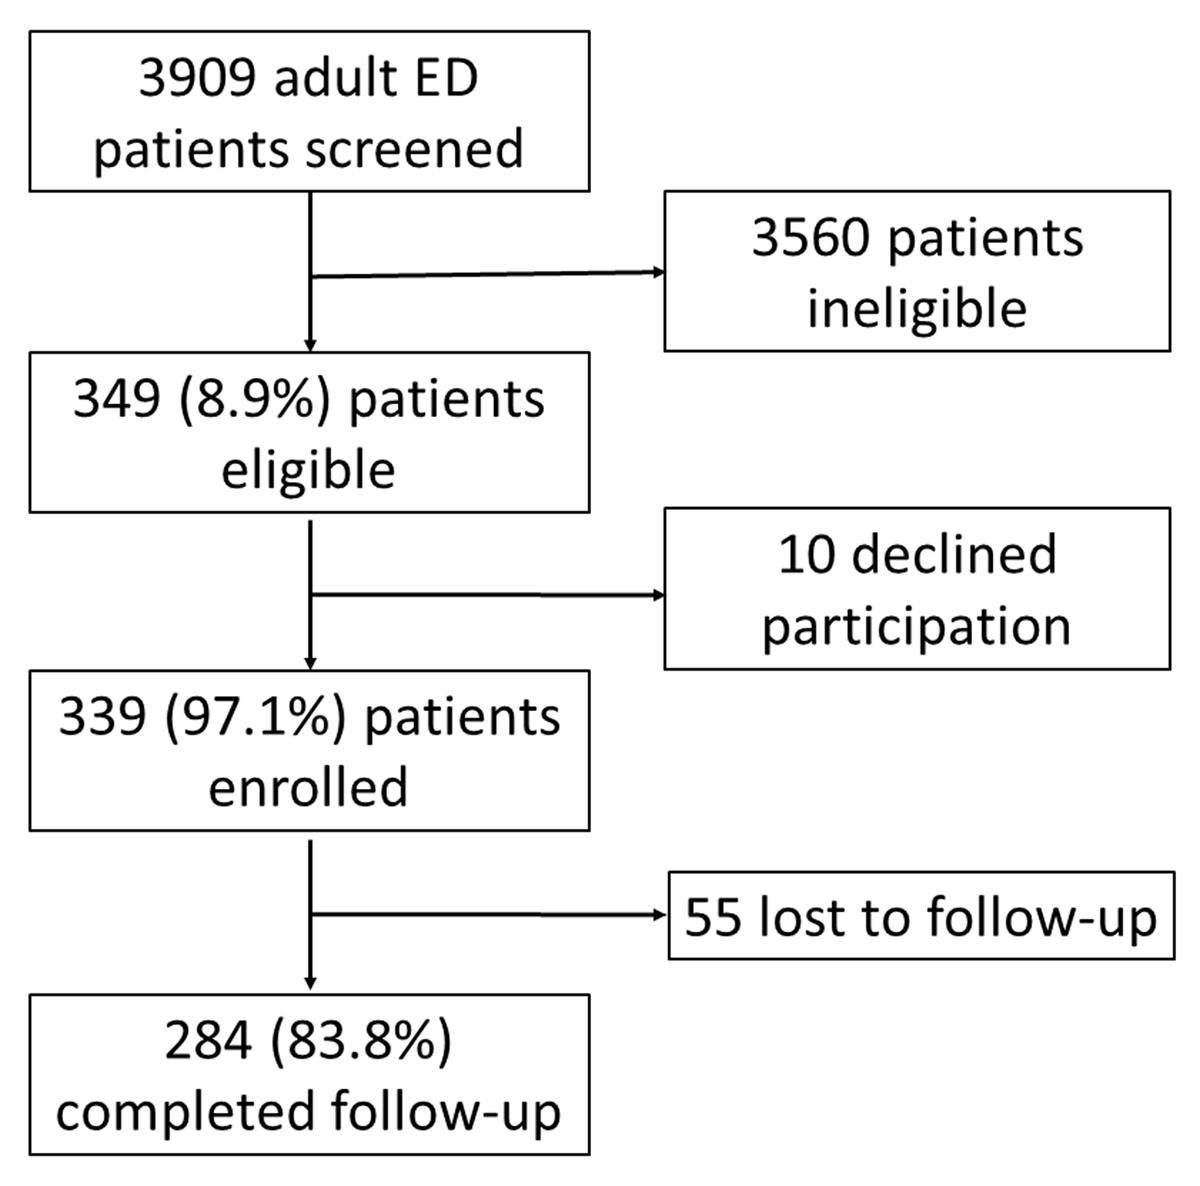
Figure 1
Flow diagram of study participants.
Table 1
Characteristics and cardiovascular risk factors among emergency department patients with chest pain or shortness of breath, northern Tanzania, 2018 (N = 339).
| Patient Characteristics | Median | (IQR) |
|---|---|---|
| Age, years | 60 | (46, 72) |
| Systolic blood pressure, mmHg | 138 | (121, 155) |
| Diastolic blood pressure, mmHg | 85 | (72, 96) |
| Number of patients | (%) | |
| Male | 144 | (42.5) |
| Hypertension | 252 | (74.3) |
| Diabetes | 44 | (13.0) |
| Hyperlipidemia | 39 | (11.5) |
| History of tobacco use | 109 | (32.2) |
| Body mass index | ||
| Underweight | 28 | (8.3) |
| Normal weight | 155 | (45.7) |
| Overweight | 85 | (25.1) |
| Obese | 71 | (20.9) |
| Self-reported history of CVD | 18 | (5.3) |
| Family history of CVD | 86 | (25.4) |
| Poor diet | 304 | (89.7) |
| Sedentary lifestyle | 124 | (36.6) |
| Education | ||
| Primary or none | 241 | (71.1) |
| Secondary or university | 98 | (28.9) |
| HIV infected | 6 | (1.8) |
| Taking aspirin daily | 34 | (10.0) |
| 5-year risk of cardiovascular event | ||
| <5% | 74 | (21.8) |
| 5–10% | 43 | (12.7) |
| 10–20% | 76 | (22.4) |
| 20–30% | 75 | (22.1) |
| >30% | 71 | (20.9) |
[i] CVD: Cardiovascular disease.
HIV: Human immunodeficiency virus.
Table 2
Features of present illness among emergency department patients with chest pain or shortness of breath, northern Tanzania, 2018 (N = 339).
| Number of patients | (%) | |
|---|---|---|
| Primary complaint* | ||
| Chest pain | 122 | (36.0) |
| Shortness of breath | 107 | (31.5) |
| Palpitations | 18 | (5.3) |
| Leg swelling | 11 | (3.2) |
| Abdominal pain | 10 | (2.9) |
| Other | 71 | (20.9) |
| Secondary complaints* | ||
| Chest pain | 139 | (41.0) |
| Shortness of breath | 137 | (40.4) |
| Abdominal pain | 66 | (19.5) |
| Palpitations | 60 | (17.7) |
| Cough | 60 | (17.7) |
| Back pain | 56 | (16.5) |
| Leg swelling | 51 | (15.0) |
| Headache | 38 | (11.2) |
| Arm/jaw pain | 35 | (10.3) |
| Generalized weakness | 28 | (8.3) |
| Other | 110 | (32.4) |
| Symptom duration prior to presentation, median (IQR), days | 7 | (3, 28) |
| CCS grading for anginal severity | ||
| Non-exertional symptoms | 25 | (7.4) |
| Class I | 38 | (11.2) |
| Class II | 95 | (28.0) |
| Class III | 74 | (21.8) |
| Class IV | 107 | (31.6) |
[i] * Only one primary complaint was allowed per patient, but patients could name multiple secondary complaints.
CCS: Canadian Cardiovascular Society [20].
Table 3
Patterns of diagnosis and management of emergency department patients with chest pain or shortness of breath, northern Tanzania, 2018 (N = 339).
| Number of patients | (%) | |
|---|---|---|
| ECG performed | 170 | (50.1) |
| Cardiac biomarkers ordered | 9 | (2.7) |
| Other laboratory investigations ordered | 246 | (72.6) |
| Treatments administered in the ED | ||
| Aspirin | 3 | (0.9) |
| Clopidogrel | 2 | (0.6) |
| Furosemide | 33 | (9.7) |
| Anti-hypertensive | 26 | (7.6) |
| Supplemental oxygen | 24 | (7.1) |
| Analgesic | 8 | (2.4) |
| Other | 23 | (6.8) |
| No medication administered | 247 | (72.9) |
| Diagnosis | ||
| Symptomatic hypertension | 104 | (30.7) |
| Heart failure | 99 | (29.2) |
| PUD/gastritis | 27 | (8.0) |
| Non-specific chest pain | 14 | (4.1) |
| Pneumonia | 12 | (3.5) |
| Asthma/COPD | 11 | (3.2) |
| Malignancy | 11 | (3.2) |
| Acute coronary syndrome | 6 | (1.8) |
| Other | 55 | (16.2) |
| Admitted to hospital | 116 | (34.2) |
[i] PUD: peptic ulcer disease.
COPD: Chronic obstructive pulmonary disease.

Figure 2
Patterns of diagnosis and treatment for ACS among emergency department patients in northern Tanzania, 2018.
Table 4
Association between patient characteristics and decision to obtain an ECG for emergency department patients with chest pain or shortness of breath, northern Tanzania, 2018 (N = 339).
| ECG obtained, n (%) (N = 170) | ECG not obtained, n (%) (N = 169) | OR (95% CI)a | pb | |
|---|---|---|---|---|
| Male sex | 72 (42.4) | 72 (42.6) | 0.99 (0.64, 1.52) | 0.963 |
| Hypertension | 128 (75.3) | 124 (73.4) | 1.11 (0.68, 1.81) | 0.686 |
| Diabetes | 18 (10.6) | 26 (15.4) | 0.65 (0.34, 1.24) | 0.189 |
| Hyperlipidemia | 24 (14.1) | 15 (8.9) | 1.68 (0.85, 3.41) | 0.130 |
| History of tobacco use | 45 (26.5) | 64 (37.9) | 0.59 (0.37, 0.94) | 0.025* |
| Overweight or obese | 84 (49.4) | 72 (42.6) | 1.31 (0.86, 2.02) | 0.209 |
| Personal history of CVD | 9 (5.3) | 9 (5.3) | 0.99 (0.37, 2.64) | 0.990 |
| Family history of CVD | 46 (27.1) | 40 (23.7) | 1.20 (0.73, 1.96) | 0.473 |
| Poor diet | 156 (91.8) | 148 (87.6) | 1.57 (0.77, 3.29) | 0.205 |
| Sedentary lifestyle | 65 (38.2) | 59 (34.9) | 1.15 (0.74, 1.80) | 0.525 |
| Primary complaint chest pain | 70 (41.2) | 52 (30.8) | 1.57 (1.01, 2.47) | 0.046* |
| Anginal symptoms | 159 (93.5) | 155 (91.7) | 1.30 (0.57, 3.04) | 0.523 |
| Secondary or university education | 55 (32.4) | 43 (25.4) | 1.40 (0.87, 2.25) | 0.161 |
| >10% five-year risk of cardiovascular event | 109 (64.1) | 113 (66.9) | 0.89 (0.56, 1.39) | 0.595 |
| ECG obtained, mean (sd) (N = 170) | ECG not obtained, mean (sd) (N = 169) | pc | ||
| Age, years | 56.9 (18.8) | 57.7 (18.7) | 0.698 | |
| Systolic blood pressure, mmHg | 139.2 (29.5) | 140.1 (26.6) | 0.762 | |
| Duration of symptoms, days | 30.0 (73.4) | 20.6 (31.7) | 0.127 |
[i] a Odds ratios from univariate analyses calculated from 2 × 2 contingency tables.
b Univariate associations between categorical variables assessed via Pearson’s chi-squared.
c Univariate associations between continuous and categorical variables assessed via Welch’s t-test.
* p < 0.05.
Table 5
Outcomes of emergency department patients with chest pain or shortness of breath, northern Tanzania, 2018.
| Hospitalized patients (N = 116) | Median | (IQR) |
|---|---|---|
| Duration of hospitalization, days | 7 | (4,8) |
| Patients discharged from the ED (N = 223) | Number of patients | (%) |
| Prescriptions given | ||
| Antihypertensive | 84 | (37.7) |
| Furosemide | 37 | (16.6) |
| Antacid | 36 | (16.1) |
| Aspirin | 29 | (13.0) |
| Acetaminophen | 22 | (9.9) |
| Antimicrobial | 22 | (9.9) |
| Clopidogrel | 22 | (9.9) |
| NSAID | 21 | (9.4) |
| Other prescription | 57 | (25.6) |
| Patients completing telephone follow-up (N = 284) | Number of patients | (%) |
| Clinical status at 30 days | ||
| Symptoms resolved | 41 | (14.4) |
| Symptoms improved | 170 | (59.9) |
| Symptoms unchanged | 47 | (16.5) |
| Symptoms worsened | 6 | (2.1) |
| Dead | 20 | (7.0) |
[i] NSAID: Non-steroidal anti-inflammatory drug.
ED: Emergency department.
Table A.1
Results of multivariate logistic regression to identify predictors of decision to obtain an ECG for emergency department patients with chest pain or shortness of breath, northern Tanzania, 2018 (N = 339).
| Patient characteristic | ECG obtained, n (%) (N = 170) | ECG not obtained, n (%) (N = 169) | Adjusted OR (95% CI) | p |
|---|---|---|---|---|
| Male sex | 72 (42.4) | 72 (42.6) | 1.40 (0.83, 2.40) | 0.211 |
| Hypertension | 128 (75.3) | 124 (73.4) | 1.10 (0.65, 1.87) | 0.713 |
| Diabetes | 18 (10.6) | 26 (15.4) | 0.60 (0.30, 1.17) | 0.137 |
| History of tobacco use | 45 (26.5) | 64 (37.9) | 0.48 (0.26, 0.88) | 0.018* |
| Primary complaint chest pain | 70 (41.2) | 52 (30.8) | 1.40 (0.88, 2.24) | 0.156 |
| ECG obtained, mean (sd) (N = 170) | ECG not obtained, mean (sd) (N = 169) | Adjusted OR (95% CI) | p | |
| Age, years | 56.9 (18.8) | 57.7 (18.7) | 1.01 (0.99, 1.02) | 0.361 |
[i] * p < 0.05.