
Figure 1
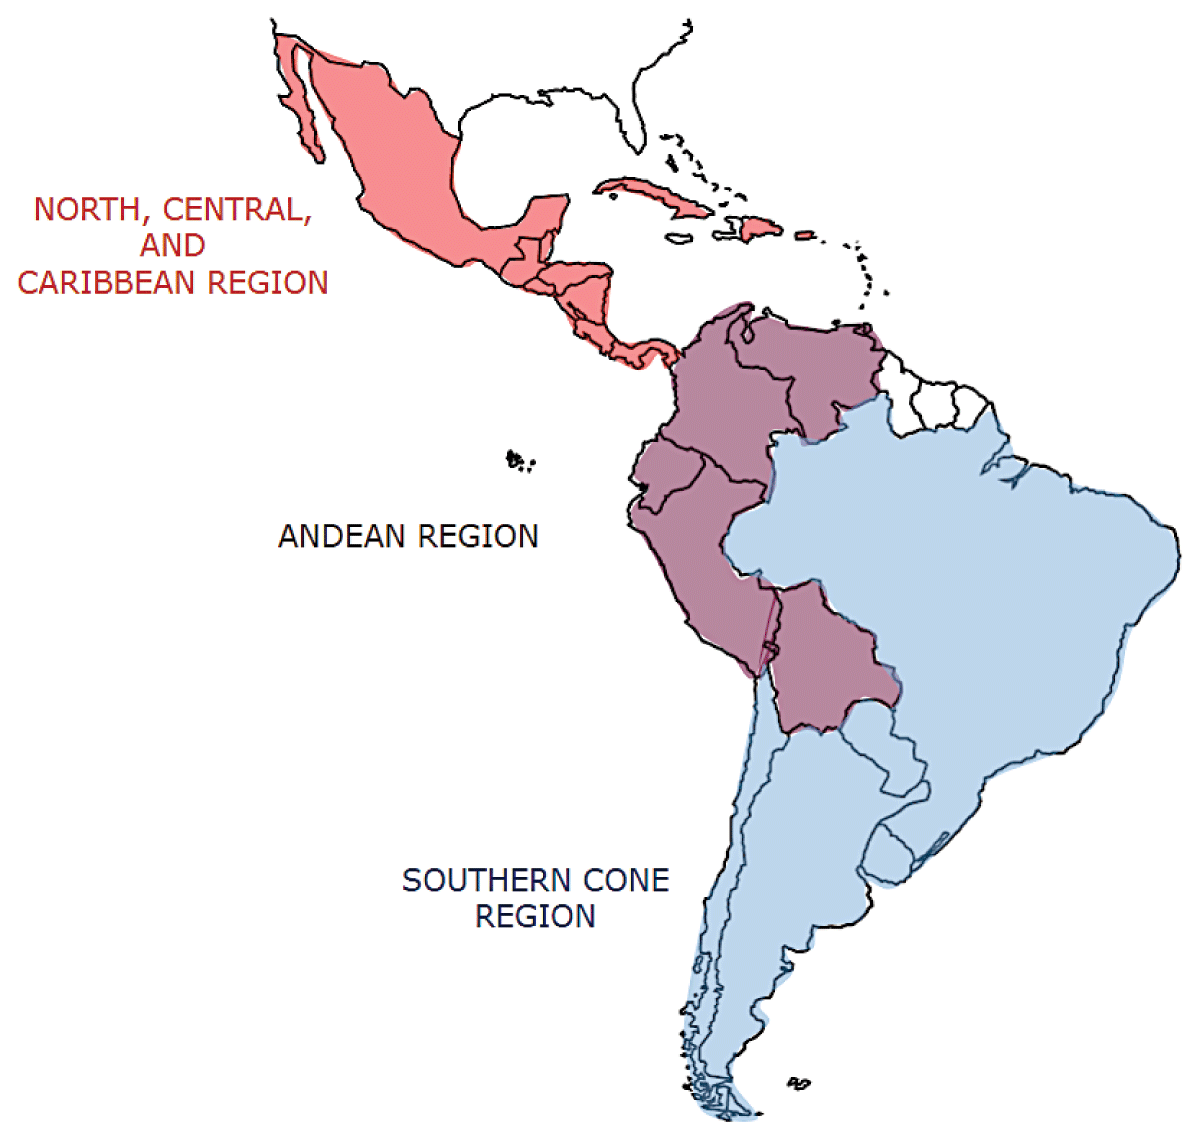
Distribution of participating countries by region (30).
Table 1
Baseline characteristics of the sample.
| VARIABLE | CENTRAL AMERICA & CARIBBEAN | ANDEAN REGION | SOUTHERN CONE | p VALUE |
|---|---|---|---|---|
| N | 8,093 | 7,492 | 4,801 | |
| Influenza vaccination (n – %) | 3,304–40.8% | 3,756–50.1% | 2,284–47.57% | < 0.001 |
| Streptococcus pneumoniae (n-%) | 2,727–33.7% | 2,611–34.85% | 1,498–31.2% | 0.05 |
| ≥ 3 doses COVID-19 (n-%) | 6,161–76.13% | 5,948–79.39% | 3,832–79.82% | < 0.001 |
| Female gender (n-%) | 5,382–66.5% | 4,647–62.03% | 3,033–63.17% | < 0.001 |
| Mean age (age + STD) | 45.29 + 17.48 | 45.81 + 16.17 | 46.51 + 16.42 | 0.025 |
| Locality of residence | ||||
| 100,000–500,000 inhabitants | 1,459–18% | 951–12.69% | 1,201–25.02% | < 0.001 |
| > 500,000 inhabitants | 2,408–29.75% | 3,272–43.69% | 1,866–38.87% | < 0.001 |
| Employment relationship | ||||
| Active | 6,352–78.49% | 5,749–70.09% | 2,963–61.72% | < 0.001 |
| Retired | 1,204–14.88% | 877–11.71% | 647–13.48% | 0.41 |
| Health service | ||||
| Public | 2,175–26.87% | 2,197–21.18% | 1,847–31.37% | < 0.001 |
| Social Security | 3,750–46.3% | 3,290–31.72% | 805–13.67% | < 0.001 |
| Cardiovascular risk factors | ||||
| Hypertension | 2,858–35.3% | 1,603–21.4% | 1,252–26.08% | < 0.001 |
| Overweight/Obesity | 1,681–20.8% | 1,457–19.45% | 1,020–21.25% | 0.07 |
| Dyslipidemia | 1,143–14.1% | 1,098–14.66% | 778–16.2% | NS |
| Diabetes | 1,082–13.4% | 451–6.02% | 573–11.94% | NS |
| Smoking | 273–3.37% | 240–3.2% | 231–5.02% | < 0.001 |
| Comorbidities | ||||
| Coronary artery disease | 505–6.24% | 328–4.38% | 143–2.97% | < 0.001 |
| Heart failure | 296–3.66% | 250–3.34% | 78–1.62% | < 0.001 |
| Kidney disease | 172–2.13% | 159–2.12% | 73–1.52% | < 0.001 |
| Stroke | 98–1.21% | 113–1.51% | 39–0.81% | < 0.001 |
| Medication use | ||||
| None | 4,155–45.5% | 4,001–53.4% | 2,040–42.49% | < 0.001 |
| ≥ 3 medications | 2,049–25.48% | 1,257–16.77% | 1,074–22.38% | < 0.001 |
| Knowledge about cardiovascular benefits of vaccination | 1,851–22.87% | 1,793–29.48% | 971–31.91% | < 0.001 |
Table 2
Multivariate logistic regression for influenza vaccination.
| VARIABLE/CATEGORY | β COEFFICIENT | 95% CI β COEFFICIENT | OR | 95% CI | p VALUE |
|---|---|---|---|---|---|
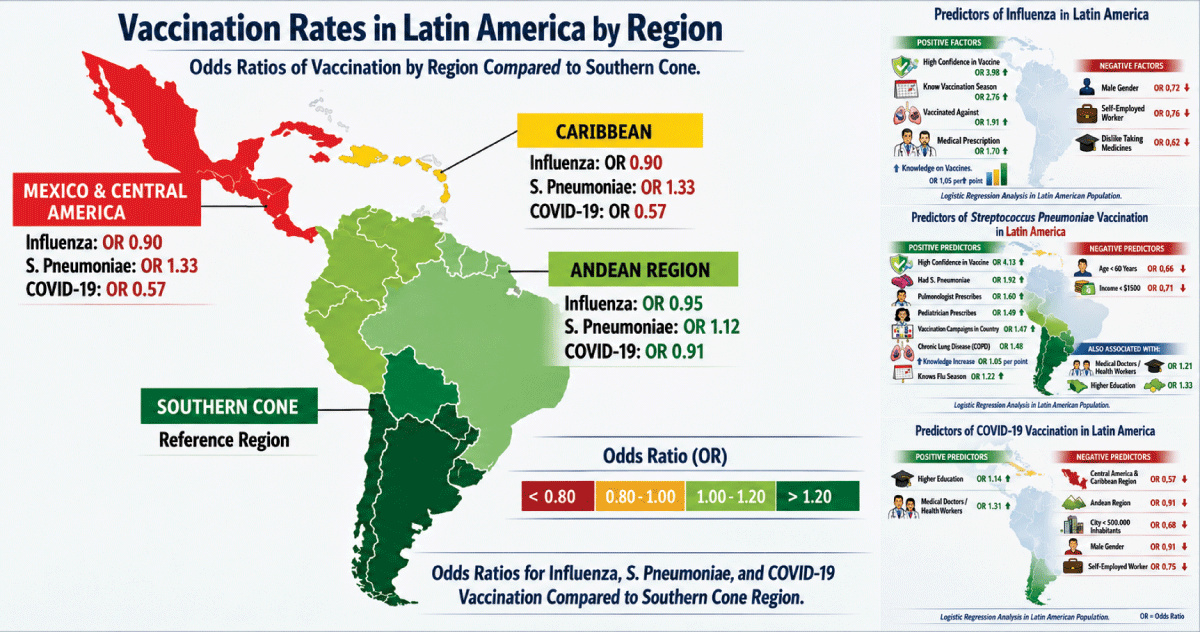
| Andean region | –0.057 | –0.172 to 0.058 | 0.945 | 0.842–1.06 | 0.335 |
| Central America & Caribbean region | –0.111 | –0.223 to 0.001 | 0.895 | 0.800–1.001 | 0.053 |
| Medical doctors and health and health care workers | 0.306 | 0.204 to 0.409 | 1.358 | 1.226–1.505 | < 0.001 |
| Male gender | –0.330 | –0.411 to –0.249 | 0.719 | 0.663–0.780 | < 0.001 |
| Self-employed worker | –0.280 | –0.386 to –0.174 | 0.756 | 0.679–0.841 | < 0.001 |
| Mean financial income < US $1,500 | 0.168 | 0.044 to 0.292 | 1.183 | 1.045–1.399 | 0.008 |
| I do not like to take medicines | –0.480 | –0.794 to –0.167 | 0.619 | 0.452–0.847 | 0.003 |
| Yes, I have Influenza | 0.099 | 0.013 to 0.186 | 1.104 | 1.013–1.204 | 0.025 |
| Confidence on Influenza vaccine ≥7 | 1.382 | 1.258 to 1.507 | 3.985 | 3.517–4.515 | < 0.001 |
| Yes, I have been vaccinated against Streptoccocus Pneumoniae | 0.644 | 0.567 to 0.722 | 1.905 | 1.763–2.059 | < 0.001 |
| Family doctor prescribes vaccination | 0.216 | 0.047 to 0.385 | 1.241 | 1.048–1.469 | 0.012 |
| Cardiologist prescribes vaccination | 0.530 | 0.295 to 0.764 | 1.698 | 1.343–2.148 | < 0.001 |
| 1-point increase knowledge benefits vaccination | 0.048 | 0.036 to 0.060 | 1.049 | 1.037–1.061 | < 0.001 |
| Yes, I know Influenza vaccination season | 1.013 | 0.928 to 1.099 | 2.755 | 2.528–3.002 | < 0.001 |
| Yes, there are Influenza and Streptococcus pneumoniae vaccination campaigns in my country | 0.522 | 0.380 to 0.663 | 1.685 | 1.463–1.941 | < 0.001 |
| Type 2 Diabetes | 0.256 | 0.118 to 0.395 | 1.292 | 1.125–1.484 | < 0.001 |
Table 3
Multivariate logistic regression for pneumococcal vaccination.
| VARIABLE/CATEGORY | β COEFFICIENT | 95% CI β COEFFICIENT | OR | 95% CI | p VALUE |
|---|---|---|---|---|---|
| Andean region | 0.114 | 0.010 to 0.216 | 1.121 | 1.010–1.244 | 0.032 |
| Central America & Caribbean region | 0.286 | 0.183 to 0.389 | 1.331 | 1,201–1.475 | < 0.001 |
| Higher education and postgraduate studies | 0.132 | 0.034 to 0.230 | 1.141 | 1.034–1.259 | 0.009 |
| Medical doctors and health care workers | 0.192 | 0.098 to 0.285 | 1.211 | 1.103–1.330 | < 0.001 |
| Age ≤ 60 years | –0.412 | –0.623 to –0.200 | 0.663 | 0.536–0.819 | < 0.001 |
| Mean financial income < US $1,500 | –0.341 | –0.455 to –0.228 | 0.711 | 0.635–0.796 | < 0.001 |
| Yes, I have Streptococcus pneumoniae | 0.654 | 0.487 to 0.821 | 1.924 | 1.628–2.273 | < 0.001 |
| Confidence on Streptococcus pneumoniae vaccine ≥7 | 1.419 | 1.292 to 1.545 | 4.131 | 3.641–4.688 | < 0.001 |
| Pulmonologist prescribes vaccination | 0.472 | 0.211 to 0.733 | 1.603 | 1.234–2.082 | < 0.001 |
| Pediatrician prescribes vaccination | 0.399 | 0.141 to 0.657 | 1.490 | 1.151–1.929 | 0.002 |
| 1-point increase knowledge benefits vaccination | 0.045 | 0.034 to 0.055 | 1.046 | 1.035–1.057 | < 0.001 |
| Yes, I know Influenza vaccination season | 0.202 | 0.114 to 0.289 | 1.223 | 1.121–1.335 | < 0.001 |
| Yes, there are Influenza and Streptococcus pneumoniae vaccination campaigns in my country | 0.386 | 0.250 to 0.523 | 1.472 | 1.264–1.687 | < 0.001 |
| Chronic obstructive pulmonary disease | 0.389 | 0.196 to 0.581 | 1.475 | 1.217–1.788 | < 0.001 |
Table 4
Multivariate logistic regression for COVID-19 vaccination.
| VARIABLE/CATEGORY | β COEFFICIENT | 95% CI β COEFFICIENT | OR | 95% CI | p VALUE |
|---|---|---|---|---|---|
| Andean region | –0.093 | –0.245 to 0.058 | 0.911 | 0.783–1.059 | 0.225 |
| Central America & Caribbean region | –0.566 | –0.707 to –0.426 | 0.568 | 0.493–0.653 | <0.001 |
| Higher education and postgraduate studies | 0.127 | 0.013 to 0.241 | 1.135 | 1.013–1.272 | 0.029 |
| Medical doctors and health care workers | 0.273 | 0.143 to 0.403 | 1.314 | 1.154–1.496 | <0.001 |
| Living in city <500.000 inhabitants | –0.387 | –0.559 to –0.214 | 0.679 | 0.572–0.807 | <0.001 |
| Male gender | –0.100 | –0.196 to –0.004 | 0.905 | 0.822–0.996 | 0.041 |
| Self-employed worker | –0.286 | –0.443 to 0.129 | 0.751 | 0.642–0.879 | <0.001 |