
Figure 1
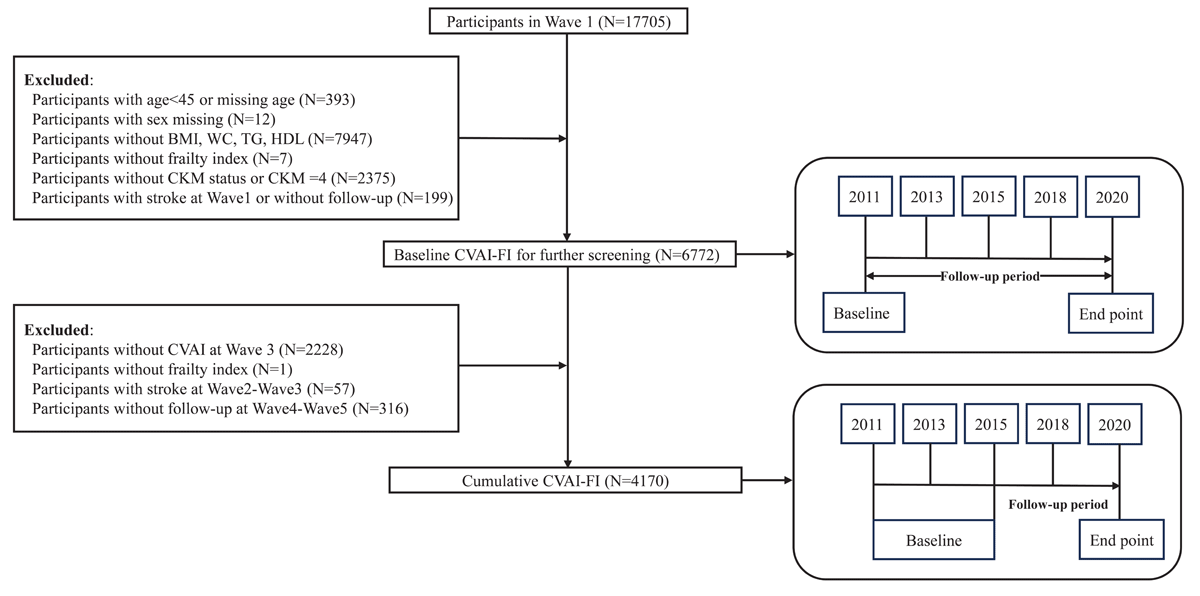
Participant selection flowchart. From 17,705 initial CHARLS participants, 6,772 were eligible for baseline CVAI-FI analysis (2011–2020) and 4,170 for cumulative analysis (2015–2020) after applying exclusion criteria shown in the flowchart. Abbreviations: CVAI-FI, Chinese visceral adiposity index-frailty index; CKM, cardiovascular-kidney-metabolic; BMI, body mass index; WC, waist circumference; TG, triglycerides; HDL, high-density lipoprotein cholesterol.
Table 1
Baseline characteristics of individuals classified by quartiles of the Chinese visceral adiposity index-frailty index (CVAI-FI) among individuals with CKM syndrome stages 0–3.
| CHARACTERISTIC | OVERALL (N = 6,772)1 | Q1 (N = 1,693)1 | Q2 (N = 1,693)1 | Q3 (N = 1,693)1 | Q4 (N = 1,693)1 | P VALUE2 |
|---|---|---|---|---|---|---|
| FI index | 0.15 ± (0.11) | 0.05 ± (0.04) | 0.10 ± (0.05) | 0.16 ± (0.06) | 0.28 ± (0.11) | <0.001 |
| Frailty | 1,049 (15%) | 10 (0.6%) | 24 (1.4%) | 136 (8.0%) | 879 (52%) | <0.001 |
| CKM | <0.001 | |||||
| 0 | 280 (4.1%) | 134 (7.9%) | 79 (4.7%) | 48 (2.8%) | 19 (1.1%) | |
| 1 | 749 (11%) | 235 (14%) | 209 (12%) | 187 (11%) | 118 (7.0%) | |
| 2 | 1,573 (23%) | 368 (22%) | 388 (23%) | 448 (26%) | 369 (22%) | |
| 3 | 4,170 (62%) | 956 (56%) | 1,017 (60%) | 1,010 (60%) | 1,187 (70%) | |
| Age, years | 59 ± (9) | 55 ± (8) | 57 ± (9) | 59 ± (9) | 64 ± (10) | <0.001 |
| Sex, male | 3,198 (47%) | 982 (58%) | 891 (53%) | 739 (44%) | 586 (35%) | <0.001 |
| Education level | 2,054 (30%) | 771 (46%) | 602 (36%) | 420 (25%) | 261 (15%) | <0.001 |
| Smoking | 2,649 (39%) | 772 (46%) | 731 (43%) | 625 (37%) | 521 (31%) | <0.001 |
| Marital status (married) | 5,996 (89%) | 1,567 (93%) | 1,535 (91%) | 1,492 (88%) | 1,402 (83%) | <0.001 |
| Drinking | 1,291 (19%) | 241 (14%) | 336 (20%) | 328 (19%) | 386 (23%) | <0.001 |
| Glucose (mg/dl) | 109 ± (34) | 105 ± (29) | 106 ± (27) | 109 ± (32) | 116 ± (44) | <0.001 |
| Glycated Hemoglobin (%) | 5.26 ± (0.81) | 5.16 ± (0.74) | 5.20 ± (0.69) | 5.27 ± (0.79) | 5.43 ± (0.96) | <0.001 |
| Total Cholesterol (mg/dl) | 194 ± (38) | 190 ± (38) | 192 ± (38) | 194 ± (36) | 200 ± (40) | <0.001 |
| LDL Cholesterol (mg/dl) | 117 ± (35) | 115 ± (34) | 116 ± (34) | 117 ± (34) | 120 ± (37) | <0.001 |
| eGFR, mL/min/1.73 m2 | 93 ± (14) | 96 ± (13) | 94 ± (14) | 93 ± (14) | 89 ± (15) | <0.001 |
| SBP, mmHg | 129 ± (21) | 123 ± (18) | 126 ± (20) | 129 ± (21) | 136 ± (23) | <0.001 |
| DBP, mmHg | 75 ± (12) | 74 ± (12) | 74 ± (12) | 75 ± (12) | 77 ± (12) | <0.001 |
| Hypertension | 2,508 (37%) | 344 (20%) | 536 (32%) | 656 (39%) | 972 (57%) | <0.001 |
| Diabetes | 1,015 (15%) | 157 (9.3%) | 195 (12%) | 258 (15%) | 405 (24%) | <0.001 |
| Cancer | 55 (0.8%) | 9 (0.5%) | 9 (0.5%) | 17 (1.0%) | 20 (1.2%) | 0.074 |
| Chronic lung disease | 610 (9.0%) | 60 (3.5%) | 111 (6.6%) | 182 (11%) | 257 (15%) | <0.001 |
| Liver disease | 249 (3.7%) | 32 (1.9%) | 56 (3.3%) | 71 (4.2%) | 90 (5.3%) | <0.001 |
| Kidney disease | 398 (5.9%) | 80 (4.7%) | 87 (5.1%) | 106 (6.3%) | 125 (7.4%) | 0.004 |
| Lipid-lowering drugs | 247 (3.6%) | 21 (1.2%) | 44 (2.6%) | 70 (4.1%) | 112 (6.6%) | <0.001 |
| Insurance | 6,401 (95%) | 1,601 (95%) | 1,610 (95%) | 1,592 (94%) | 1,598 (94%) | 0.6 |
| Residence (urban) | 3,880 (57%) | 1,024 (60%) | 994 (59%) | 976 (58%) | 886 (52%) | <0.001 |
[i] 1Mean ± (SD); n (%); 2Kruskal-Wallis rank sum test; Pearson’s Chi-squared test.
Table 2
Baseline characteristics of individuals classified by quartiles of the cumulative Chinese visceral adiposity index-frailty index (CVAI-FI) among individuals with CKM syndrome stages 0–3.
| CHARACTERISTIC | OVERALL (N = 4,170)1 | Q1 (N =1,043)1 | Q2 (N =1,042)1 | Q3 (N =1,042)1 | Q4 (N =1,043)1 | P VALUE2 |
|---|---|---|---|---|---|---|
| FI index2011 | 0.14 ± (0.11) | 0.06 ± (0.05) | 0.11 ± (0.06) | 0.15 ± (0.08) | 0.25 ± (0.12) | <0.001 |
| FI index2015 | 0.18 ± (0.13) | 0.07 ± (0.05) | 0.13 ± (0.07) | 0.19 ± (0.08) | 0.32 ± (0.13) | <0.001 |
| Frailty2011 | 591 (14%) | 8 (0.8%) | 30 (2.9%) | 109 (10%) | 444 (43%) | <0.001 |
| Frailty2015 | 939 (23%) | 7 (0.7%) | 46 (4.4%) | 200 (19%) | 686 (66%) | <0.001 |
| CKM | <0.001 | |||||
| 0 | 172 (4.1%) | 76 (7.3%) | 44 (4.2%) | 43 (4.1%) | 9 (0.9%) | |
| 1 | 509 (12%) | 149 (14%) | 153 (15%) | 125 (12%) | 82 (7.9%) | |
| 2 | 1,029 (25%) | 217 (21%) | 263 (25%) | 280 (27%) | 269 (26%) | |
| 3 | 2,460 (59%) | 601 (58%) | 582 (56%) | 594 (57%) | 683 (65%) | |
| Age, years | 58 ± (9) | 55 ± (8) | 57 ± (8) | 59 ± (8) | 62 ± (9) | <0.001 |
| Sex, male | 1,901 (46%) | 637 (61%) | 531 (51%) | 422 (40%) | 311 (30%) | <0.001 |
| Education level | 1,285 (31%) | 498 (48%) | 353 (34%) | 265 (25%) | 169 (16%) | <0.001 |
| Smoking | 1,570 (38%) | 496 (48%) | 439 (42%) | 356 (34%) | 279 (27%) | <0.001 |
| Marital status (married) | 3,756 (90%) | 978 (94%) | 960 (92%) | 928 (89%) | 890 (85%) | <0.001 |
| Drinking | 790 (19%) | 173 (17%) | 198 (19%) | 197 (19%) | 222 (21%) | 0.058 |
| Glucose (mg/dl) | 109 ± (33) | 104 ± (24) | 106 ± (26) | 110 ± (37) | 115 ± (41) | <0.001 |
| Glycated Hemoglobin (%) | 5.26 ± (0.79) | 5.13 ± (0.61) | 5.17 ± (0.70) | 5.31 ± (0.82) | 5.43 ± (0.96) | <0.001 |
| Total Cholesterol (mg/dl) | 194 ± (38) | 188 ± (36) | 193 ± (38) | 195 ± (37) | 200 ± (39) | <0.001 |
| LDL Cholesterol (mg/dl) | 117 ± (35) | 112 ± (32) | 117 ± (35) | 118 ± (35) | 121 ± (36) | <0.001 |
| eGFR | 94 ± (14) | 96 ± (13) | 95 ± (13) | 94 ± (14) | 90 ± (15) | <0.001 |
| SBP, mmHg | 128 ± (20) | 122 ± (17) | 125 ± (19) | 129 ± (20) | 135 ± (22) | <0.001 |
| DBP, mmHg | 75 ± (12) | 73 ± (11) | 74 ± (12) | 75 ± (12) | 77 ± (12) | <0.001 |
| Hypertension | 1,503 (36%) | 200 (19%) | 295 (28%) | 426 (41%) | 582 (56%) | <0.001 |
| Diabetes | 618 (15%) | 84 (8.1%) | 117 (11%) | 171 (16%) | 246 (24%) | <0.001 |
| Cancer | 36 (0.9%) | 4 (0.4%) | 8 (0.8%) | 11 (1.1%) | 13 (1.2%) | 0.2 |
| Chronic lung disease | 372 (8.9%) | 41 (3.9%) | 69 (6.6%) | 103 (9.9%) | 159 (15%) | <0.001 |
| Liver disease | 137 (3.3%) | 24 (2.3%) | 34 (3.3%) | 39 (3.7%) | 40 (3.8%) | 0.2 |
| Kidney disease | 221 (5.3%) | 44 (4.2%) | 46 (4.4%) | 58 (5.6%) | 73 (7.0%) | 0.017 |
| Lipid-lowering drugs | 171 (4.1%) | 17 (1.6%) | 29 (2.8%) | 41 (3.9%) | 84 (8.1%) | <0.001 |
| Insurance | 3,968 (95%) | 997 (96%) | 995 (95%) | 992 (95%) | 984 (94%) | 0.5 |
| Residence (urban) | 2,465 (59%) | 647 (62%) | 637 (61%) | 592 (57%) | 589 (56%) | 0.013 |
[i] 1Mean ± (SD); n (%); 2Kruskal-Wallis rank sum test; Pearson’s Chi-squared test.
Table 3
Association between the Chinese visceral adiposity index (CVAI)-frailty index and stroke incidence in individuals with Cardiovascular-Kidney-Metabolic Syndrome Stage 0–3.
| CHARACTERISTIC | MODEL 1 OR (95%CI), P | MODEL 2 OR (95%CI), P | MODEL 3 OR (95%CI), P |
|---|---|---|---|
| Per unit increase | 1.027 (1.022, 1.033), <0.0001 | 1.022 (1.016, 1.028), <0.0001 | 1.020 (1.013, 1.026), <0.0001 |
| Per SD increase | 1.446 (1.343, 1.555), <0.0001 | 1.346 (1.237, 1.463), <0.0001 | 1.312 (1.201, 1.432), <0.0001 |
| CVAI-FI quartile | |||
| Q1 | 1 (Reference) | 1 (Reference) | 1 (Reference) |
| Q2 | 1.855 (1.319, 2.637)** | 1.742 (1.234, 2.485)** | 1.706 (1.208, 2.435)** |
| Q3 | 2.407 (1.737, 3.383)** | 2.197 (1.570, 3.113)** | 2.103 (1.499, 2.986)** |
| Q4 | 3.778 (2.775, 5.230)** | 3.040 (2.172, 4.314)** | 2.772 (1.965, 3.963)** |
| P for trend | <0.0001 | <0.0001 | <0.0001 |
[i] Model 1: unadjusted for any covariates; Model 2: adjusted for gender, age, residence, education level, marital status, smoking status, drinking status, insurance status, and systolic blood pressure (SBP); Model 3: adjusted for gender, age, residence, education level, marital status, smoking status, drinking status, insurance status, systolic blood pressure (SBP), Glycated hemoglobin (HBA1c), fasting blood glucose (FBG), diabetes, cancer, liver cancer, kidney disease, chronic lung disease, total cholesterol (TC), low-density lipoprotein cholesterol (LDL-C), estimated glomerular filtration rate (eGFR), and lipid-lowering drugs. Note: *P < 0.05, **P < 0.01.
Table 4
Association between the cumulative Chinese visceral adiposity index-frailty index (CVAI-FI) and stroke incidence in individuals with Cardiovascular-Kidney-Metabolic Syndrome Stage 0–3.
| CHARACTERISTIC | MODEL 1 OR (95%CI), P | MODEL 2 OR (95%CI), P | MODEL 3 OR (95%CI), P |
|---|---|---|---|
| Per unit increase | 1.012 (1.010, 1.015), <0.0001 | 1.011 (1.008, 1.013), <0.0001 | 1.011 (1.008, 1.014), <0.0001 |
| Per SD increase | 1.637 (1.485, 1.802), <0.0001 | 1.542 (1.380, 1.720), <0.0001 | 1.536 (1.366, 1.724), <0.0001 |
| Cumulative CVAI-FI quartile | |||
| Q1 | 1 (Reference) | 1 (Reference) | 1 (Reference) |
| Q2 | 2.140 (1.320, 3.565)** | 2.036 (1.249, 3.407)** | 1.984 (1.216, 3.325)** |
| Q3 | 2.503 (1.563, 4.131)** | 2.238 (1.377, 3.743)** | 2.159 (1.323, 3.623)** |
| Q4 | 5.834 (3.808, 9.319)** | 4.838 (3.041, 7.977)** | 4.548 (2.825, 7.572)** |
| P for trend | <0.0001 | <0.0001 | <0.0001 |
[i] Model 1: unadjusted for any covariates; Model 2: adjusted for gender, age, residence, education level, marital status, smoking status, drinking status, insurance status, and systolic blood pressure (SBP); Model 3: adjusted for gender, age, residence, education level, marital status, smoking status, drinking status, insurance status, systolic blood pressure (SBP), diastolic blood pressure (DBP), Glycated hemoglobin (HBA1c), fasting blood glucose (FBG), diabetes, cancer, liver cancer, kidney disease, chronic lung disease, total cholesterol (TC), low-density lipoprotein cholesterol (LDL-C), estimated glomerular filtration rate (eGFR), and lipid-lowering drugs. Note: *P < 0.05, **P < 0.01.
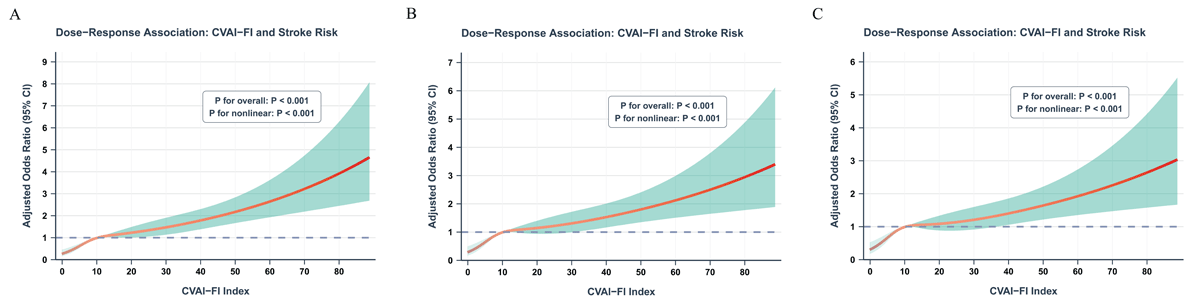
Figure 2
Restricted cubic spline analysis of the dose-response relationship between baseline CVAI-FI and stroke incidence. (A) Model 1: crude model. (B) Model 2: adjusted for demographic and lifestyle factors (gender, age, residence, education, marital status, smoking, drinking, insurance, SBP). (C) Model 3: fully adjusted model including Model 2 covariates plus metabolic and clinical parameters (HbA1c, FBG, diabetes, cancer, liver disease, kidney disease, chronic lung disease, TC, LDL-C, eGFR, lipid-lowering medication). The solid red line represents adjusted odds ratio with shaded area indicating 95% CI. Knots were placed at the 5th, 35th, 65th, and 95th percentiles. All models show significant nonlinear associations (P for overall < 0.001; P for nonlinear < 0.001).
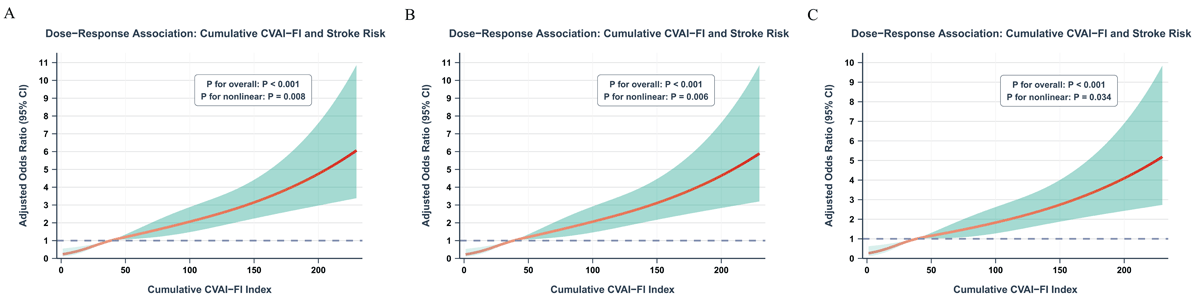
Figure 3
Restricted cubic spline analysis of the dose-response relationship between cumulative CVAI-FI and stroke incidence. (A) Model 1: crude model. (B) Model 2: adjusted for demographic and lifestyle factors (gender, age, residence, education, marital status, smoking, drinking, insurance, SBP). (C) Model 3: fully adjusted model including Model 2 covariates plus metabolic and clinical parameters (HbA1c, FBG, diabetes, cancer, liver disease, kidney disease, chronic lung disease, TC, LDL-C, eGFR, lipid-lowering medication). The solid red line represents adjusted odds ratio with shaded area indicating 95% CI. All models show significant nonlinear associations (P for overall < 0.001; P for nonlinear < 0.01).
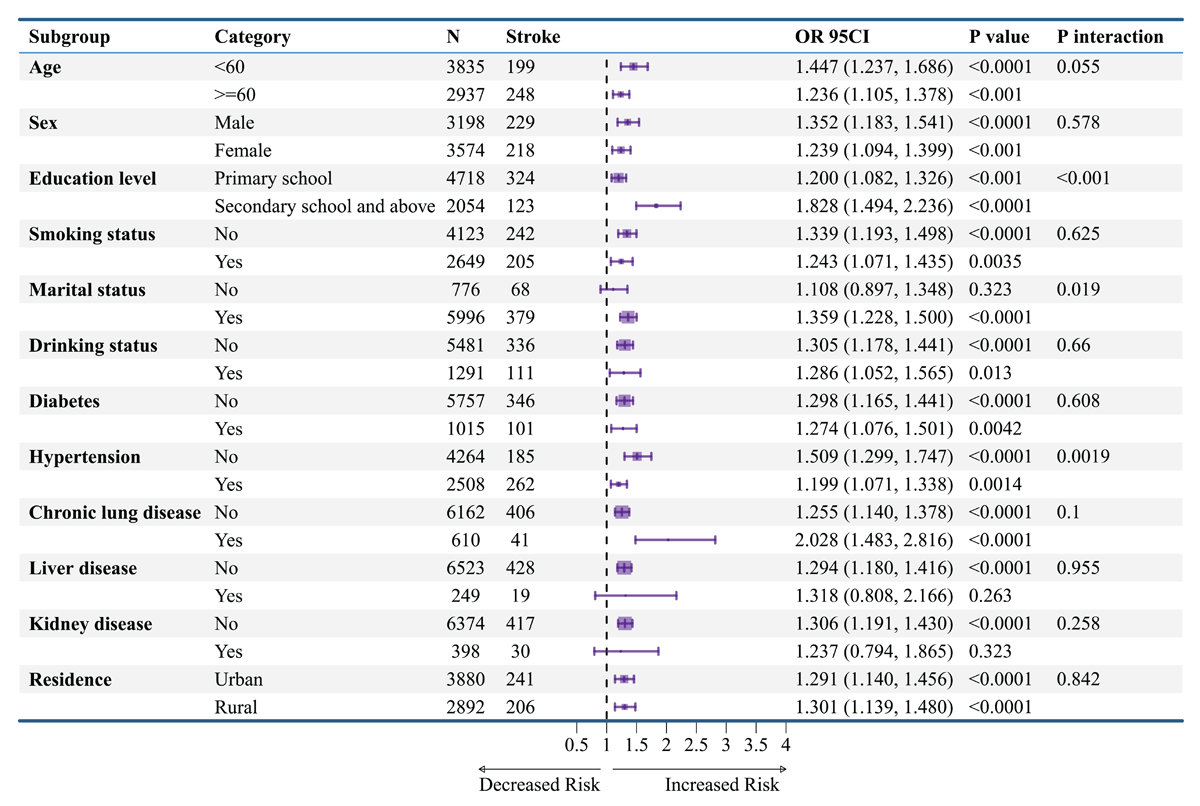
Figure 4
Subgroup analysis of the association between baseline CVAI-FI and stroke incidence. Forest plot presenting subgroup-specific odds ratios (ORs) and 95% confidence intervals (CIs) for the association between baseline CVAI-FI (per 1 standard deviation increase) and incident stroke across pre-specified demographic, lifestyle, and clinical subgroups.
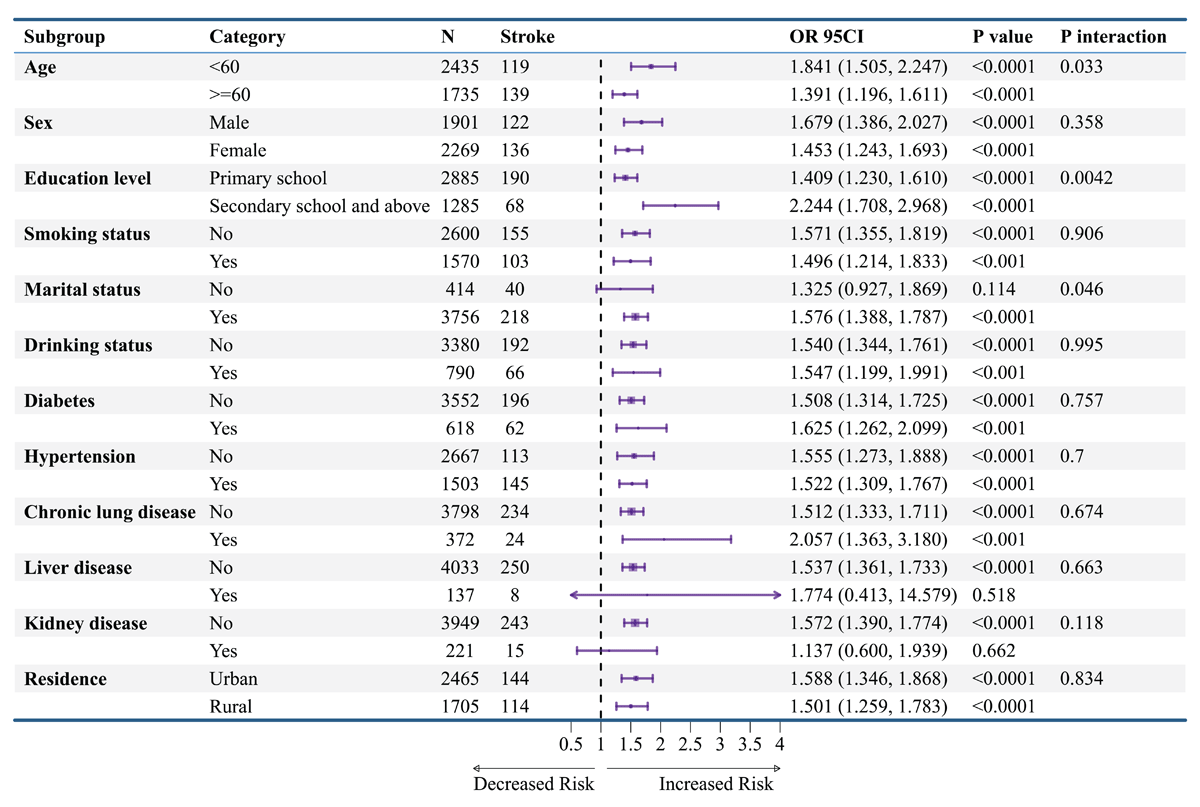
Figure 5
Subgroup analysis of the association between cumulative CVAI-FI and stroke incidence. Forest plot presenting subgroup-specific odds ratios (ORs) and 95% confidence intervals (CIs) for the association between cumulative CVAI-FI (per 1 standard deviation increase) and incident stroke across pre-specified demographic, lifestyle, and clinical subgroups. Cumulative CVAI-FI represents the average of measurements at Wave 1 (2011) and Wave 3 (2015). Black squares represent OR point estimates with size proportional to precision; horizontal lines indicate 95% CIs. The vertical dashed line at OR = 1.0 represents the null value. All models were adjusted for demographics, lifestyle, metabolic, and clinical covariates, with stratification variables excluded from respective analyses. P values test within-subgroup associations; P for interaction tests heterogeneity across subgroup categories.
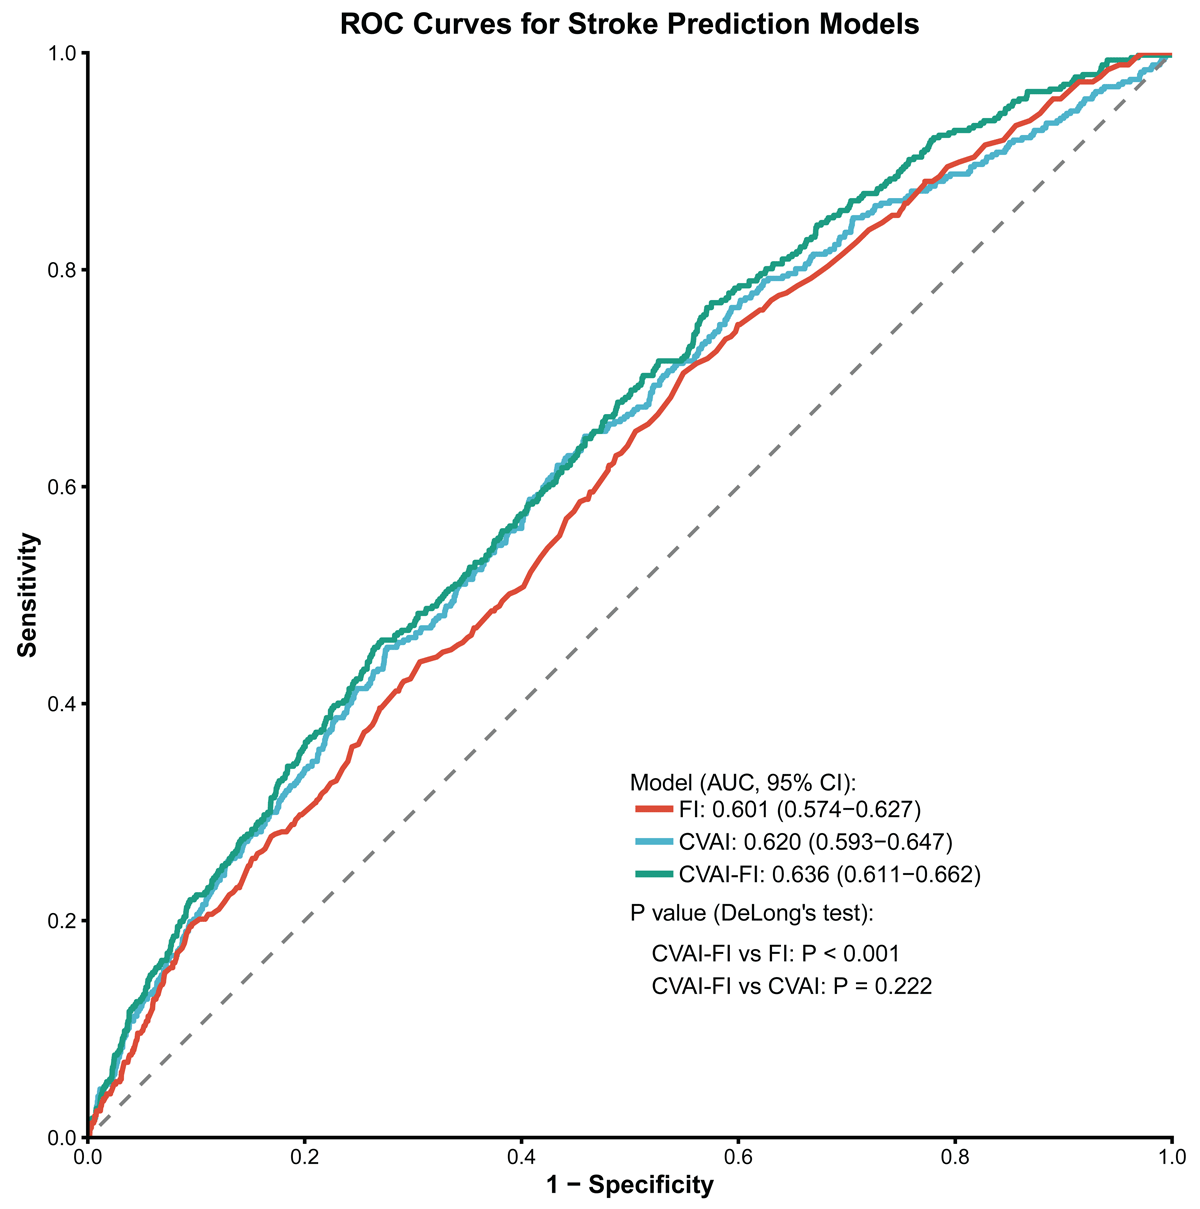
Figure 6
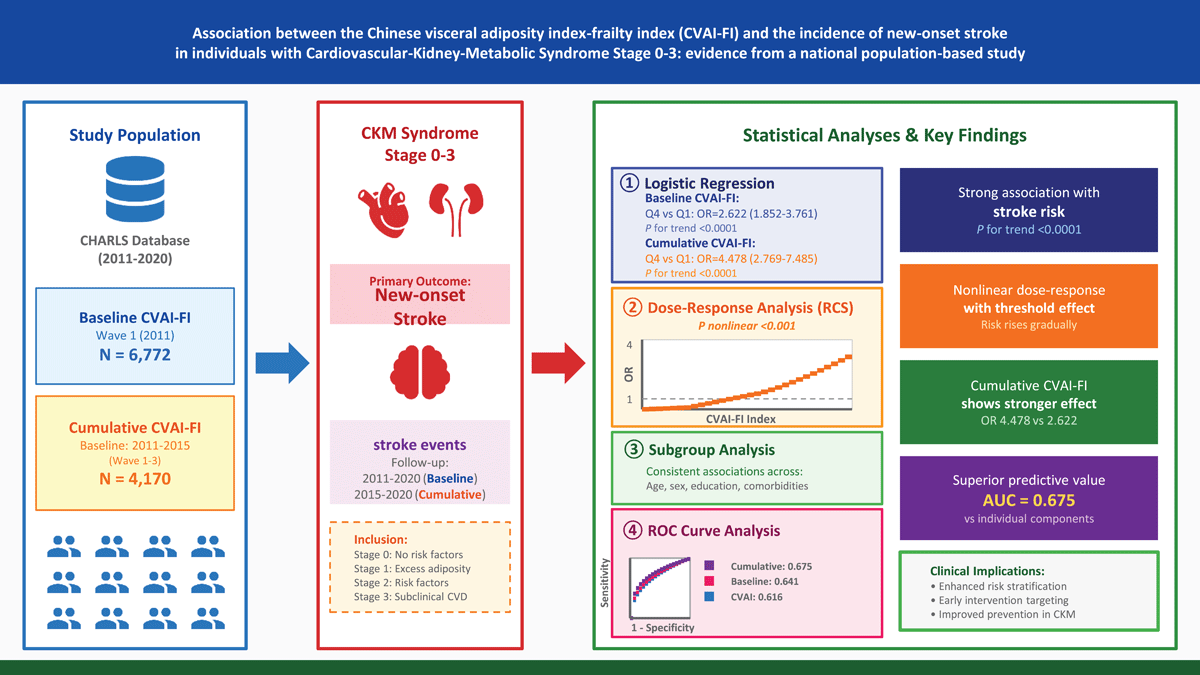
Receiver operating characteristic curves comparing predictive performance of baseline indices for stroke prediction. Receiver operating characteristic (ROC) curves comparing the discriminatory capacity of baseline frailty index (FI), Chinese visceral adiposity index (CVAI), and their combination (CVAI-FI) for predicting incident stroke over 9-year follow-up. The y-axis represents sensitivity (true positive rate) and the x-axis represents 1-specificity (false positive rate). Each colored curve corresponds to one predictive model, with the area under the curve (AUC) and 95% CI displayed in the legend.
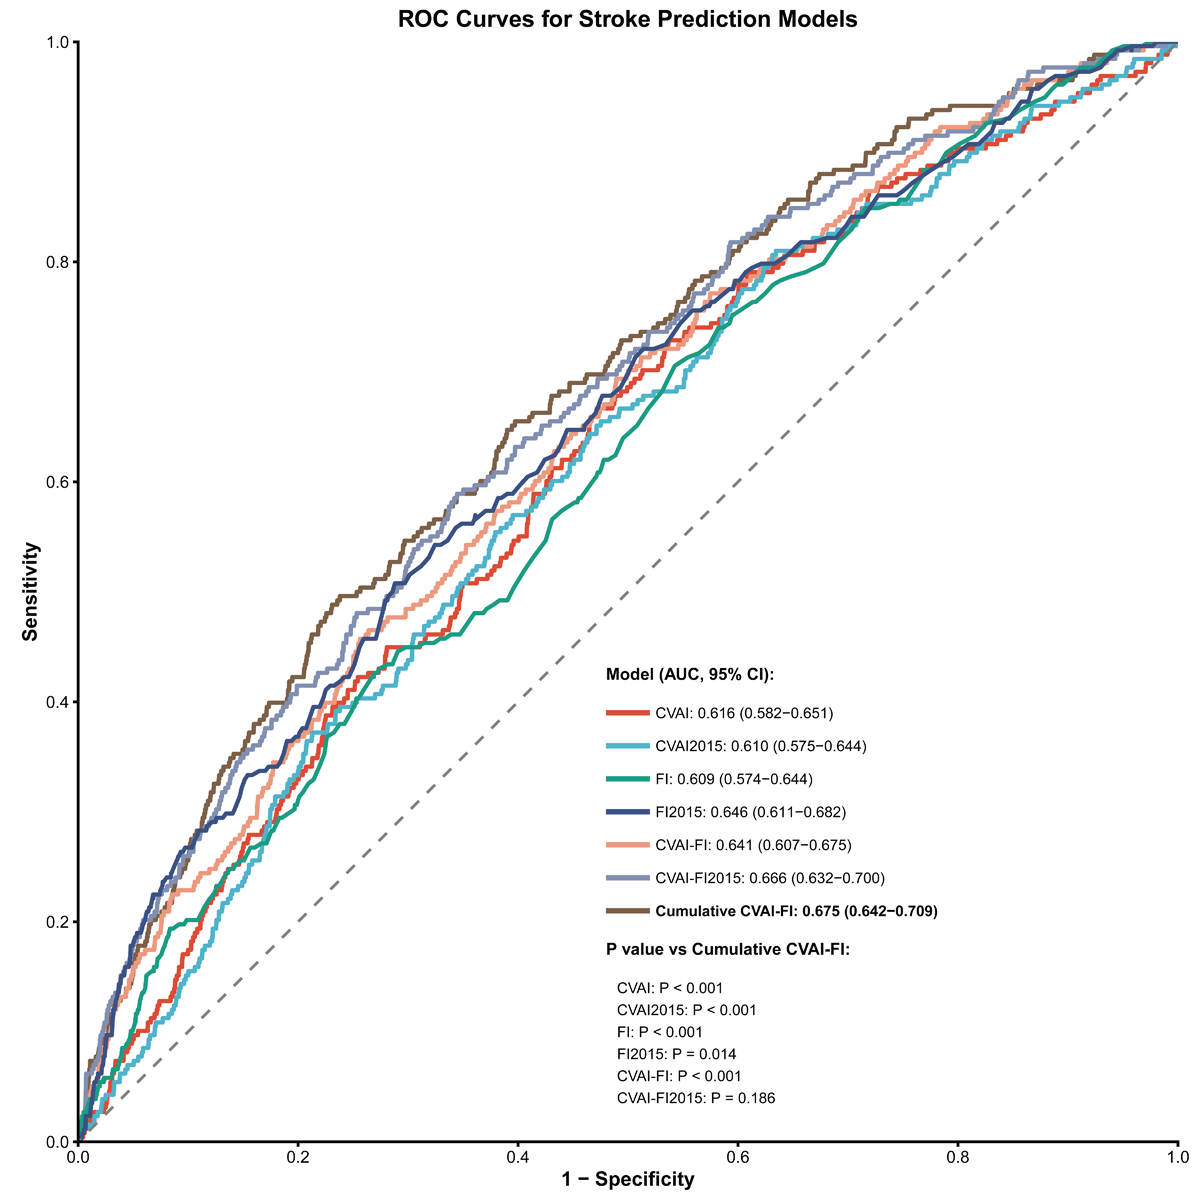
Figure 7
Receiver operating characteristic curves comparing predictive performance of cumulative indices for stroke prediction. Receiver operating characteristic (ROC) curves comparing the discriminatory capacity of multiple baseline and cumulative indices for predicting incident stroke. Models include baseline measurements (Wave 1, 2011): CVAI (AUC = 0.616), FI (AUC = 0.609), CVAI-FI (AUC = 0.641); Wave 3 measurements (2015): CVAI2015 (AUC = 0.610), FI2015 (AUC = 0.646), CVAI-FI2015 (AUC = 0.666); and cumulative CVAI-FI (AUC = 0.675, 95% CI: 0.642–0.709). Each colored curve represents one model, with AUC values and 95% CIs displayed in the legend.