
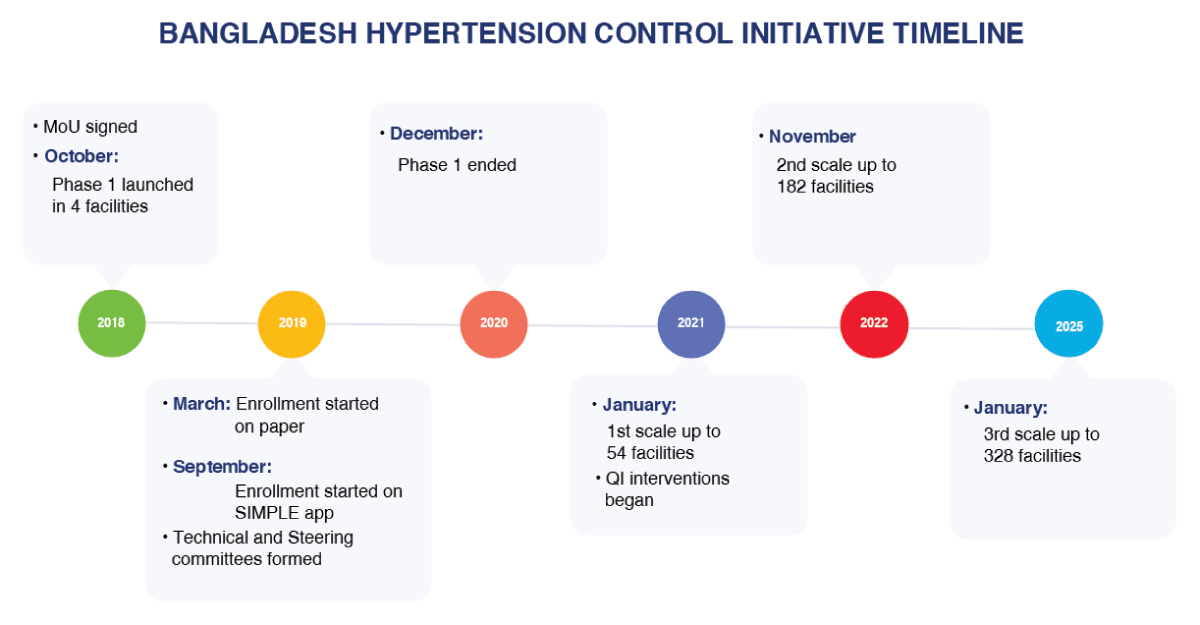
Figure 1
Timeline of key activity highlights in the Bangladesh Hypertension Control Initiative.
Table 1
Components of the Bangladesh Hypertension Control Initiative.
| Evidence-based treatment protocols |
|
| Medication and equipment supply |
|
| Team-based care |
|
| Patient-centered services |
|
| Information systems |
|
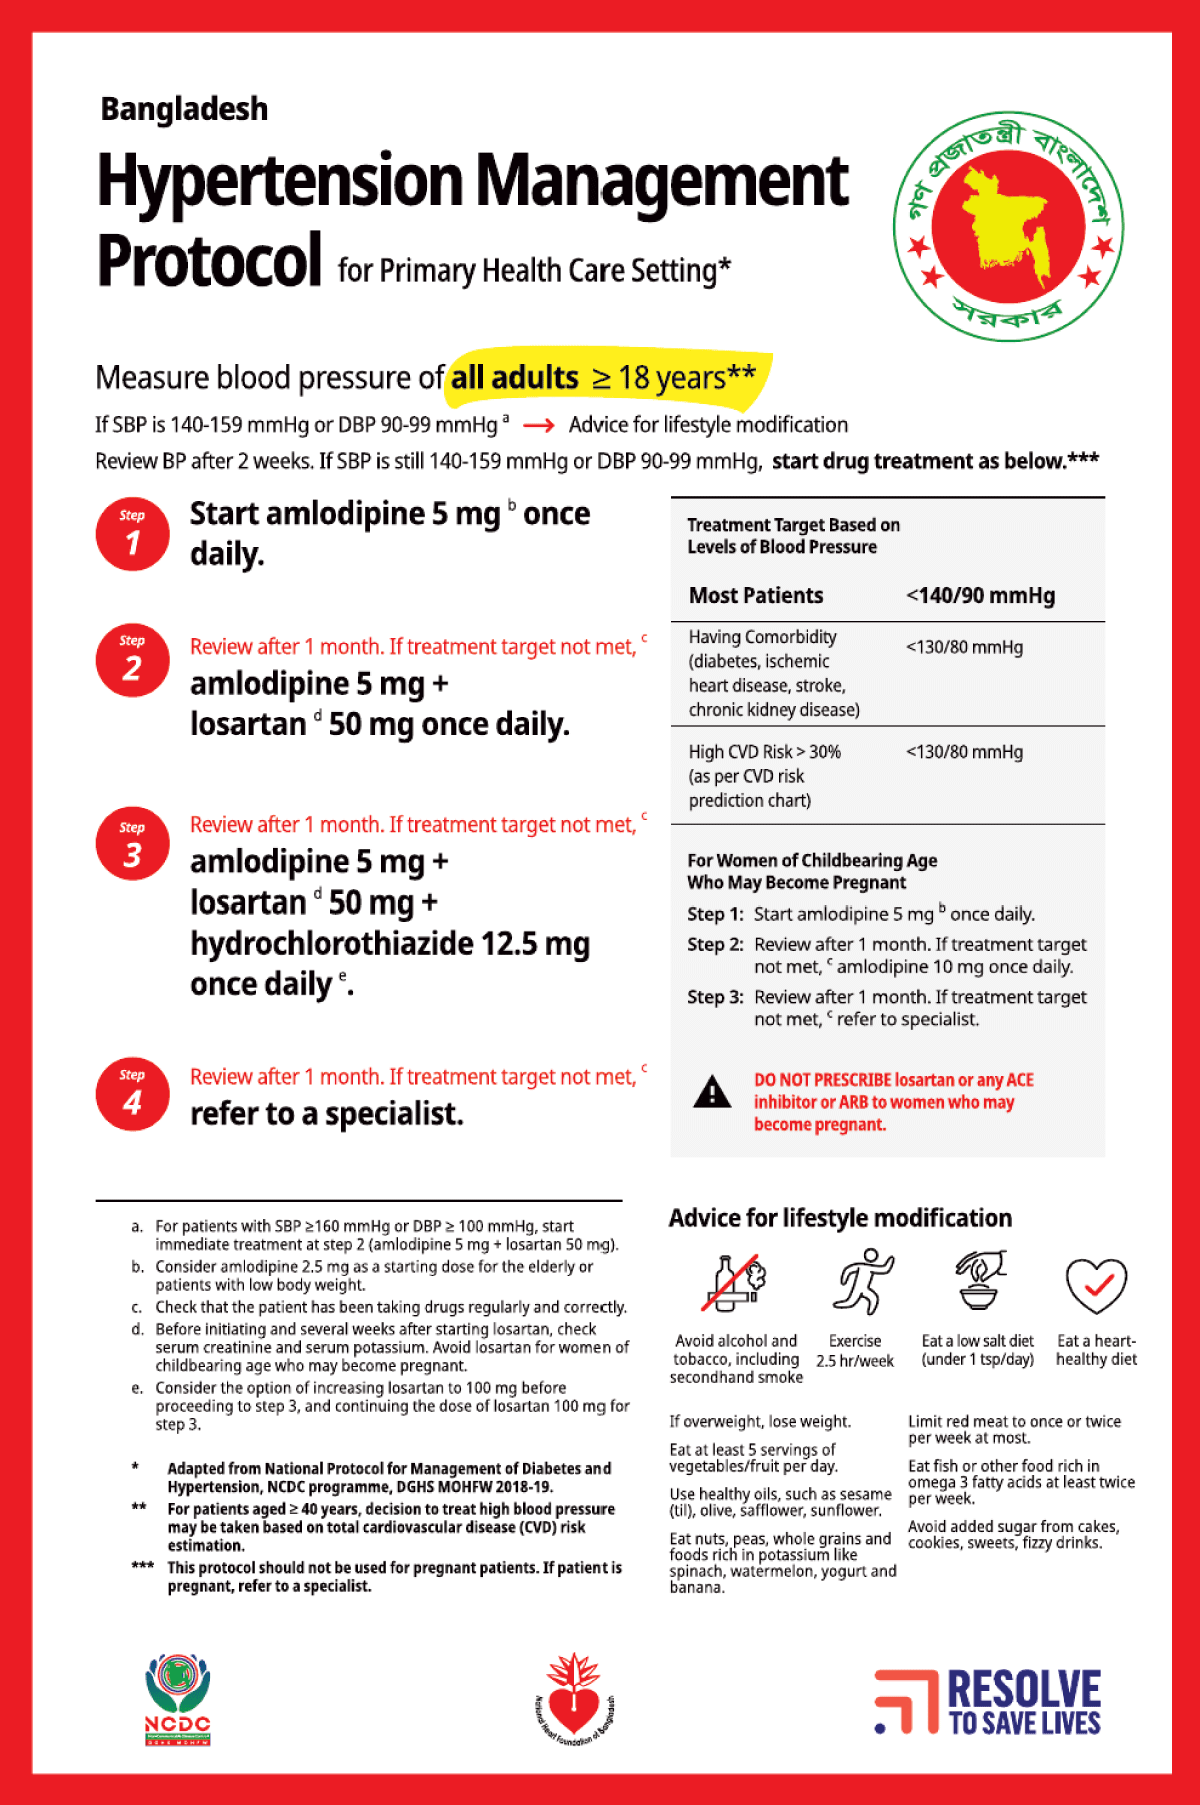
Figure 2
Hypertension management protocol for primary health care settings in Bangladesh.
Table 2
Phased BHCI implementation strategies.
| IMPLEMENTATION STRATEGY | PHASE 1 OCTOBER 2018–DECEMBER 2020 | PHASE 2 JANUARY 2021–OCTOBER 2022 | PHASE 2 EXPANSION NOVEMBER 2022–DECEMBER 2024 | PHASE 3 JANUARY 2025–MAY 2026 |
|---|---|---|---|---|
| Number of facilities (target)a,b | 4 | 54 | 182 | 328 |
| Population coverage (adult)a | 617,015 | 9,729,922 | 35,638,781 | 54,324,602 |
| Number of facilities (activated)a,b | 4 | 51 | 172 | 320 |
| NCD Corner activation | ✓ | ✓ | ✓ | ✓ |
| Partnership and catalytic funding | ✓ | ✓ | ✓ | ✓ |
| Situation analysis | ✓ | ✓ | ✓ | ✓ |
| Development of hypertension treatment protocol for PHC | ✓ | |||
| Facility assessment | ✓ | ✓ | ✓ | ✓ |
| Hypertension management training and capacity building | ✓ | ✓ | ✓ | ✓ |
| Patient flow and clinical decision streamlining | ✓ | ✓ | ✓ | ✓ |
| Systematic follow-up and reminder | ✓ | ✓ | ✓ | ✓ |
| Information system optimization | ✓ | ✓ | ✓ | ✓ |
| Implementation monitoring and supervision | ✓ | |||
| Quality improvement | ✓ | ✓ | ✓ | |
| Medicine refilling from CCs | ✓ | ✓ | ✓ | |
| Community-based HEARTS | ✓ | |||
| Improvement of medicine quantification and forecasting | ✓ | |||
| Dissemination and documentation | ✓ | ✓ | ||
| Stakeholder engagement and advocacy | ✓ | ✓ | ✓ | ✓ |
[i] a – Population and facility coverage numbers in each phase are cumulative.
b – Facilities were under renovation during the corresponding phases, but were activated later.
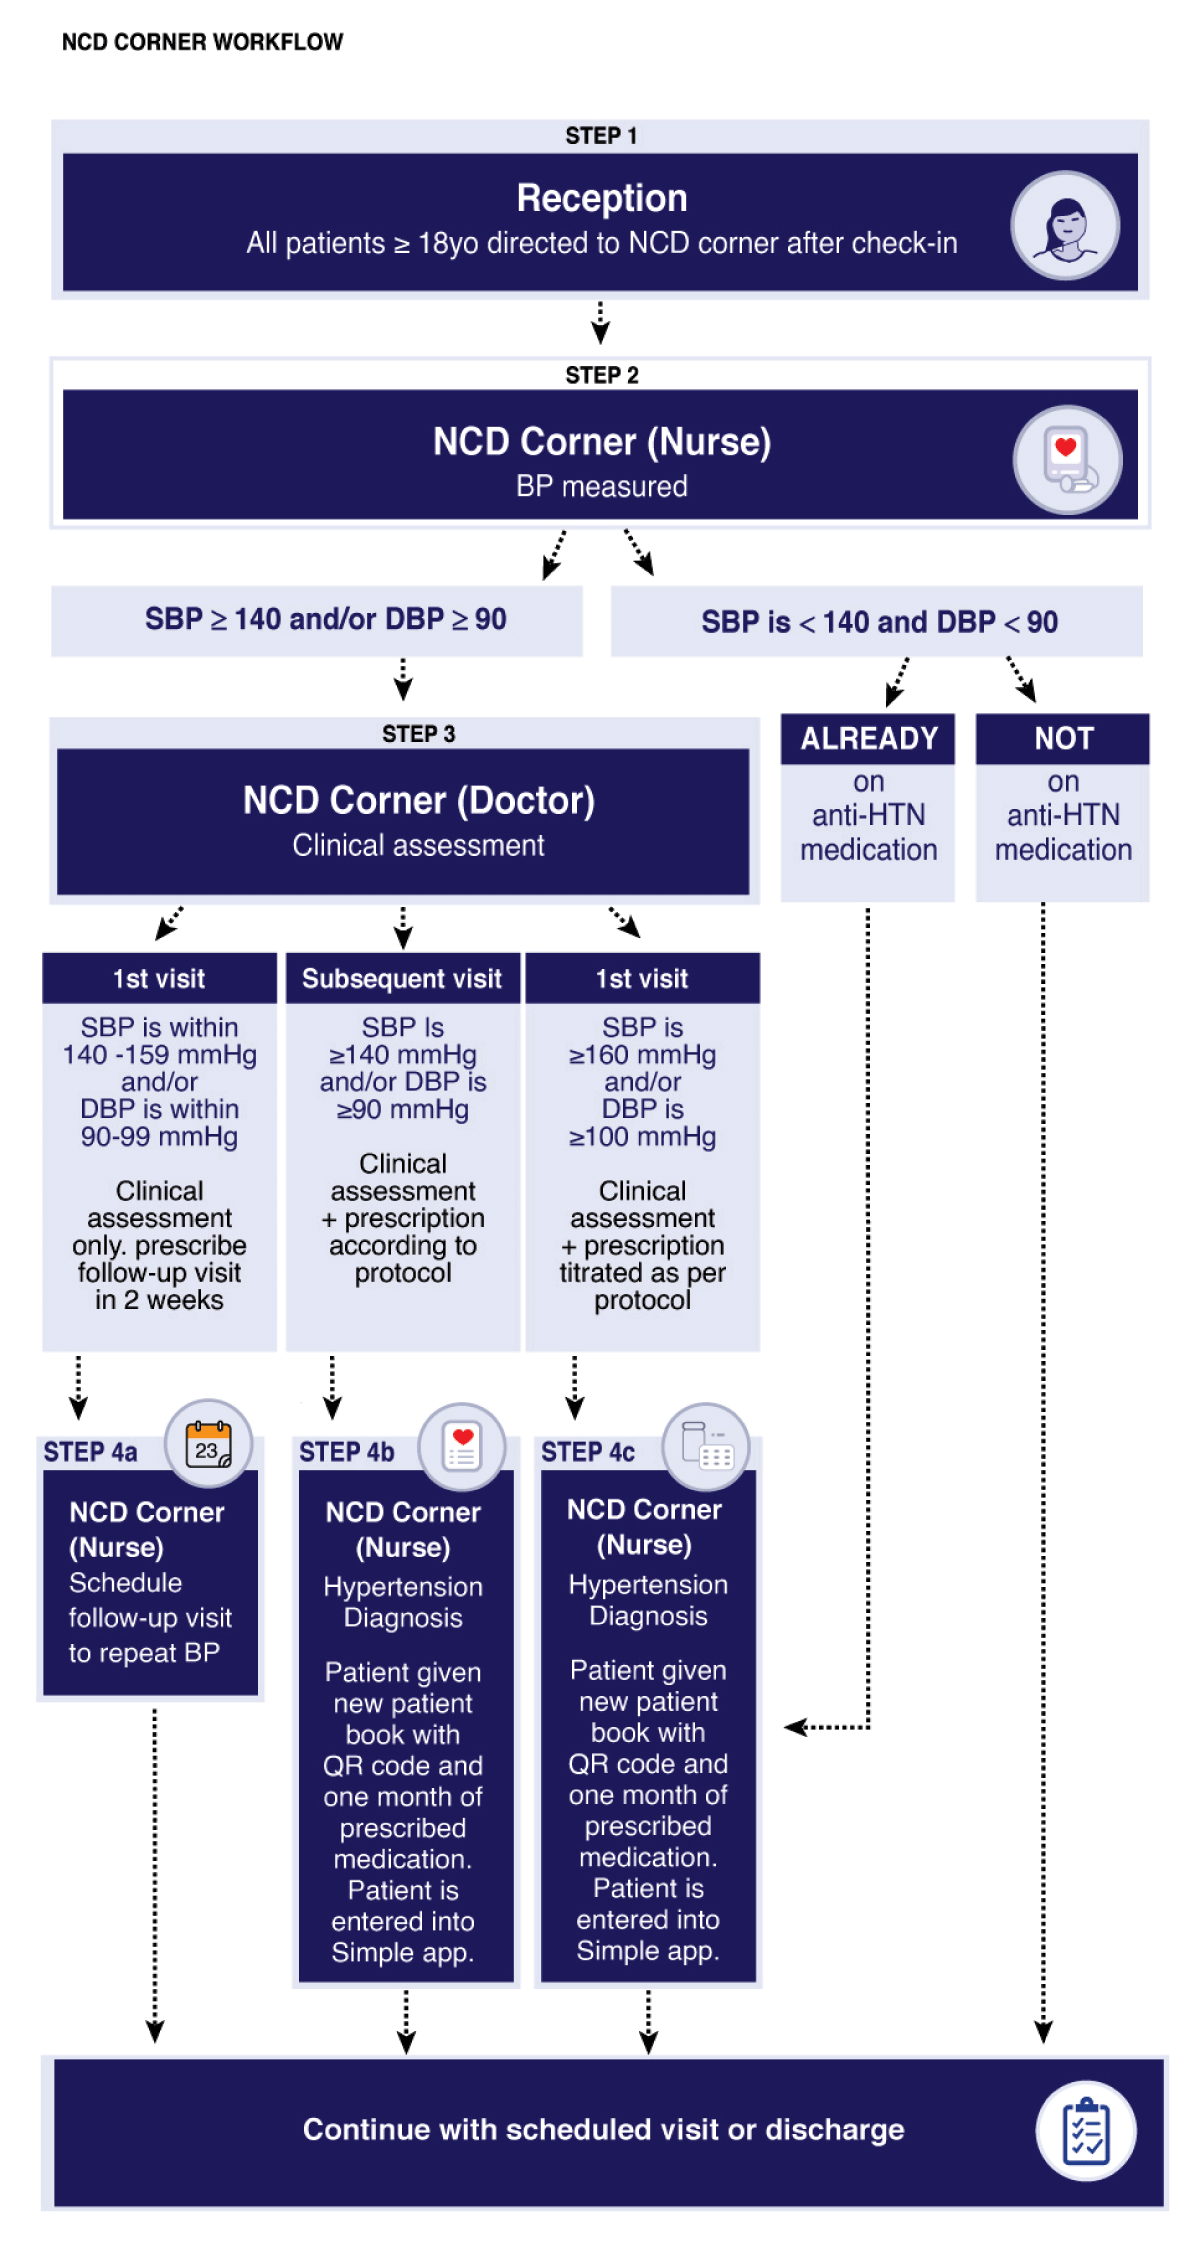
Figure 3
NCD Corner workflow for hypertension screening, diagnosis, treatment, and follow-up at the NCD Corner.
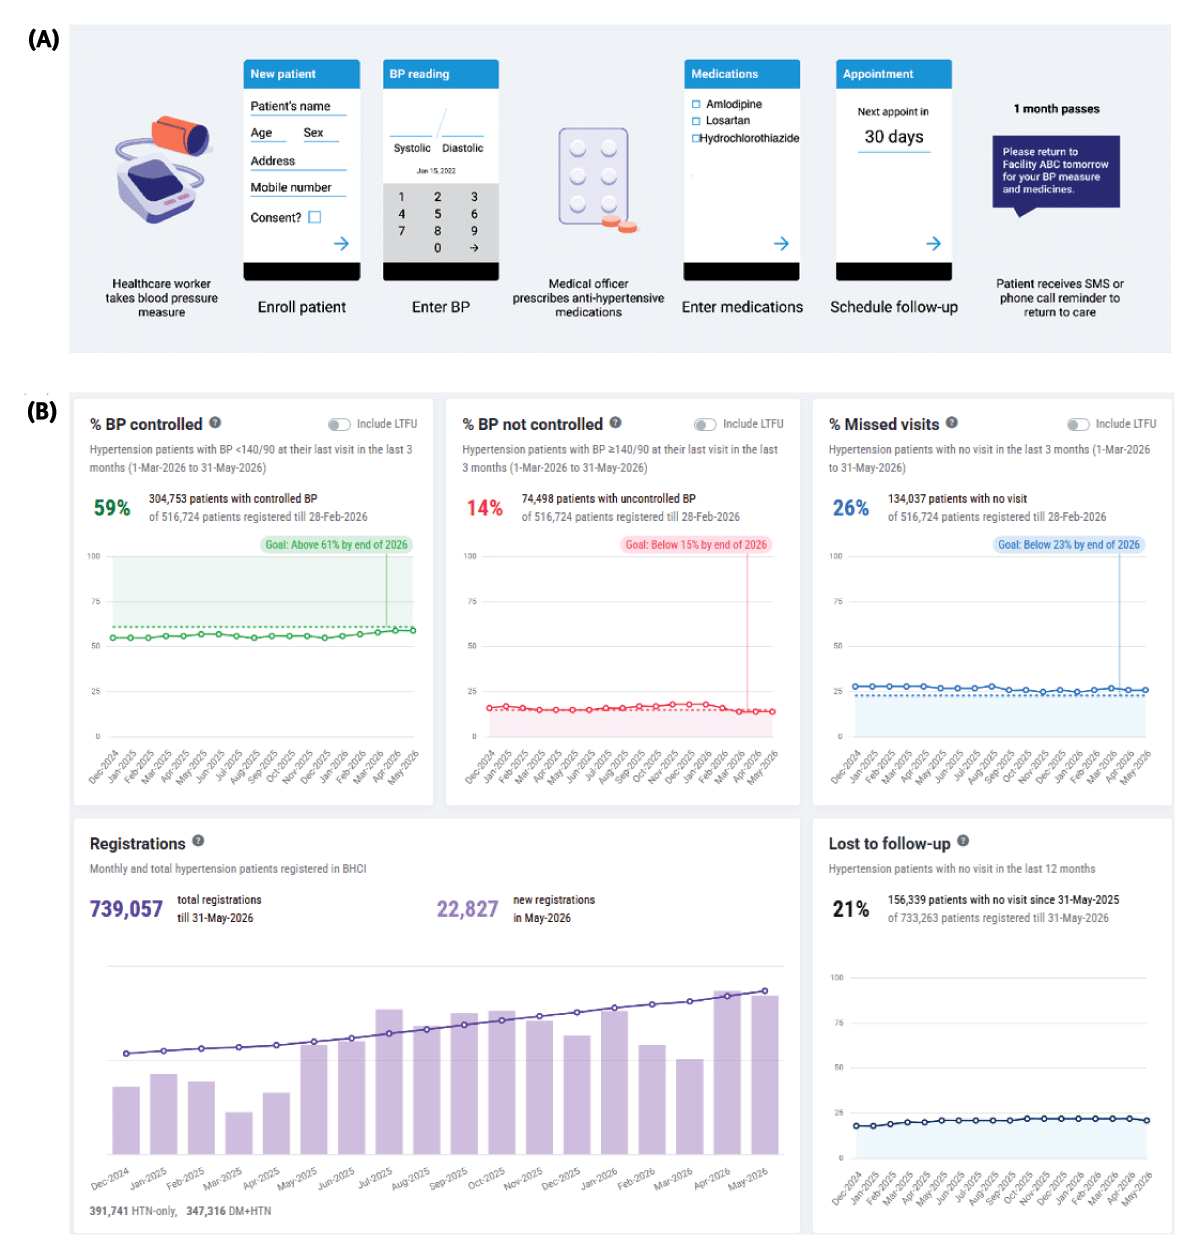
Figure 4
(A) Screenshots illustrating the Simple mobile app smartphone user interface; (B) Program-level dashboard for monitoring performance.
Table 3
BHCI quality improvement interventions and outcomes, July 2020–May 2026.
| INDICATORS | COUNTERMEASURES | ACTIVITIES | MEASURING TOOLS | OUTCOME |
|---|---|---|---|---|
| Control rate | Training for Health Service Providers (HSPs) | Training at District/UHC/CC level | Number of HSPs trained | BP control rate increased from 37% in July 2020 to 59% in April 2026 |
| Data sharing with HSP | QI meetings, data wall display | Number of QI meetings, number of facilities using data wall | ||
| Patient counseling by nurses | Advocacy with the nurses to counsel the patients accordingly | Observation | ||
| Reducing patient waiting time | Digital token box, NCD volunteer | Counting patient time starting from entry to exit at the facility | ||
| Therapeutic inertia/drug escalation | Simple app clinical decision support (CDS) alert, red sticker | Drug titration rate for patient visits with uncontrolled BP | ||
| Drug redistribution | From surplus facilities to stockout facilities | BHCI monthly update | ||
| Drug prediction tools development | Ongoing | Ongoing | ||
| Missed visits | Telephone calls to overdue patients | Field Monitoring Assistants (FMAs) called overdue patients through Simple app, establishment of NHFB centralized call center | Proportion of overdue patients called and returned to care each month | Missed visits reduced from 53% in July 2020 to 26% by May 2026 |
| Text messaging to overdue patients | Text sent to the patient’s registered phone number from Simple app | Number of text messages sent to the patients | ||
| Decentralizing care to CCs | CHCP training, patient assignment by nurses, patient assignment by FMAs | Number of eligible patients assigned to CCs, follow-up and control rate at CCs | ||
| Community engagement | Advocacy meeting with Union Chairs, Members, CG, and CSG | |||
| Universal screening | Instruction from ticket counter referring patients to NCD Corner | Number of patients registered through Simple app | ||
| Patient registration | Community awareness program | Advocacy meeting at Union parishad with community leaders | Number of meetings held in program areas | Total registrations increased from 12,749 in July 2020 to 739,057 (4% community coverage) by June 2026 |
| Community awareness program CHCP training | Advocacy meeting with CG/CSG | Number of meetings held in program areas | ||
| CC referral | Number of referred patients at NCD Corner | |||
| Media coverage | News coverage in electronic and print media | BHCI monthly program update | ||
| Day celebration | Health campaign, MMM | Data collection |
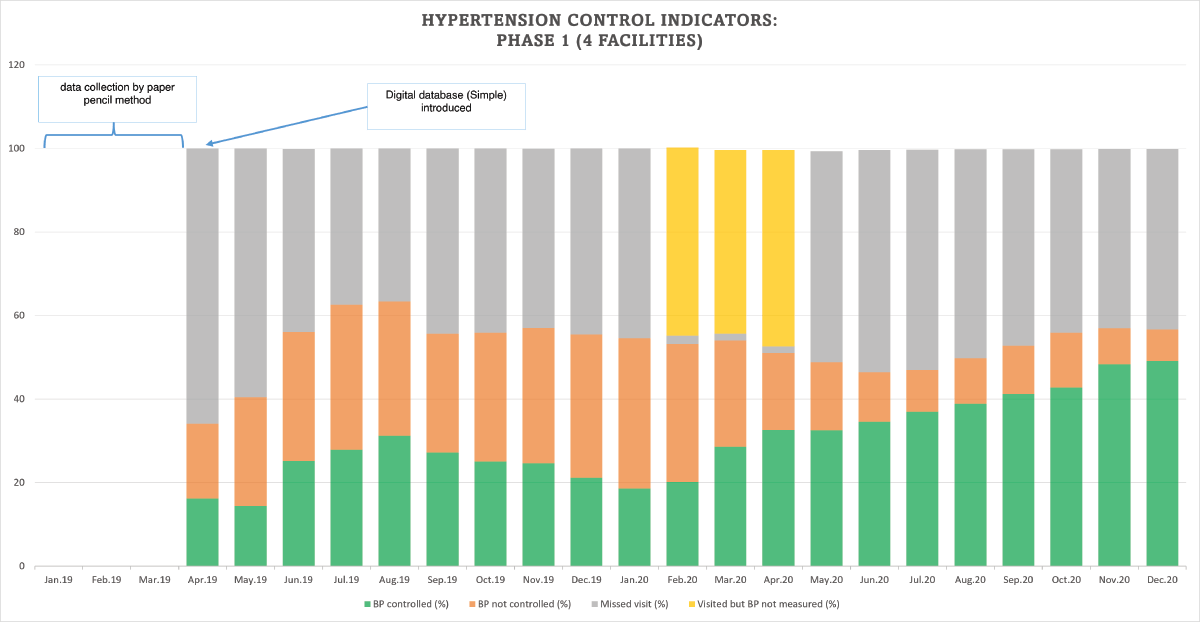
Figure 5
BHCI hypertension control performance indicator status at the end of phase 1.
* Before April 2019, patient records were maintained using paper-based records. In April 2019, a digital database (Simple) was introduced, which became the cornerstone for monitoring program indicators. From February 2020 to April 2020, BP could not be measured for all follow-up patients due to government-implemented COVID-related lockdowns. Patients visited health care facilities and refilled medicine without measuring their BP.
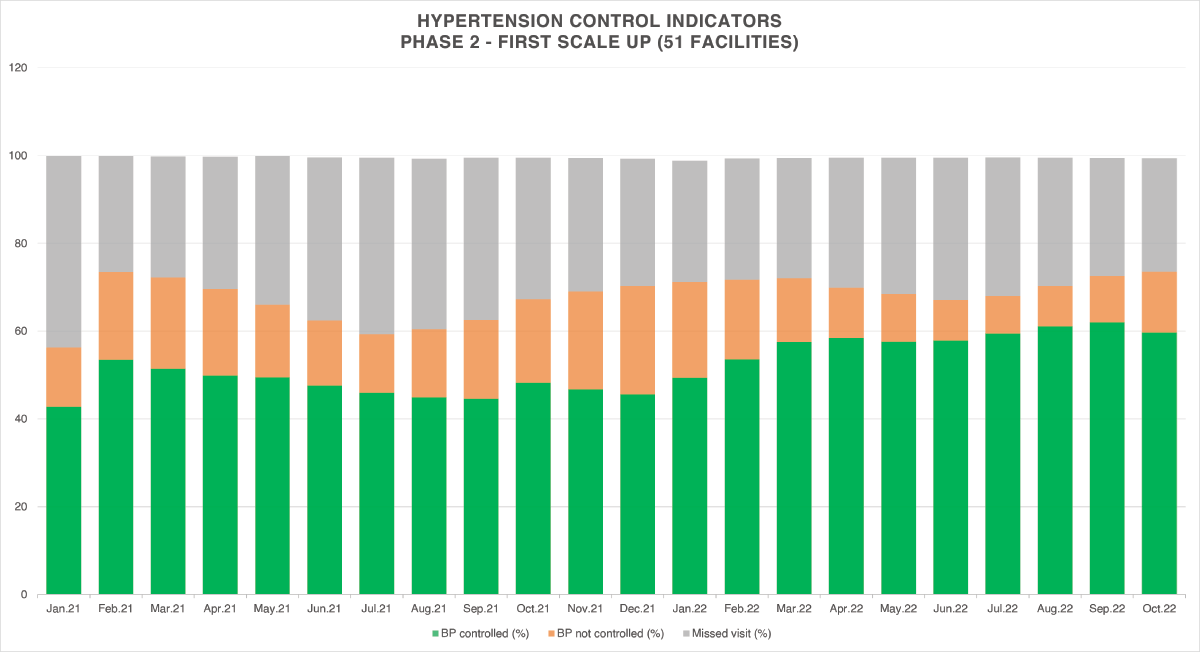
Figure 6
BHCI hypertension control indicator status at the end of phase 2.
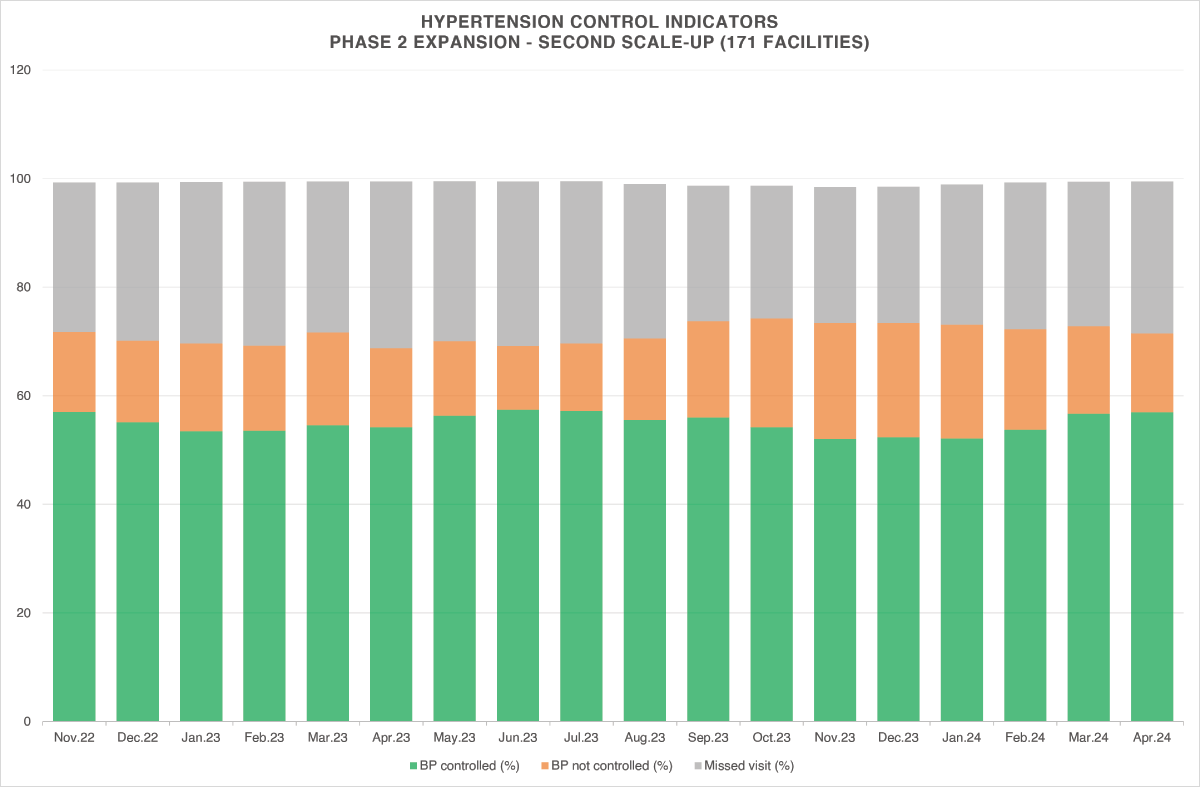
Figure 7
BHCI hypertension control indicator status through December 2024.
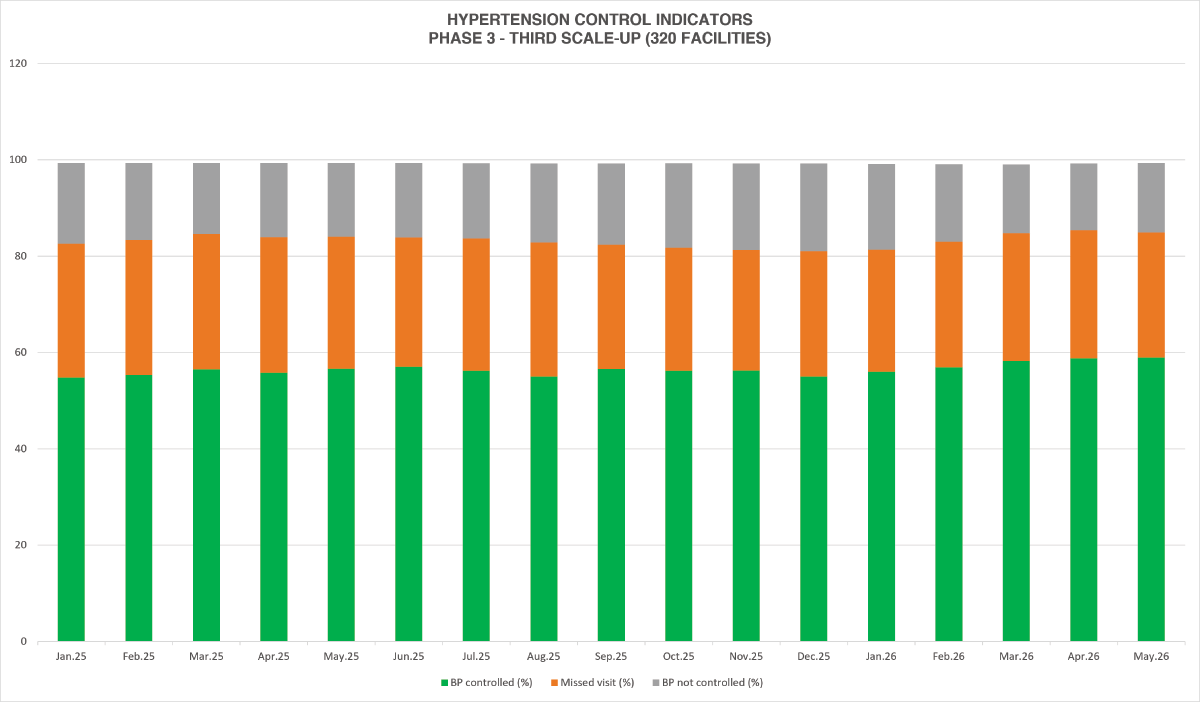
Figure 8
BHCI hypertension control indicator status through May 2026.
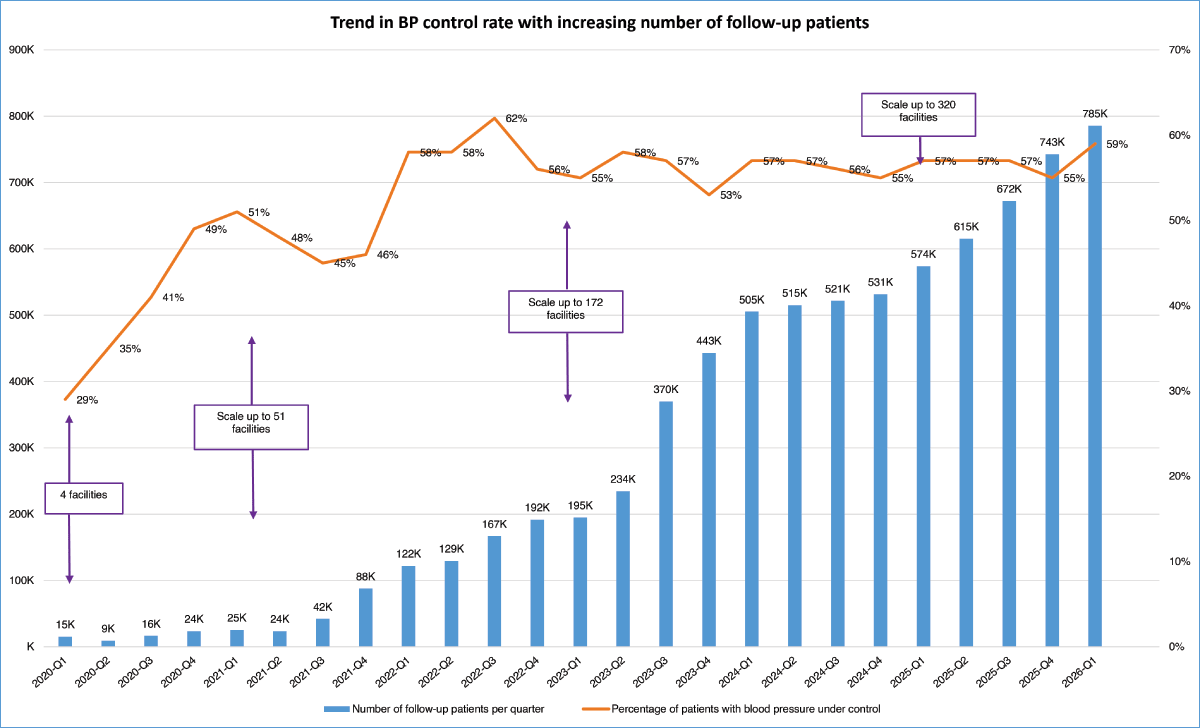
Figure 9
Trend in BP control rate with increasing number of patients being treated.