
Table 1
Patients admitted to BMC with heart failure during 2023 (n = 177).
| OVERALL (n = 177) | SURVIVED INDEX ADMISSION (n = 154) | DIED DURING INDEX ADMISSION (n = 23) | P-value* | |
|---|---|---|---|---|
| Age (years) | 61.0 (45.9, 72.8) | 61.6 (47.7, 72.1) | 58.0 (25.0, 76.0) | 0.37 |
| Female [ref: male] | 90 (50.8%) | 83 (53.9%) | 7 (30.4%) | 0.04 |
| Self-pay [ref: insured] | 106 (59.9%) | 92 (59.7%) | 14 (60.9%) | 0.92 |
| New heart failure diagnosis [ref: established diagnosis] | 141 (79.7%) | 126 (81.8%) | 15 (65.2%) | 0.089 |
| LV ejection fraction (%) | 40 (29.0, 55.0) | 40.0 (29.0, 55.0) | 35.0 (29.0, 59.5) | 0.80 |
| No echo completed | 21 (11.9%) | 13 (8.4%) | 8 (34.8%) | 0.70 |
| HFpEF: LV EF > 50% | 48 (27.1%) | 44 (28.6%) | 4 (17.4%) | |
| HFmrEF: LV EF 41–49% | 22 (12.4%) | 21 (13.6%) | 1 (4.3%) | |
| HFrEF: LV EF < 40% | 86 (48.6%) | 76 (49.4%) | 10 (43.5%) | |
| Comorbidities | ||||
| HTN | 83 (46.9%) | 77 (50.0%) | 6 (26.1%) | 0.04 |
| Diabetes | 32 (18.1%) | 30 (19.5%) | 2 (8.7%) | 0.26 |
| Atrial fibrillation or flutter | 31 (17.5%) | 24 (15.6%) | 7 (30.4%) | 0.14 |
| HIV | 6 (3.4%) | 4 (2.6%) | 2 (8.7%) | 0.18 |
| Laboratory data on admission | ||||
| Kidney function: eGFR (mL/min/1.73 m²) | 51.8 (31.6, 74.0) | 53.4 (34.3, 76.4) | 45.4 (20.3, 55.9) | 0.06 |
| eGFR not measured | 13 (7.3%) | 11 (7.1%) | 2 (8.7%) | 0.06 |
| CKD Stage 1 and 2 (eGFR > 60 mL/min/1.73 m²) | 62 (35.0%) | 58 (37.7%) | 4 (17.4%) | |
| CKD Stage 3 (eGFR 30–59 mL/min/1.73 m²) | 62 (35.0%) | 54 (35.1%) | 8 (34.8%) | |
| CKD Stage 4 (eGFR 15–29 mL/min/1.73 m²) | 24 (13.6%) | 20 (13.0%) | 4 (17.4%) | |
| CKD Stage 5 (eGFR <15 mL/min/1.73 m²) | 16 (9.0%) | 11 (7.1%) | 5 (21.7%) | |
| Hemoglobin (mg/dL) | 12.1 (10.4, 13.5) | 12.1 (10.5, 13.4) | 12.3 (10.2, 13.8) | 0.97 |
| Hb not measured | 10 (5.6%) | 9 (5.8%) | 1 (4.3%) | 0.58 |
| Normal or mild anemia: (Hb > 11 mg/dL) | 115 (65.0%) | 101 (65.6%) | 14 (60.9%) | |
| Moderate anemia: (Hb: 8–10.9 mg/dL) | 44 (24.9%) | 38 (24.7%) | 6 (26.1%) | |
| Severe anemia: (Hb < 8.0 mg/dL) | 8 (4.5%) | 6 (3.9%) | 2 (8.7%) |
[i] *P-values derived from Fisher’s exact test for categorical variables and Wilcoxon rank-sum for continuous variables.
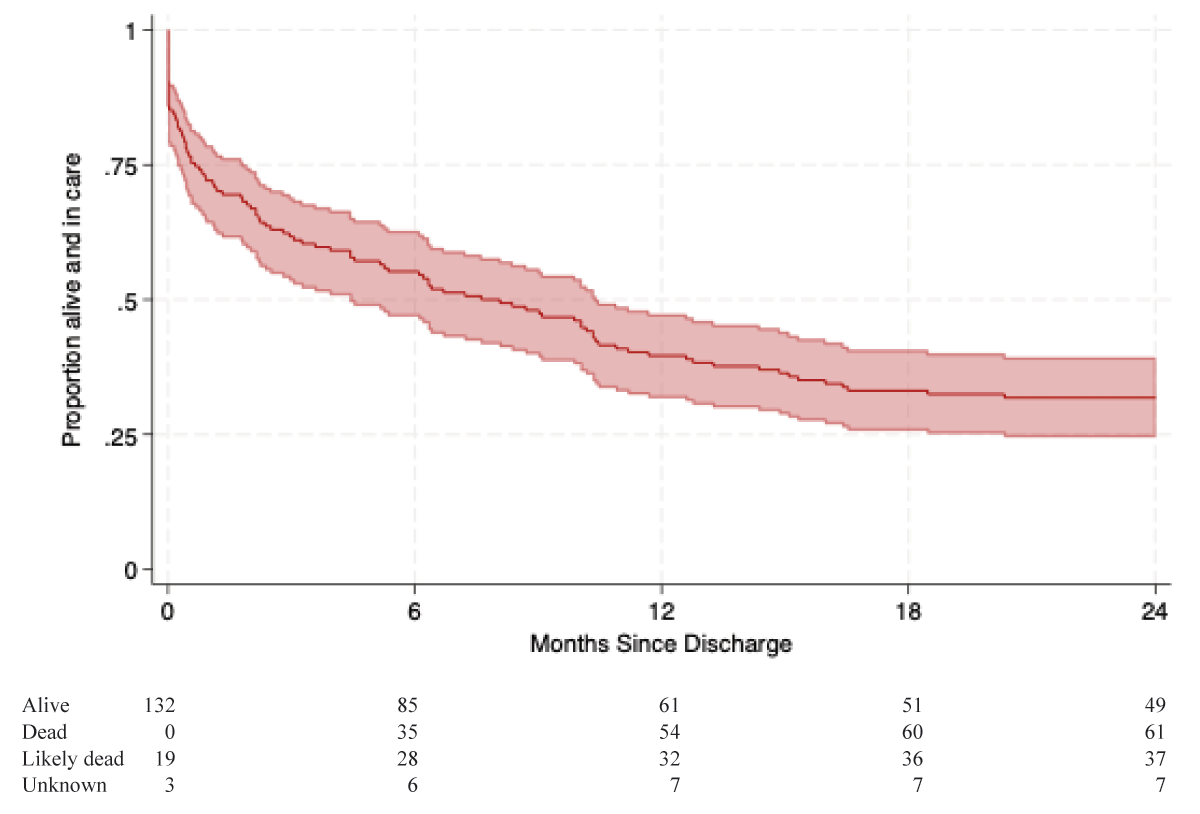
Figure 1
Post-hospital survival for patients alive at the time of discharge from index admission (n = 154).
Kaplan-Meier curve demonstrating the proportion of patients alive and in care following discharge from the index hospitalization. For patients who were not reachable by phone and out of care for at least 3 months, likely vital status was determined by two members of the study team who independently reviewed all available data and categorized as “likely dead” or “unknown”. Disagreements were adjudicated by a third reviewer.
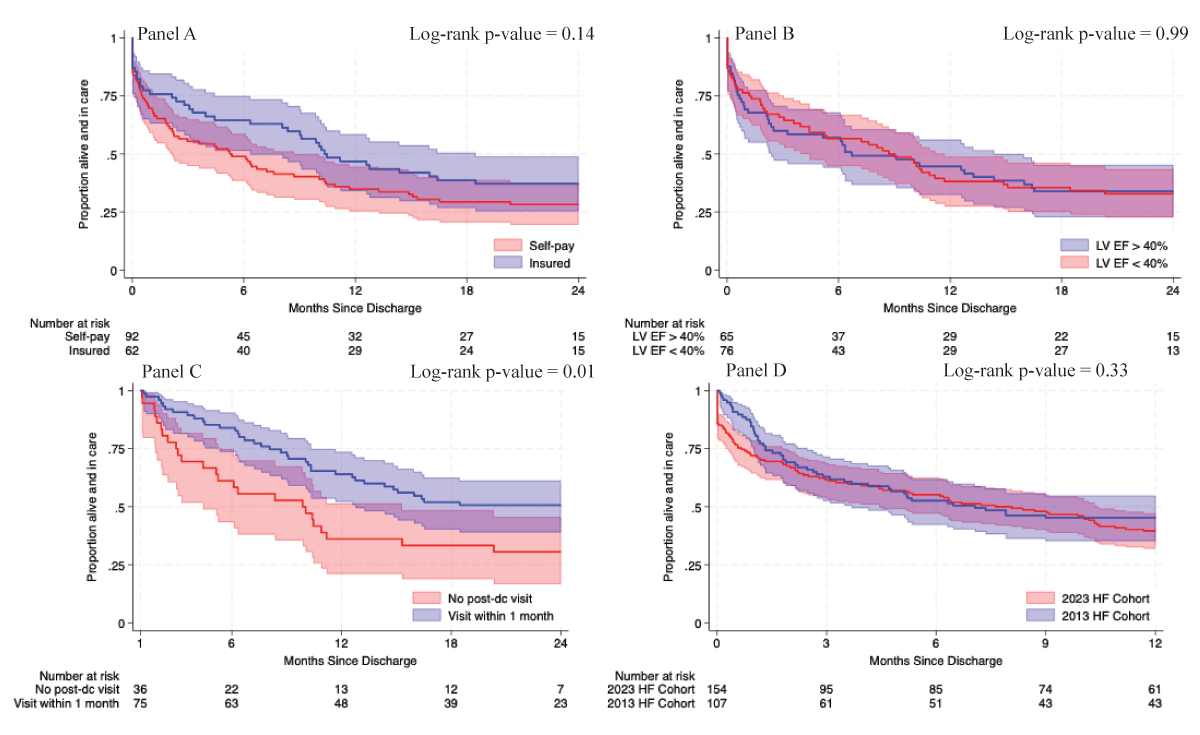
Figure 2
Post-hospital survival by key exposures.
Time to all cause mortality after hospital discharge by key exposures including: insurance status (Panel A), ejection fraction (Panel B), and follow up within the first month after discharge among the 111 patients who survived at least one month after the index hospitalization (Panel C). Of note, every patient is scheduled for post-discharge (post-dc) follow up within 2 weeks of hospital discharge. In Panel D, we compare the data from the 2023 HF Cohort to data from a historical HF Cohort that collected data in 2013.
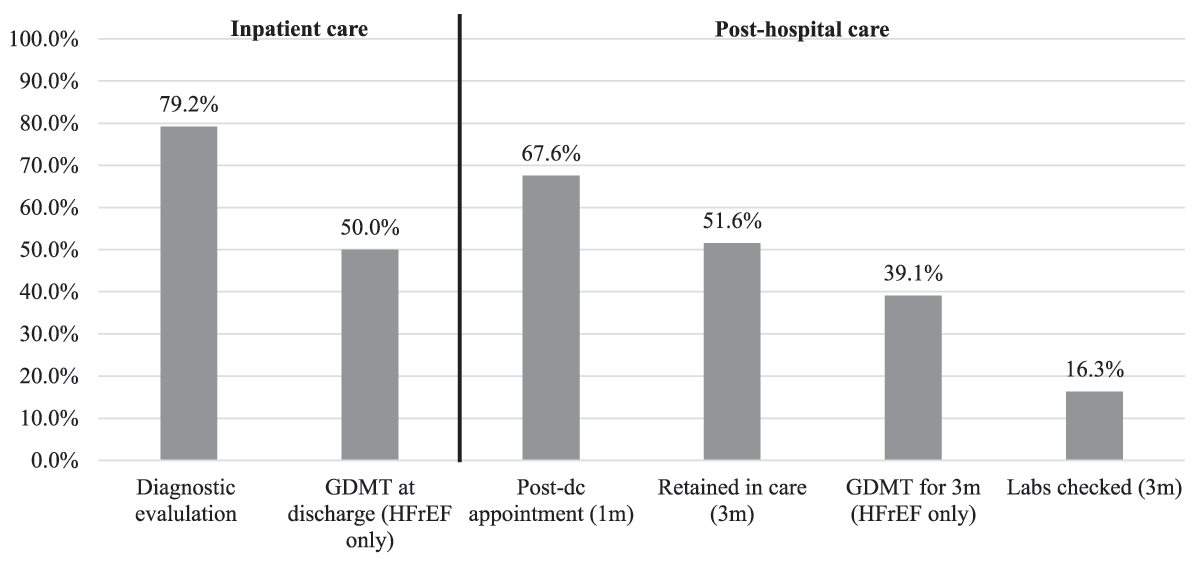
Figure 3
Gaps in delivery of quality heart failure care.
This figure displays the proportion of patients that received each step of quality heart failure care described by PEN-plus guidelines.
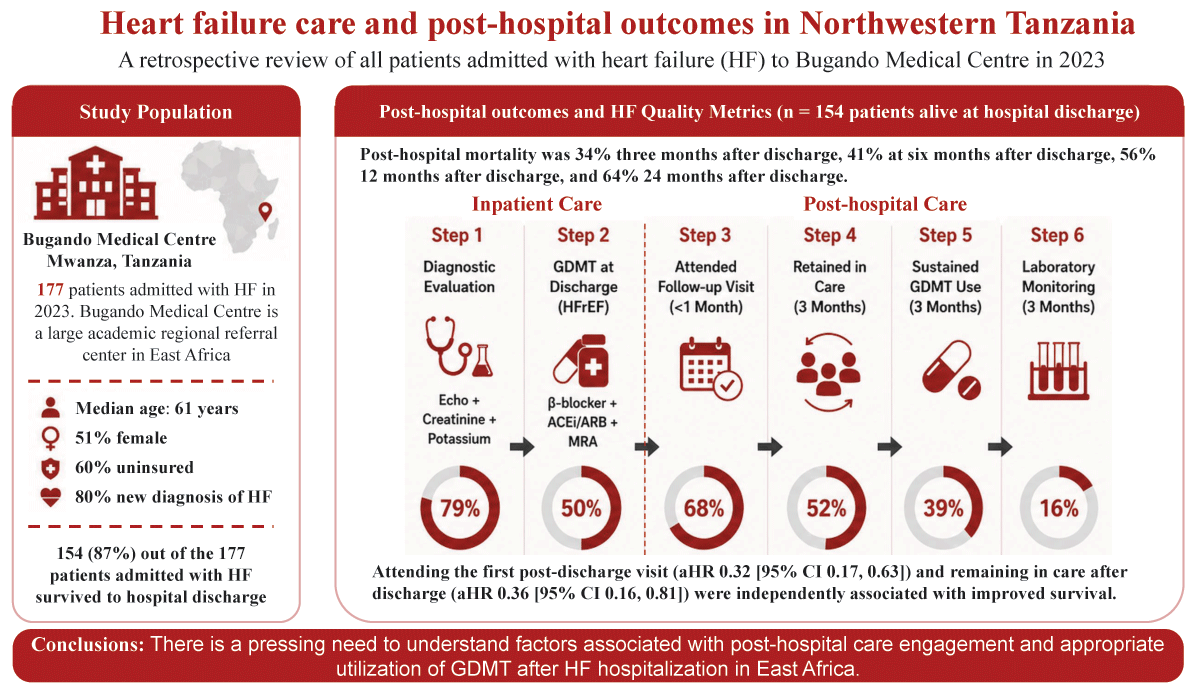
Step 1: proportion of patients who underwent guideline-directed testing, including measurement of serum creatinine and potassium and an echo during or prior to hospitalization (out of 154 patients who survived to discharge).
Step 2: proportion of HFrEF patients prescribed appropriate GDMT at time of discharge (out of 76 HFrEF patients who survived to discharge).
Step 3: proportion of patients who attended their scheduled outpatient visit within the first month after discharge (out of the 111 patients who survived at least a month after discharge).
Step 4: proportion of patients who were retained in care for 3 months after discharge (out of the 95 patients who survived at least 3 months after discharge).
Step 5: proportion of HFrEF patients on appropriate GDMT at each clinic visit in the first three months after discharge (out of 23 HFrEF patients retained in care at 3 months).
Step 6: proportion of patients, who had labs checked (out of the 49 patients who were retained in care at 3 months).
Table 2
Gaps in heart failure care and post-hospital survival. The adjusted hazard ratios presented were derived by running a multivariable Cox regression model for each element of the heart failure care continuum, adjusted for age, sex, insurance status, timing of heart failure diagnosis, HFrEF, hypertension, diabetes, atrial fibrillation or flutter, CKD, and anemia. These same variables were used in the adjusted base models shown in Supplemental Table 1. The adjusted model for Step 1 was not adjusted for HFrEF, CKD, and anemia, as these were collinear with the exposure of interest. Participants who could not be reached by phone and were out of care for at least 3 months were handled as follows in each model:
| MODEL 1 | MODEL 2 | MODEL 3 | ||
|---|---|---|---|---|
| UNADJUSTED HR | ADJUSTED HR [95% CI] | ADJUSTED HR [95% CI] | ADJUSTED HR [95% CI] | |
| Step 1: Diagnostic evaluation before discharge (n = 154 patients who survived to discharge) | 1.19 [0.64, 2.23] | 1.27 [0.66, 2.41]* | 1.08 [0.63, 1.87]* | 1.12 [0.65, 1.94]* |
| Step 2: GDMT at discharge (n = 76 HFrEF patients who survived to discharge) | 1.17 [0.58, 2.34] | 0.98 [0.42, 2.30] | 1.00 [0.48, 2.10] | 1.06 [0.51, 2.21] |
| Step 3: Attended post-discharge appointment within one month (n = 111 patients who survived at least one month) | 0.42 [0.24, 0.73] | 0.32 [0.17, 0.63]* | 0.50 [0.29, 0.89] | 0.51 [0.29, 0.90] |
| Step 4: Retained in care for the first three months after discharge (n = 95 patients who survived at least three months) | 0.43 [0.22, 0.85] | 0.36 [0.16, 0.81] | 0.50 [0.26, 0.98] | 0.49 [0.25, 0.96] |
| Step 5 and 6: We did not evaluate the association of GDMT for three months or repeating labs within the first three months of discharge (e.g., safety monitoring) and survival due to the limited sample size. | ||||
[i] Model 1: Censored at the time of their last contact with the health care system.
Model 2: Vital status adjudicated by the study team.
Model 3: Assumed to be dead.
*In all but these four models, the Grambsch-Therneau test results supported the proportionality assumption (p > 0.05). For the remaining four models, the global test indicated evidence of non-proportionality driven primarily by the primary exposure (p < 0.05), but residual plots demonstrated that the log-minus-log curves did not cross one another, indicating that departures from proportionality were modest. For these models, the reported hazards ratio is interpreted as a weighted average of the time-varying hazards ratio over follow-up, rather than a constant effect. Models incorporating time-varying exposure interaction yielded consistent qualitative findings; primary proportional hazards ratio models are presented for clarity and parsimony.
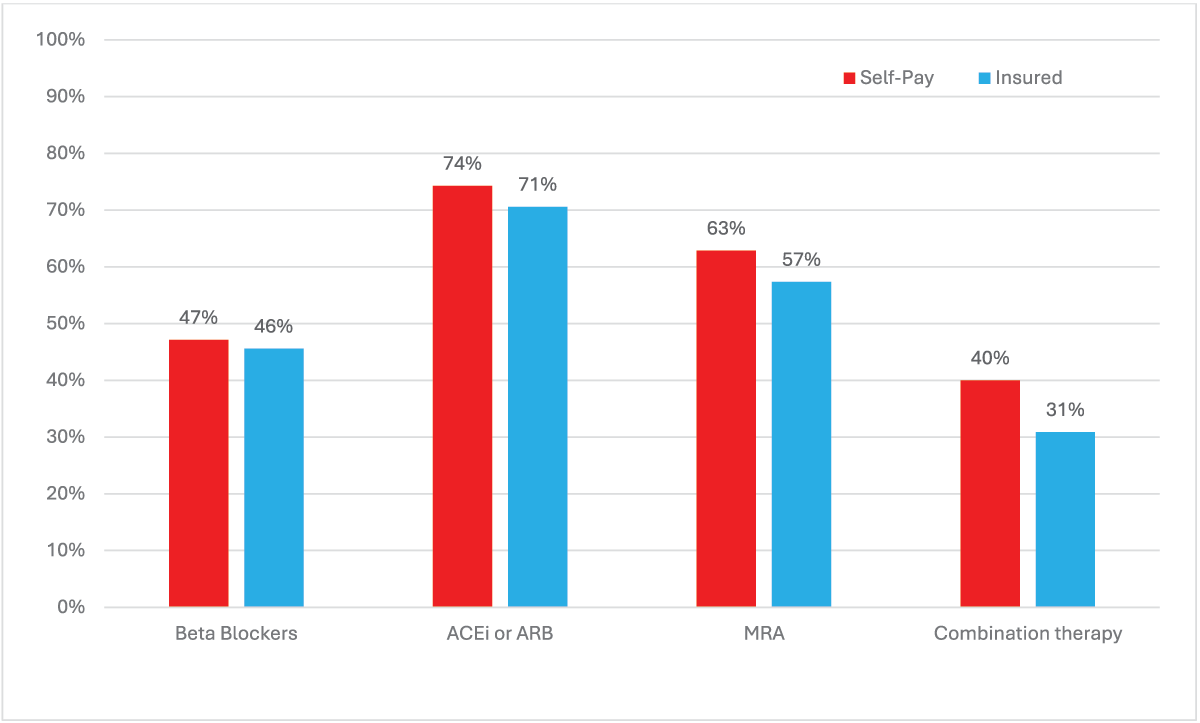
Figure 4a
GDMT use for 76 patients with HFrEF at Hospital Discharge (n = 136 discharges*).
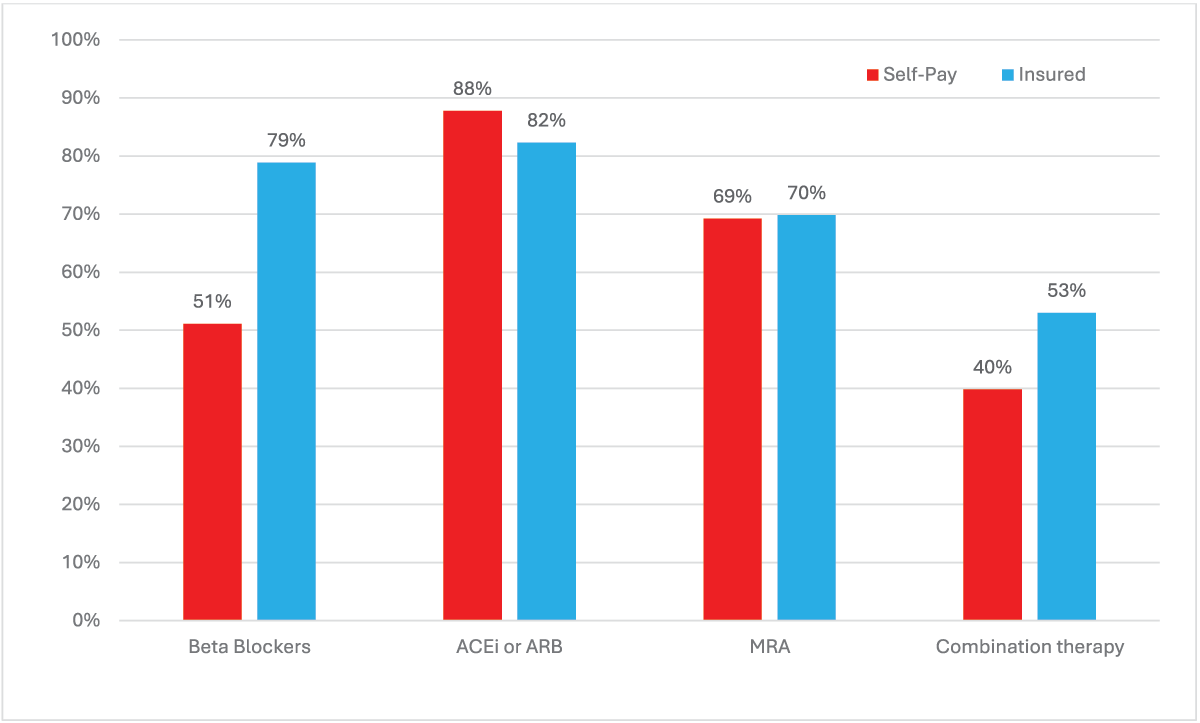
Figure 4b
GDMT use for 76 patients with HFrEF at Outpatient Clinic Visits (n = 453 clinic visits).
Figure 4 describes GDMT use across all discharges and outpatient clinic visits for 76 participants with HFrEF who survived to hospital discharge (33 insured patients; 43 self-pay patients). Each class of medication was considered appropriately used if it was dispensed at the pharmacy or if there was a documented contraindication to a particular class of medications as detailed in the PEN-Plus heart failure guidelines (e.g. bradycardia for beta blockers or severe renal dysfunction for ACEi or ARBs).
*Data from 136 discharges derived from 76 discharges from the index admission and 60 heart failure related readmissions.
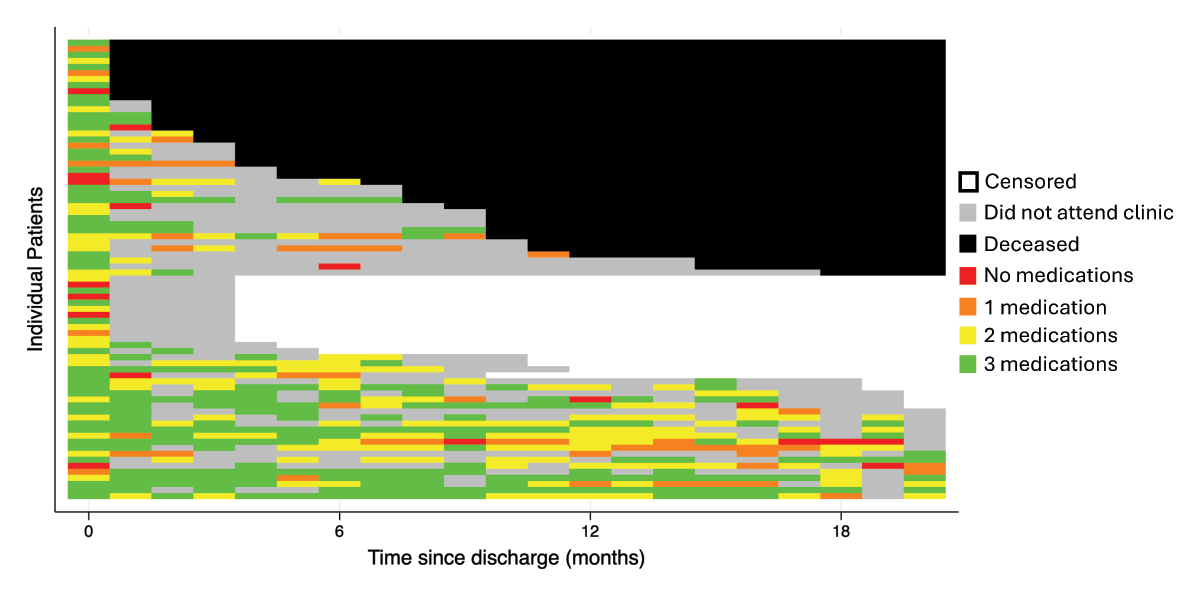
Figure 5
Heatmap of GDMT use for HFrEF patients (n = 76).
Heatmap showing utilization of GDMT among patients with HFrEF who survived to hospital discharge; all participants had at least 20 possible months of follow up between discharge and the end of the study period. Each row represents an individual patient and each column one additional month of follow up, with the first column representing hospital discharge. The number of medications indicates the number of heart failure drug classes prescribed (beta-blocker, ACEi/ARB, MRA). For example, “3 medications” indicates all three classes were prescribed. Patients were considered deceased if they were confirmed dead or likely dead during adjudication. Patients were censored after the last known encounter if they missed three consecutive visits.