
Figure 1
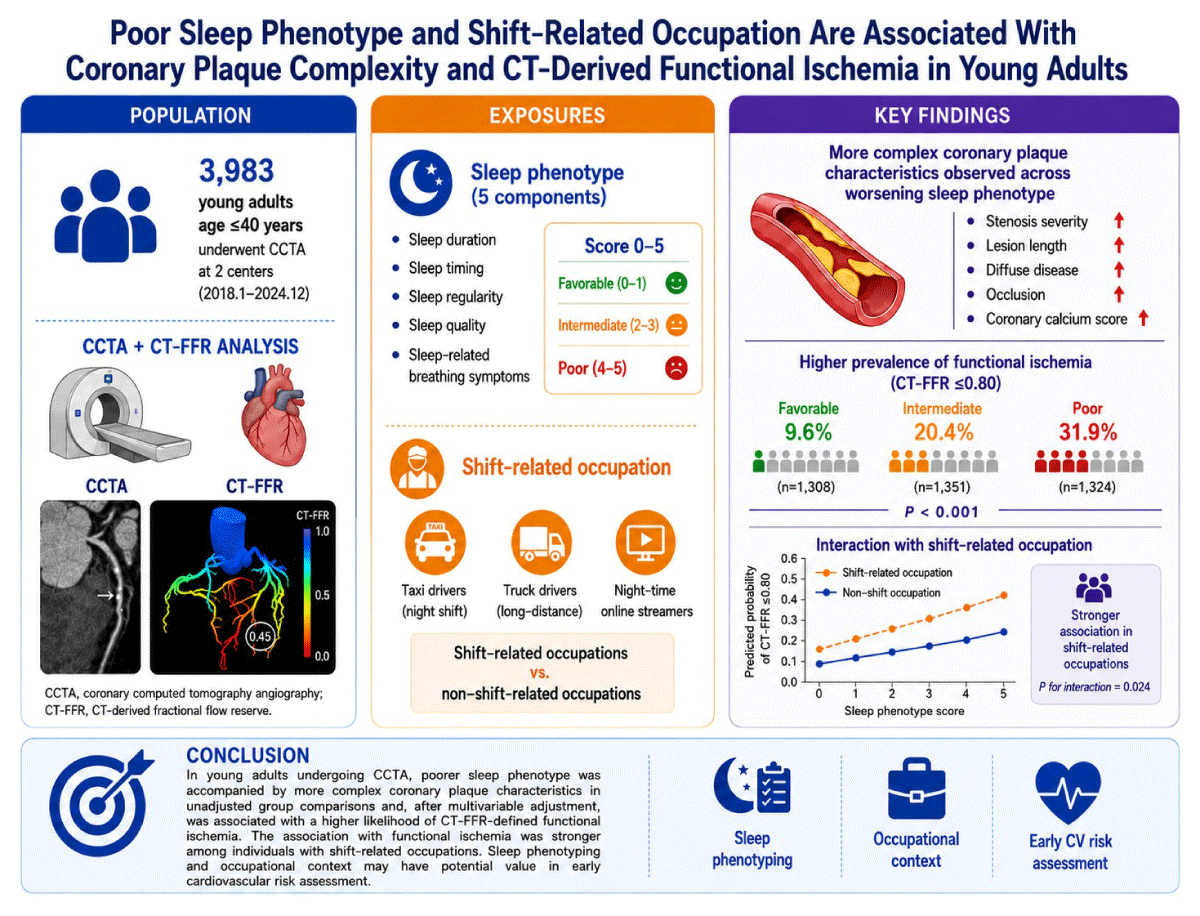
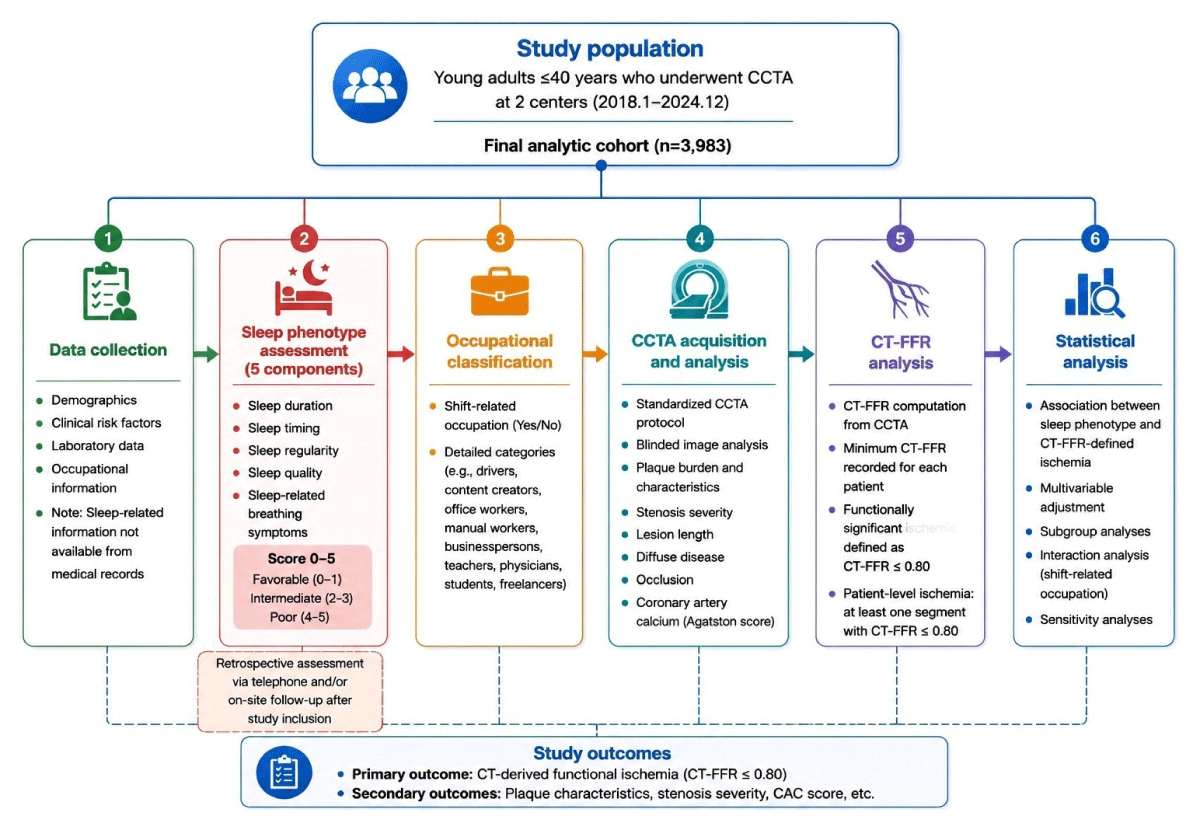
Study flowchart. CCTA, coronary computed tomography angiography; CT-FFR, computed tomography-derived fractional flow reserve.
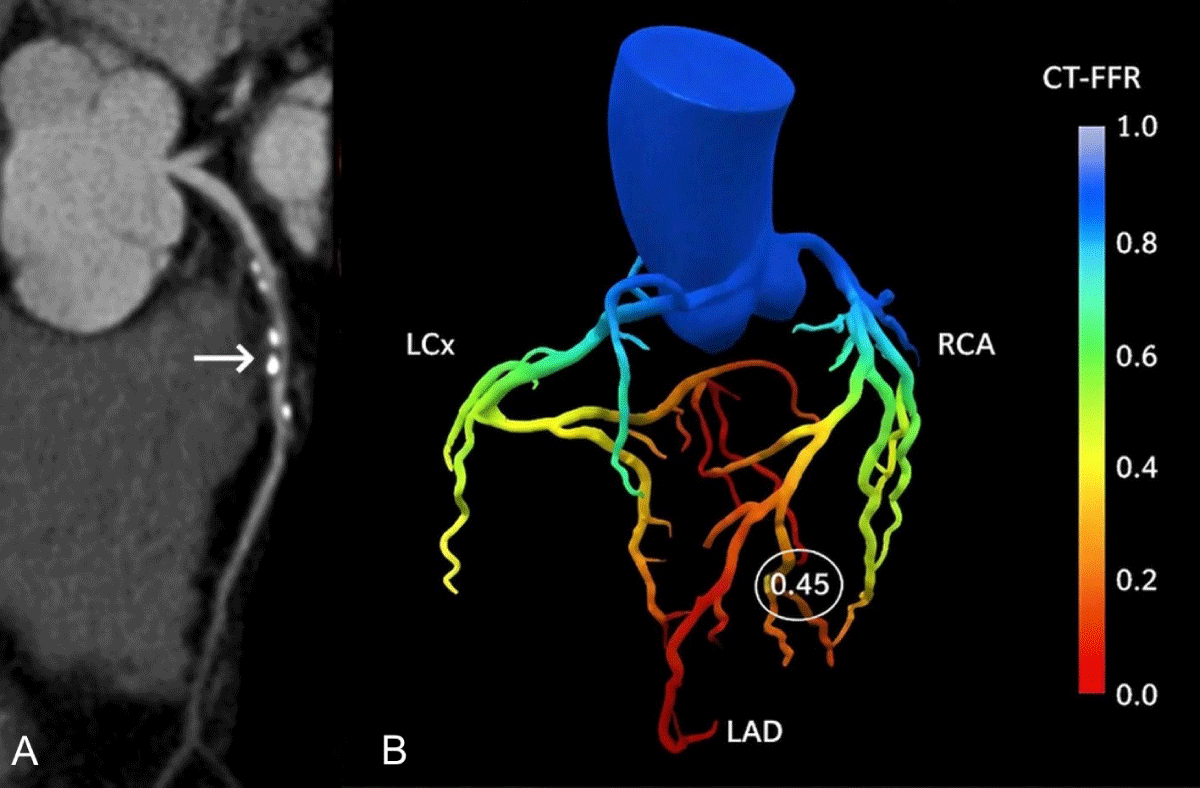
Figure 2
Representative case of CT-derived fractional flow reserve (CT-FFR) analysis. (A) Curved multiplanar reconstruction of coronary CT angiography shows a mixed plaque causing intermediate stenosis in the mid-left anterior descending artery (LAD) (arrow). (B) Three-dimensional CT-FFR model demonstrates a hemodynamically significant lesion in the mid-LAD with a CT-FFR value of 0.45 (circled), while other coronary segments show higher CT-FFR values.
Table 1
Baseline characteristics stratified by sleep phenotype.
| VARIABLE | FAVORABLE SLEEP (n = 1308) | INTERMEDIATE SLEEP (n = 1351) | POOR SLEEP (n = 1324) | P-VALUE |
|---|---|---|---|---|
| Age (years) | 29.94 ± 6.06 | 29.93 ± 6.07 | 30.07 ± 6.14 | 0.795 |
| Male sex, n (%) | 845 (64.6%) | 928 (68.7%) | 953 (72.0%) | <0.001 |
| BMI (kg/m²) | 25.87 ± 3.22 | 25.96 ± 3.14 | 25.96 ± 3.15 | 0.705 |
| Smoking, n (%) | 795 (60.8%) | 785 (58.1%) | 797 (60.2%) | 0.333 |
| Hypertension, n (%) | 866 (66.2%) | 873 (64.6%) | 887 (67.0%) | 0.418 |
| Diabetes, n (%) | 18 (1.4%) | 11 (0.8%) | 15 (1.1%) | 0.220 |
| Dyslipidemia, n (%) | 869 (66.4%) | 852 (63.1%) | 865 (65.3%) | 0.177 |
| Total cholesterol (mmol/L) | 4.52 ± 0.80 | 4.52 ± 0.82 | 4.48 ± 0.80 | 0.344 |
| LDL-C (mmol/L) | 3.02 ± 1.13 | 3.02 ± 1.08 | 3.01 ± 1.09 | 0.907 |
| HDL-C (mmol/L) | 1.31 ± 0.50 | 1.29 ± 0.50 | 1.30 ± 0.50 | 0.801 |
| Triglyceride (mmol/L) | 2.25 ± 0.93 | 2.24 ± 0.93 | 2.23 ± 0.92 | 0.818 |
| HbA1c (%) | 6.52 ± 1.60 | 6.49 ± 1.58 | 6.47 ± 1.62 | 0.676 |
| hs-CRP (mg/L) | 11.54 ± 2.76 | 11.53 ± 2.85 | 11.40 ± 2.79 | 0.346 |
| Uric acid (μmol/L) | 458.33 ± 31.26 | 458.06 ± 30.89 | 457.42 ± 30.84 | 0.744 |
[i] Mean values ± standard deviation, median (interquartile range), and n (%) were reported for variables, respectively. BMI, body mass index; HDL, high density lipoprotein; HbA1c, glycosylated hemoglobin; hs-CRP, high-sensitivity C-reactive protein; LDL, low-density lipoprotein.
Table 2
Coronary CTA characteristics according to sleep phenotype.
| VARIABLE | FAVORABLE SLEEP (n = 1308) | INTERMEDIATE SLEEP (n = 1351) | POOR SLEEP (n = 1324) | P-VALUE |
|---|---|---|---|---|
| Degree of stenosis (%) | 34.2 ± 18.6 | 42.8 ± 21.4 | 51.6 ± 24.3 | <0.001 |
| Minimum lumen area (mm²) | 10.8 ± 4.2 | 8.6 ± 3.7 | 6.9 ± 3.1 | <0.001 |
| Lesion length (mm) | 11.2 ± 6.1 | 15.6 ± 8.4 | 21.3 ± 10.7 | <0.001 |
| Diffuse lesion, n (%) | 118 (9.0%) | 296 (21.9%) | 547 (41.3%) | <0.001 |
| Occlusion, n (%) | 22 (1.7%) | 61 (4.5%) | 132 (10.0%) | <0.001 |
| Calcium volume (mm3) | 18.4 (0–42.6) | 21.6 (0–58.3) | 24.9 (0–71.4) | 0.071 |
| CACS (Agatston) | 5.2 (0–38.1) | 8.9 (0–64.2) | 14.6 (0–102.5) | <0.001 |
| Mean calcium attenuation (HU) | 612 ± 164 | 655 ± 181 | 701 ± 196 | <0.001 |
| CT-FFR ≤ 0.80, n (%) | 126 (9.6%) | 276 (20.4%) | 422 (31.9%) | <0.001 |
[i] Mean values ± standard deviation, median (interquartile range), and n (%) were reported for variables, respectively. CTA, coronary computed tomography angiography; CACS, coronary artery calcification score; FFR, fractional flow reserve.
Table 3
Multivariable logistic regression analysis outcome: CT-FFR ≤ 0.80.
| VARIABLE | ADJUSTED OR (95% CI) | P-VALUE |
|---|---|---|
| Sleep phenotype score, per 1-point increase | 1.38 (1.12–1.71) | 0.003 |
| Shift-related occupation | 1.67 (1.21–2.30) | 0.002 |
| Age, per year | 1.01 (0.99–1.02) | 0.284 |
| Male sex | 1.12 (0.85–1.48) | 0.421 |
| Smoking | 1.19 (0.91–1.56) | 0.204 |
| BMI, per kg/m² | 1.03 (0.99–1.07) | 0.118 |
| Hypertension | 1.09 (0.82–1.45) | 0.561 |
| Diabetes | 1.36 (1.02–1.82) | 0.037 |
| Dyslipidemia | 1.08 (0.81–1.44) | 0.602 |
[i] CT-FFR, computed tomography-derived fractional flow reserve; OR, odds ratio; CI, confidence interval; BMI, body mass index.
The multivariable model was adjusted simultaneously for age, sex, BMI, smoking, hypertension, diabetes, dyslipidemia, sleep phenotype score, and shift-related occupation.
Table 4
Incremental value analysis.
| MODEL | AUC (95% CI) | ΔAUC | P-VALUE | NRI (95% CI) | P-VALUE | IDI (95% CI) | P-VALUE |
|---|---|---|---|---|---|---|---|
| Clinical model | 0.562 (0.544–0.580) | Reference | — | Reference | — | Reference | — |
| Clinical + sleep phenotype | 0.675 (0.658–0.692) | 0.113 | <0.001 | 0.212 (0.156–0.268) | <0.001 | 0.046 (0.031–0.061) | <0.001 |
| Clinical + CCTA variables | 0.738 (0.722–0.754) | 0.176 | <0.001 | 0.348 (0.291–0.405) | <0.001 | 0.083 (0.064–0.102) | <0.001 |
| Full model | 0.748 (0.732–0.764) | 0.185 | <0.001 | 0.371 (0.312–0.430) | <0.001 | 0.091 (0.071–0.111) | <0.001 |
[i] ΔAUC, NRI, and IDI were calculated relative to the clinical model. The clinical model included age, sex, BMI, smoking, hypertension, diabetes, and dyslipidemia. CCTA variables included stenosis severity, minimum lumen area, lesion length, diffuse lesion, occlusion, and CACS. AUC, area under the receiver operating characteristic curve; NRI, net reclassification improvement; IDI, integrated discrimination improvement; CCTA, coronary computed tomography angiography; BMI, body mass index; CACS, coronary artery calcium score.
Table 5
Distribution of occupational categories across sleep phenotype groups.
| VARIABLE | FAVORABLE SLEEP (n = 1308) | INTERMEDIATE SLEEP (n = 1351) | POOR SLEEP (n = 1324) | P-VALUE |
|---|---|---|---|---|
| Shift-related occupations | ||||
| Night-shift taxi drivers | 92 (7.0%) | 242 (17.9%) | 278 (21.0%) | |
| Night-truck drivers | 118 (9.0%) | 257 (19.0%) | 238 (18.0%) | |
| Night-time online streamers | 261 (20.0%) | 405 (30.0%) | 424 (32.0%) | |
| Non-shift-related occupations | ||||
| College students | 183 (14.0%) | 81 (6.0%) | 27 (2.0%) | |
| Manual workers | 105 (8.0%) | 95 (7.0%) | 40 (3.0%) | |
| Office workers | 118 (9.0%) | 54 (4.0%) | 53 (4.0%) | |
| Businesspersons | 170 (13.0%) | 95 (7.0%) | 26 (2.0%) | |
| Teachers | 131 (10.0%) | 54 (4.0%) | 106 (8.0%) | |
| Physicians | 52 (4.0%) | 41 (3.0%) | 79 (6.0%) | |
| Freelancers | 78 (6.0%) | 27 (2.0%) | 53 (4.0%) | |
| Overall comparison | — | — | — | <0.001 |
[i] Categories were grouped for descriptive purposes based on predominant work schedule patterns.
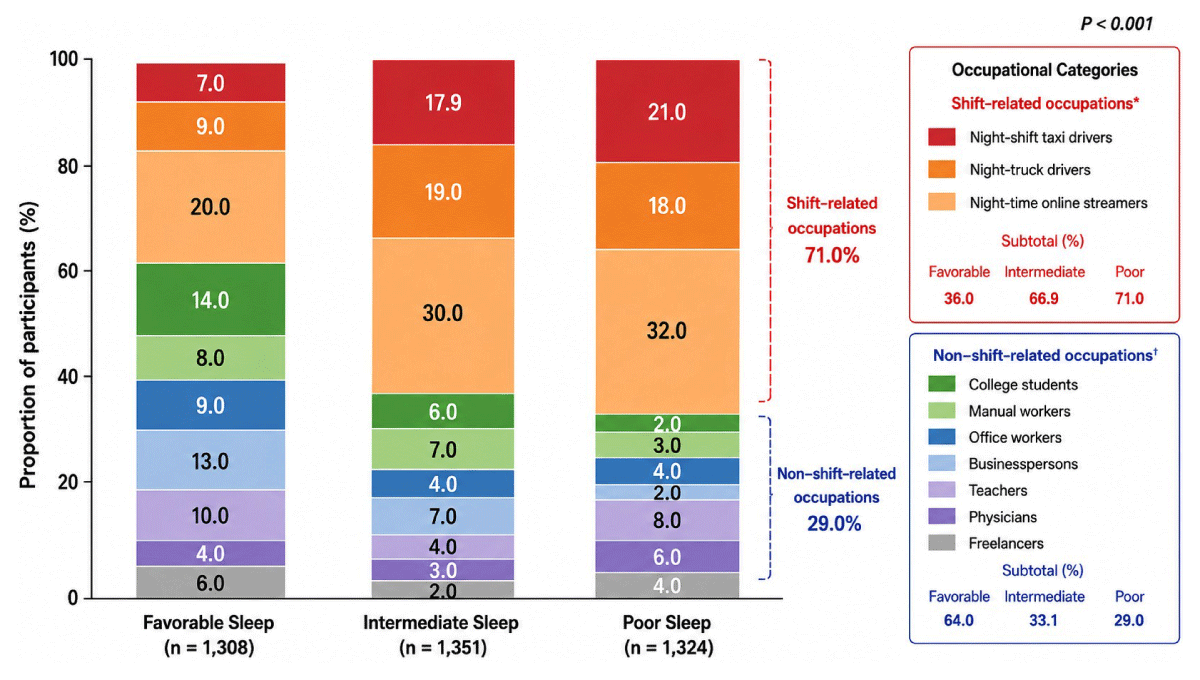
Figure 3
Distribution of occupational categories across sleep phenotype groups. *Shift-related occupations include night-shift taxi drivers, night-truck drivers, and night-time online streamers. †Non-shift-related occupations include college students, manual workers, office workers, businesspersons, teachers, physicians, and freelancers. Percentages may not sum to 100% due to rounding.
Table 6
Interaction analysis between sleep phenotype and shift-related occupation.
| VARIABLE | OR (95% CI) | P-VALUE |
|---|---|---|
| Sleep phenotype (per 1-point increase) | 1.31 (1.08–1.59) | 0.006 |
| Shift-related occupation | 1.54 (1.12–2.13) | 0.008 |
| Sleep × Shift occupation (interaction) | 1.18 (1.02–1.37) | 0.024 |
| Stratified Analysis | ||
| Non-shift occupation | 1.25 (0.99–1.54) | 0.081 |
| Shift-related occupation | 1.47 (1.18–1.83) | <0.001 |
[i] OR, odds ratio; CI, confidence interval; BMI, body mass index. The interaction model included sleep phenotype score, shift-related occupation, the sleep phenotype × shift-related occupation interaction term, age, sex, BMI, smoking, hypertension, diabetes, and dyslipidemia. Stratified analyses were adjusted for age, sex, BMI, smoking, hypertension, diabetes, and dyslipidemia.
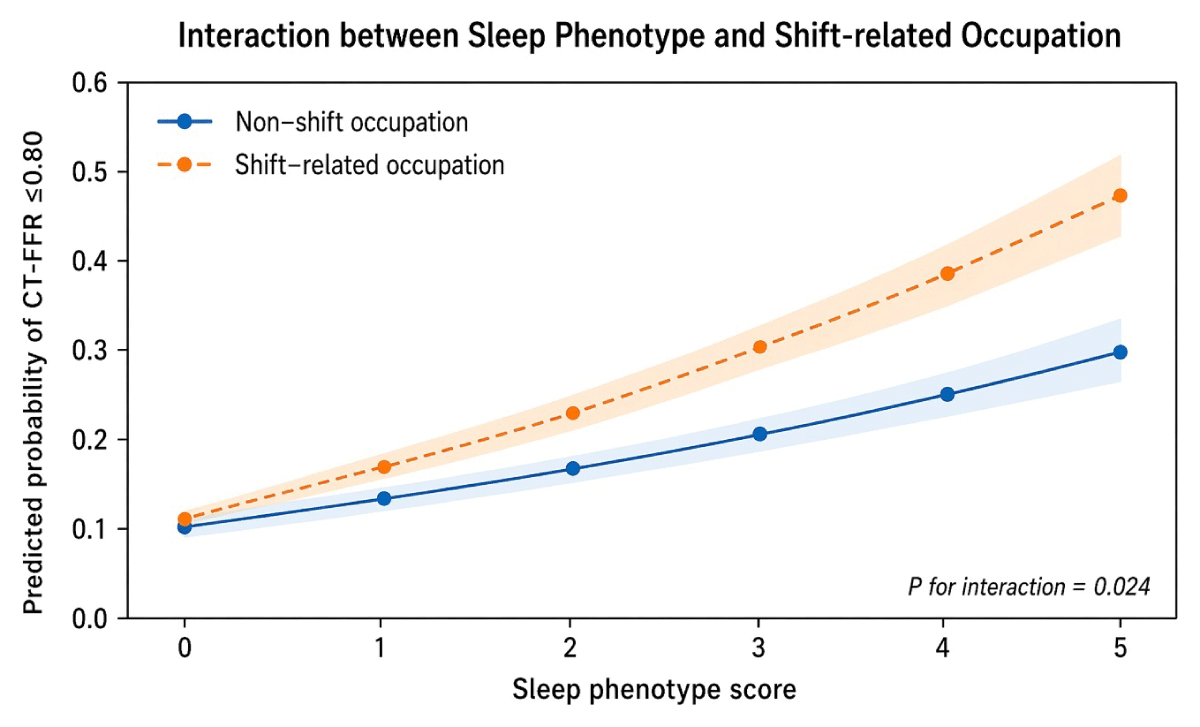
Figure 4
Predicted probability of CT-derived fractional flow reserve (CT-FFR) ≤ 0.80 according to sleep phenotype score stratified by occupational status. Predicted probabilities were derived from the multivariable interaction model including sleep phenotype score, shift-related occupation, the sleep phenotype × shift-related occupation interaction term, age, sex, body mass index, smoking, hypertension, diabetes, and dyslipidemia. Shaded areas represent 95% confidence intervals. CCTA, coronary computed tomography angiography; CT-FFR, computed tomography-derived fractional flow reserve.