
Table 1
Baseline characteristics of participants from CKB and UKB by incidence of all-cause mortality.
| CKB | UKB | |||||
|---|---|---|---|---|---|---|
| INCIDENT ALL-CAUSE MORTALITY | INCIDENT ALL-CAUSE MORTALITY | |||||
| CHARACTERISTIC | NO | YES | P VALUE | NO | YES | P VALUE |
| N | 5,036 | 2,005 | 253,556 | 20,701 | ||
| Age, mean (SD), years | 47.62 (9.08) | 55.04 (9.65) | <0.001 | 56.15 (8.06) | 61.67 (6.45) | <0.001 |
| Sex | <0.001 | <0.001 | ||||
| Male | 2,207 (43.8%) | 1,080 (53.9%) | 139,665 (55.1%) | 8,335 (40.3%) | ||
| Female | 2,829 (56.2%) | 925 (46.1%) | 113,891 (44.9%) | 12,366 (59.7%) | ||
| Region | 0.010 | – | ||||
| Rural | 3,231 (64.2%) | 1,351 (67.4%) | – | – | ||
| Urban | 1,805 (35.8%) | 654 (32.6%) | – | – | ||
| Ethnicity | – | <0.001 | ||||
| White | – | – | 239,660 (94.9%) | 19,931 (96.8%) | ||
| Non-white | – | – | 12,788 (5.1%) | 650 (3.2%) | ||
| Smoking status | <0.001 | <0.001 | ||||
| Never | 3,300 (65.5%) | 1,097 (54.7%) | 141,160 (55.9%) | 7,944 (38.7%) | ||
| Former | 252 (5.0%) | 159 (7.9%) | 86,291 (34.2%) | 8,667 (42.2%) | ||
| Current | 1,484 (29.5%) | 749 (37.4%) | 24,942 (9.9%) | 3,917 (19.1%) | ||
| Alcohol consumption status | <0.001 | <0.001 | ||||
| Never | 4,018 (79.8%) | 1,486 (74.1%) | 10,894 (4.3%) | 1,017 (4.9%) | ||
| Former | 194 (3.9%) | 134 (6.7%) | 8431 (3.3%) | 1,358 (6.6%) | ||
| Current | 824 (16.4%) | 385 (19.2%) | 233,655 (92.4%) | 18,258 (88.5%) | ||
| Self-rated health | <0.001 | <0.001 | ||||
| Excellent | 926 (18.4%) | 273 (13.6%) | 42,546 (16.9%) | 1,852 (9.0%) | ||
| Good | 1,426 (28.3%) | 487 (24.3%) | 148,554 (58.9%) | 9,624 (47.0%) | ||
| Fair | 2,198 (43.6%) | 872 (43.5%) | 51,364 (20.4%) | 6,273 (30.6%) | ||
| Poor | 486 (9.7%) | 373 (18.6%) | 9,688 (3.8%) | 2,737 (13.4%) | ||
| Educationa | <0.001 | <0.001 | ||||
| Low | 2,289 (45.5%) | 1,186 (59.2%) | 110,489 (44.1%) | 11,100 (54.6%) | ||
| Medium | 2,470 (49.0%) | 759 (37.9%) | 58,116 (23.2%) | 4,632 (22.8%) | ||
| High | 277 (5.5%) | 60 (3.0%) | 82,112 (32.8%) | 4,616 (22.7%) | ||
| BMI, mean (SD), kg/m2 | 24.33 (3.51) | 23.97 (3.79) | <0.001 | 27.38 (4.72) | 28.37 (5.44) | <0.001 |
| Sleep duration, mean (SD), h/day | 7.55 (1.33) | 7.39 (1.50) | <0.001 | 7.15 (1.09) | 7.25 (1.34) | <0.001 |
| Hypertension | <0.001 | <0.001 | ||||
| No | 2,950 (58.6%) | 787 (39.3%) | 118,196 (46.6%) | 5,798 (28.0%) | ||
| Yes | 2,086 (41.4%) | 1,218 (60.7%) | 135,360 (53.4%) | 14,903 (72.0%) | ||
| Diabetes | <0.001 | <0.001 | ||||
| No | 4,816 (95.6%) | 1,761 (87.8%) | 239,924 (94.6%) | 17,692 (85.5%) | ||
| Yes | 220 (4.4%) | 244 (12.2%) | 13,632 (5.4%) | 3,009 (14.5%) | ||
[i] SD, standard deviation; BMI, body mass index.
a In CKB, high, medium, and low level of education refers to college and above, secondary school, and primary school and below. In UKB, high, medium, and low level of education refers to college or university degree, A/AS levels or equivalent and O levels/GCSEs or equivalent, and none of the aforementioned.
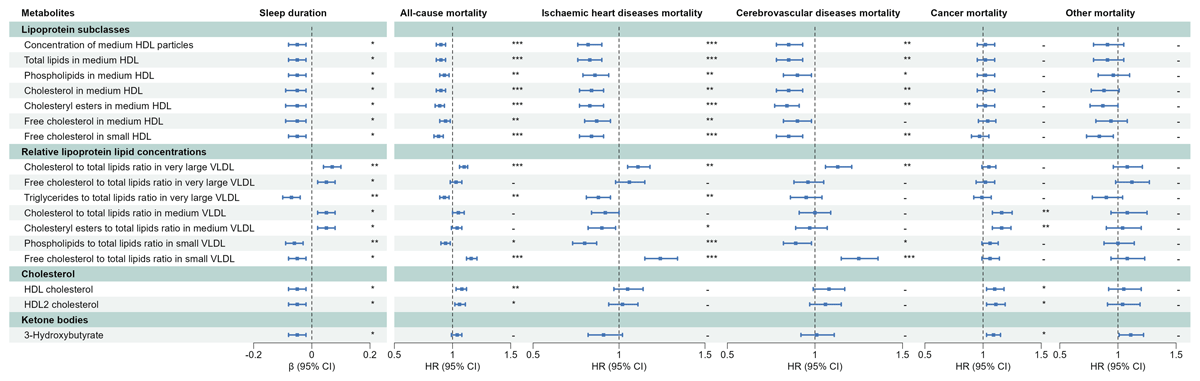
Figure 1
Association of metabolic markers with sleep duration and all-cause and cause-specific mortality in the CKB.
Models were adjusted for age, sex, regions, levels of education, smoking status, alcohol consumption, and self-rated health status. P values are corrected for multiple testing using FDR adjustment. Significance: ***p < 0.0001, **P < 0.01, *P < 0.05, - P > 0.05.
HR, hazard ratio; CI, confidence interval; HDL, High-Density Lipoprotein; VLDL, Very-Low-Density Lipoprotein.
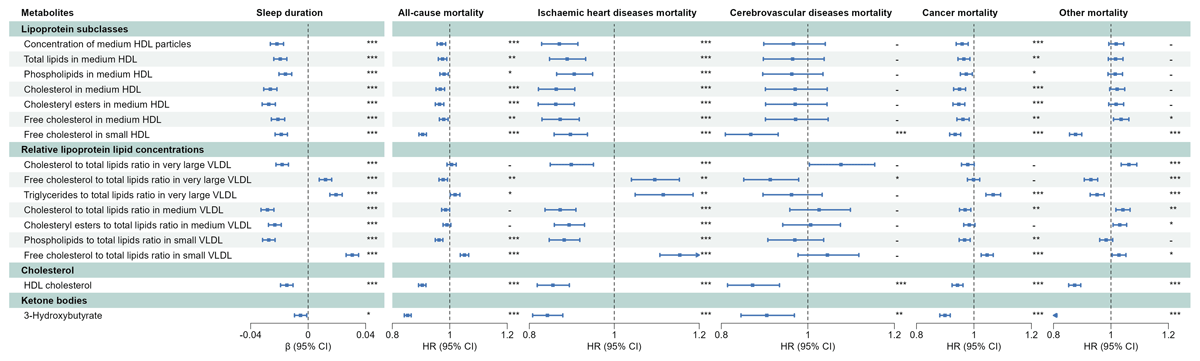
Figure 2
Association of metabolic markers with sleep duration and all-cause and cause-specific mortality in the UKB.
Models were adjusted for age, sex, ethnicity, levels of education, smoking status, alcohol consumption, and self-rated health status. P values are corrected for multiple testing using FDR adjustment. Significance: ***p < 0.0001, **P < 0.01, *P < 0.05, - P > 0.05.
HR, hazard ratio; CI, confidence interval; HDL, High-Density Lipoprotein; VLDL, Very-Low-Density Lipoprotein.
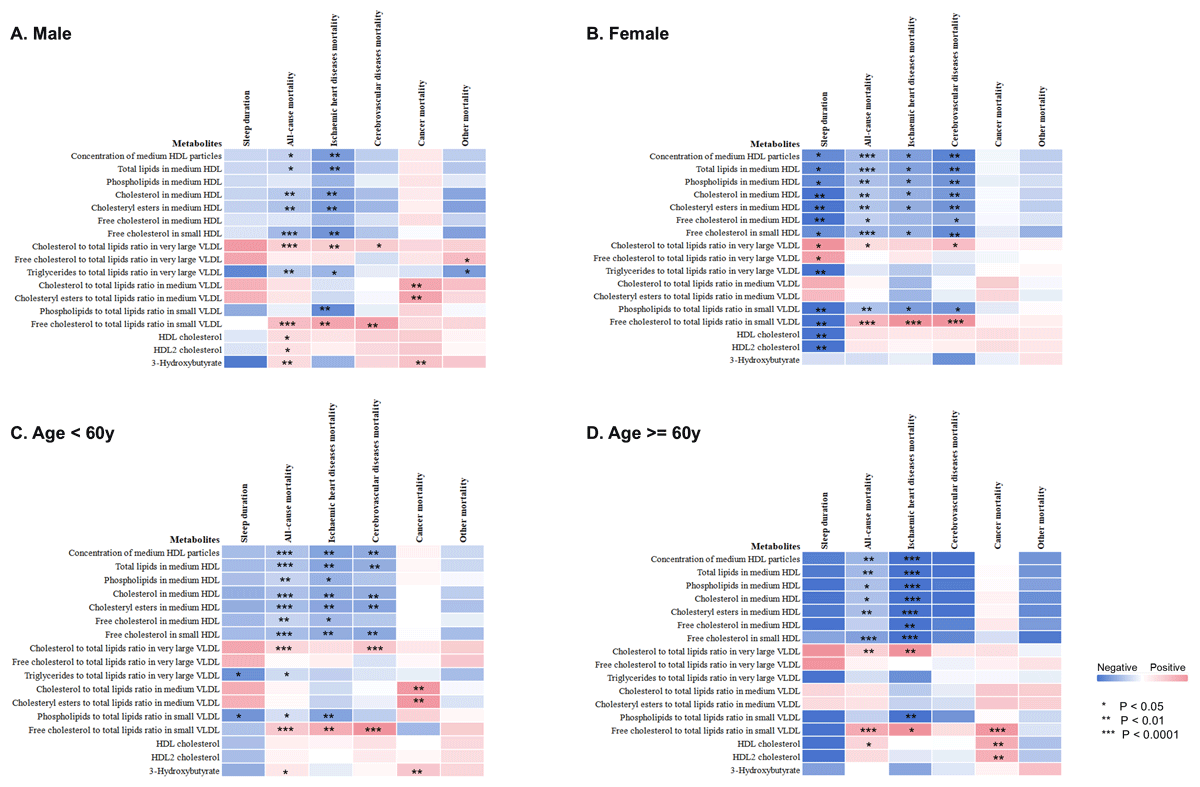
Figure 3
Association of metabolic markers with sleep duration and all-cause and cause-specific mortality in the CKB by sex (A, B) and age group (C, D).
This heatmap shows the metabolic markers and their β coefficient from multivariable-adjusted linear regression (sleep duration), and HRs from multivariable-adjusted Cox regressions (mortality). Results are adjusted for age, sex, regions, levels of education, smoking status, alcohol consumption, and self-rated health status. P values are corrected for multiple testing using FDR adjustment. Dark pink indicates a strong positive association and dark blue a strong negative association.
HDL, High-Density Lipoprotein; VLDL, Very-Low-Density Lipoprotein.
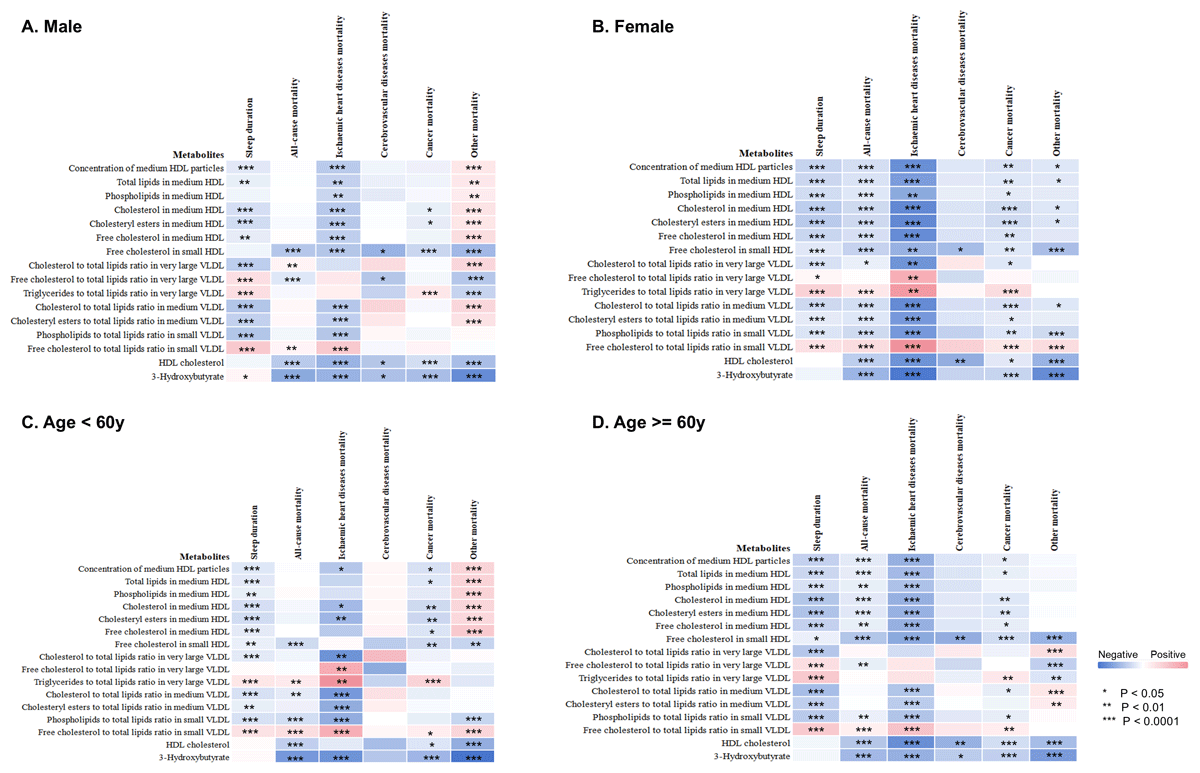
Figure 4
Association of metabolic markers with sleep duration and all-cause and cause-specific mortality in the UKB by sex (A, B) and age group (C, D).
This heatmap shows the metabolic markers and their β coefficient from multivariable-adjusted linear regression (sleep duration), and HRs from multivariable-adjusted Cox regressions (mortality). Results are adjusted for age, sex, regions, levels of education, smoking status, alcohol consumption, and self-rated health status. P values are corrected for multiple testing using FDR adjustment. Dark pink indicates a strong positive association and dark blue a strong negative association.
HDL, High-Density Lipoprotein; VLDL, Very-Low-Density Lipoprotein.