
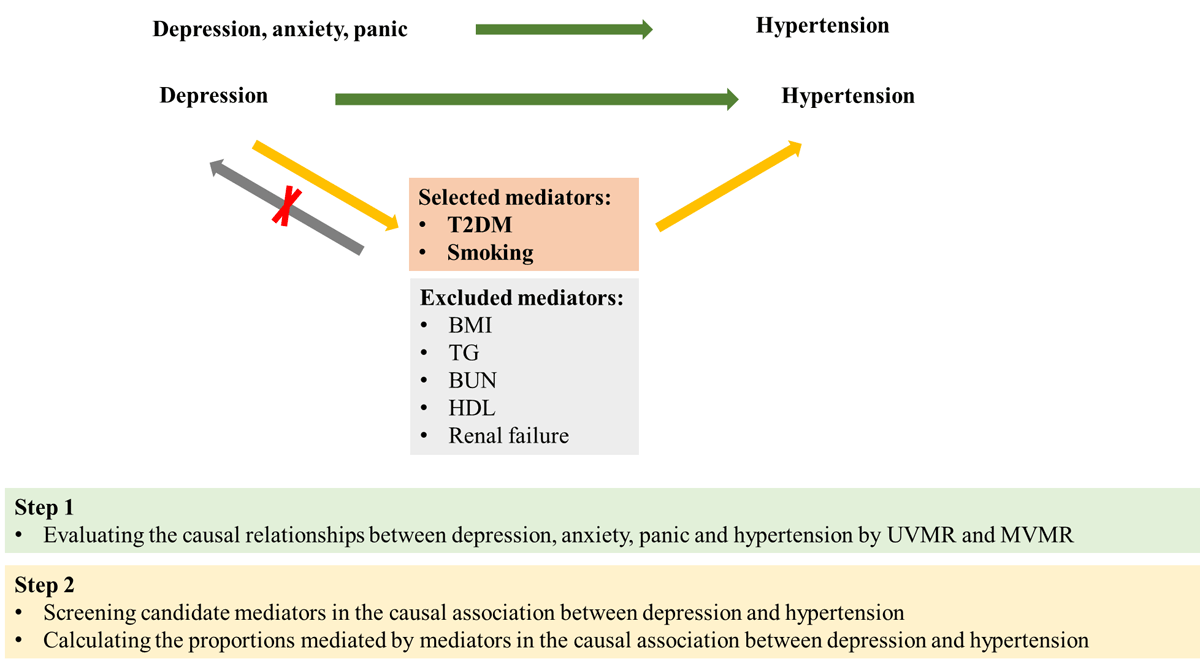
Figure 1
Overview of the study design. Step 1: we used UVMR and MVMR to evaluate the causal relationships between depression, anxiety, panic, and hypertension. Step 2: we screened candidate mediators in the causal association between depression and hypertension, and then we calculated their mediating effects using MVMR. T2DM, type 2 diabetes mellitus; BMI, body mass index; TG, triglycerides; BUN, blood urea nitrogen; HDL, high density lipoprotein.
Table 1
Summary of GWAS data used in the MR analyses.
| PHENOTYPE | NO. OF PARTICIPANTS | nSNPs | UNIT | ANCESTRY | CONSORTIUM/COHORT | AUTHOR | YEAR OF PUBLICATION | PMID |
|---|---|---|---|---|---|---|---|---|
| Depression | 322580 | 7624934 | logOR | European | – | Howard DM | 2018 | 29662059 |
| Anxiety | 463010 | 9851867 | SD | European | MRC–IEU | Ben Elsworth | 2018 | – |
| Panic | 117722 | 12509516 | – | European | – | Neale lab | 2018 | – |
| Hypertension | 463010 | 9851867 | SD | European | MRC–IEU | Ben Elsworth | 2018 | – |
| T2DM | 69033 | 2905211 | logOR | European | – | Morris AP | 2012 | 22885922 |
| Smoking | 142387 | 9851867 | SD | European | MRC–IEU | Ben Elsworth | 2018 | – |
| BMI | 99998 | 7191606 | – | European | Within family GWAS consortium | Howe LJ | 2022 | – |
| TG | 441016 | 12321875 | – | European | UK Biobank | Richardson Tom | 2020 | 32203549 |
| BUN | 62403 | – | – | European | – | Dennis JK | 2021 | 33441150 |
| HDL | 88329 | – | – | European | – | Davyson E | 2023 | 36764567 |
| Renal failure | 463010 | 9851867 | SD | European | MRC–IEU | Ben Elsworth | 2018 | – |
[i] T2DM: type 2 diabetes mellitus, BMI: body mass index, TG: triglycerides, BUN: blood urea nitrogen, HDL: high density lipoprotein.
Table 2
MVMR estimating the associations of depression, panic, and anxiety with hypertension.
| METHOD | EXPOSURE | β (95%CI) | OR (95%CI) | P VALUE | NO OF SNPs | MVMR HETEROGENEITY TEST (IVW/EGGER) | MVMR DIRECTIONAL PLEIOTROPY TEST | ||||
|---|---|---|---|---|---|---|---|---|---|---|---|
| Q | P | EGGER INTERCEPT | SE | P | |||||||
| Hypertension | |||||||||||
| Models with mutual adjustment for depression, anxiety and panic | |||||||||||
| MV-IVM | depression | 0.116 [0.03, 0.202] | 1.123 [1.030, 1.224] | 0.008 | 46 | 71.5173 | 0.0041 | ||||
| anxiety | 0.463 [–0.377, 1.304] | 1.589 [0.686, 3.684] | 0.280 | ||||||||
| panic | 0.073 [–0.013, 0.159] | 1.076 [0.987, 1.172] | 0.096 | ||||||||
| MV-Egger | depression | 0.164 [0.052, 0.275] | 1.178 [1.053, 1.317] | 0.004 | 68.7607 | 0.0057 | 0 | 0 | 0.194 | ||
| anxiety | 0.596 [–0.262, 1.454] | 1.815 [0.770, 4.280] | 0.173 | ||||||||
| panic | 0.079 [–0.007, 0.165] | 1.082 [0.993, 1.179] | 0.070 | ||||||||
| MV-LASSO | depression | 0.146 [0.067, 0.225] | 1.157 [1.069, 1.252] | <0.001 | |||||||
| anxiety | 0.543 [–0.19, 1.276] | 1.721 [0.827, 3.582] | 0.147 | ||||||||
| panic | 0.102 [0.024, 0.179] | 1.107 [1.024, 1.196] | 0.010 | ||||||||
| MV-median | depression | 0.128 [0.026, 0.23] | 1.137 [1.026, 1.259] | 0.014 | |||||||
| anxiety | 0.317 [–0.649, 1.284] | 1.373 [0.523, 3.611] | 0.520 | ||||||||
| panic | 0.084 [–0.023, 0.19] | 1.088 [0.977, 1.209] | 0.124 | ||||||||
| Models with mutual adjustment for depression and anxiety | |||||||||||
| MV-IVM | depression | 0.148 [0.08, 0.215] | 1.160 [1.083, 1.240] | <0.001 | 27 | 32.4864 | 0.1444 | ||||
| anxiety | 0.748 [0.046, 1.45] | 2.113 [1.047, 4.263] | 0.037 | ||||||||
| MV-Egger | depression | 0.178 [0.075, 0.282] | 1.195 [1.078, 1.326] | 0.001 | 31.6913 | 0.1348 | 0 | 0 | 0.438 | ||
| anxiety | 0.858 [0.098, 1.618] | 2.358 [1.103, 5.043] | 0.027 | ||||||||
| MV-LASSO | depression | 0.148 [0.08, 0.215] | 1.160 [1.083, 1.240] | <0.001 | |||||||
| anxiety | 0.748 [0.046, 1.45] | 2.113 [1.047, 4.263] | 0.037 | ||||||||
| MV-median | depression | 0.165 [0.073, 0.257] | 1.179 [1.076, 1.293] | <0.001 | |||||||
| anxiety | 0.414 [–0.496, 1.324] | 1.513 [0.609, 3.758] | 0.373 | ||||||||
| Models with mutual adjustment for depression and panic | |||||||||||
| MV-IVM | depression | 0.1 [0.042, 0.159] | 1.105 [1.043, 1.172] | 0.004 | 93 | 125.3549 | 9.90E-03 | ||||
| panic | 0.041 [–0.005, 0.086] | 1.042 [0.995, 1.090] | 0.078 | ||||||||
| MV-Egger | depression | 0.113 [0.036, 0.19] | 1.120 [1.037, 1.209] | 0.004 | 125.0206 | 8.60E-03 | 0 | 0 | 0.624 | ||
| panic | 0.043 [–0.003, 0.089] | 1.044 [0.997, 1.093] | 0.07 | ||||||||
| MV-LASSO | depression | 0.097 [0.041, 0.153] | 1.102 [1.042, 1.165] | 0.001 | |||||||
| panic | 0.04 [0.000, 0.081] | 1.041 [1.000, 1.084] | 0.053 | ||||||||
| MV-median | depression | 0.079 [0.004, 0.155] | 1.082 [1.004, 1.168] | 0.04 | |||||||
| panic | 0.05 [–0.014, 0.113] | 1.051 [0.986, 1.120] | 0.123 | ||||||||
| Models with mutual adjustment for anxiety and panic | |||||||||||
| MV-IVM | anxiety | 0.705 [–0.115, 1.526] | 2.024 [0.891, 4.600] | 0.092 | 42 | 67.5684 | 0.0041 | ||||
| panic | 0.087 [0.009, 0.166] | 1.091 [1.009, 1.181] | 0.029 | ||||||||
| MV-Egger | anxiety | 0.563 [–0.73, 1.856] | 1.756 [0.482, 6.389] | 0.394 | 67.4307 | 0.0031 | 0 | 0 | 0.778 | ||
| panic | 0.085 [0.004, 0.166] | 1.089 [1.004, 1.181] | 0.04 | ||||||||
| MV-LASSO | anxiety | 0.463 [–0.207, 1.134] | 1.589 [0.813, 3.108] | 0.175 | |||||||
| panic | 0.113 [0.047, 0.180] | 1.120 [1.048, 1.197] | 0.001 | ||||||||
| MV-median | anxiety | 0.349 [–0.609, 1.306] | 1.418 [0.544, 3.691] | 0.476 | |||||||
| panic | 0.056 [–0.04, 0.152] | 1.058 [0.961, 1.164] | 0.252 | ||||||||
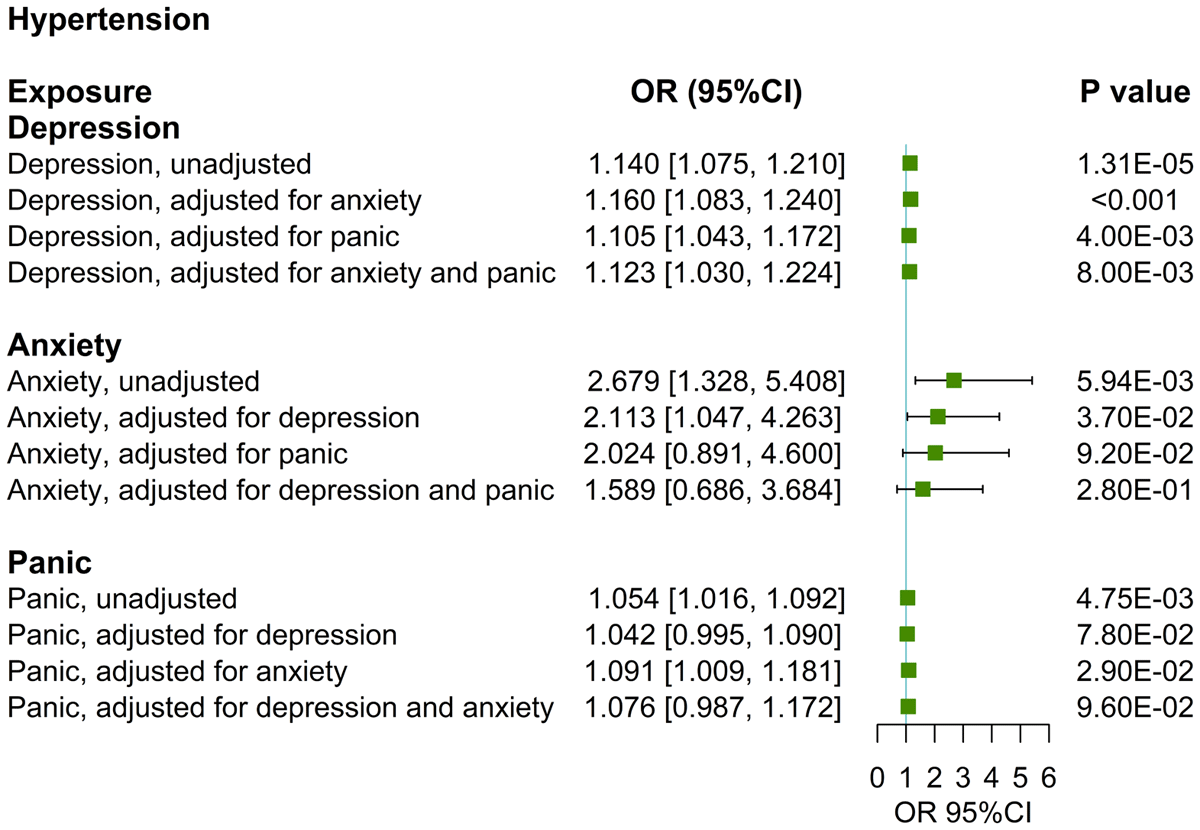
Figure 2
UVMR and MVMR estimates of the causal associations of depression, anxiety, and panic with hypertension.
Table 3
MVMR estimating the associations of each mediator with hypertension with adjustment for depression.
| METHOD | EXPOSURE | β (95%CI) | OR (95%CI) | SE | P | NO OF SNPs | MVMR HETEROGENEITY TEST (IVW/EGGER) | MVMR DIRECTIONAL PLEIOTROPY TEST | |||
|---|---|---|---|---|---|---|---|---|---|---|---|
| Q | P | EGGER INTERCEPT | SE | P | |||||||
| T2DM | |||||||||||
| MV-IVM | depression | 0.122[0.017, 0.227] | 1.130[1.017, 1.255] | 0.054 | 0.023 | 37 | 116.3391 | <0.0001 | |||
| T2DM | 0.01[0.005, 0.015] | 1.010[1.005, 1.015] | 0.003 | <0.001 | |||||||
| MV-Egger | depression | 0.126[–0.016, 0.269] | 1.134[0.984, 1.309] | 0.073 | 0.083 | 116.3096 | <0.0001 | 0 | 0 | 0.926 | |
| T2DM | 0.01[0.005, 0.015] | 1.010[1.005, 1.015] | 0.003 | <0.001 | |||||||
| MV-LASSO | depression | 0.097[0.010, 0.184] | 1.102[1.010, 1.202] | 0.044 | 0.029 | ||||||
| T2DM | 0.011[0.007, 0.016] | 1.011[1.007, 1.016] | 0.002 | <0.001 | |||||||
| MV-median | depression | 0.143[0.033, 0.253] | 1.154[1.034, 1.288] | 0..56 | 0.011 | ||||||
| T2DM | 0.012[0.007, 0.018] | 1.012[1.007, 1.018] | 0.003 | <0.001 | |||||||
| Smoking | |||||||||||
| MV-IVM | depression | 0.127[0.043, 0.211] | 1.135[1.044, 1.235] | 0.043 | 0.003 | 23 | 54.0476 | 0.0001 | |||
| smoking | 0.036[0.015, 0.058] | 1.037[1.015, 1.060] | 0.011 | 0.001 | |||||||
| MV-Egger | depression | 0.188[0.036, 0.34] | 1.207[1.037, 1.405] | 0.078 | 0.015 | 51.7048 | 0.0001 | 0 | 0 | 0.341 | |
| smoking | 0.04[0.017, 0.063] | 1.041[1.017, 1.065] | 0.012 | 0.001 | |||||||
| MV-LASSO | depression | 0.148[0.088, 0.208] | 1.160[1.092, 1.231] | 0.031 | <0.001 | ||||||
| smoking | 0.032[0.010, 0.054] | 1.033[1.010, 1.055] | 0.011 | 0.004 | |||||||
| MV-median | depression | 0.148[0.064, 0.231] | 1.160[1.066, 1.260] | 0.043 | 0.001 | ||||||
| smoking | 0.044[0.016, 0.073] | 1.045[1.016, 1.076] | 0.014 | 0.002 | |||||||
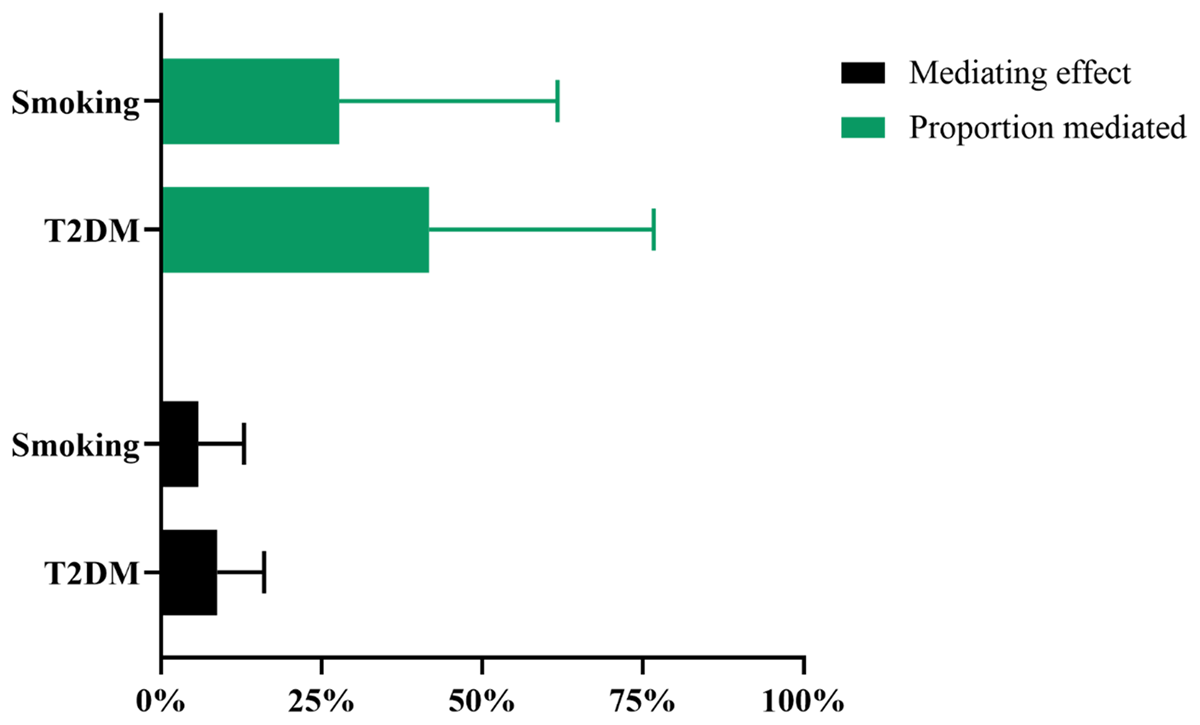
Figure 3
Mendelian randomization estimates of mediated effect and proportions mediated by mediators in the causal association between depression and hypertension. T2DM: type 2 diabetes mellitus.
| Abbreviation | Term |
| 95%CI | 95% confidence intervals |
| BMI | Body mass index |
| BUN | Blood urea nitrogen |
| HDL | High density lipoprotein |
| IVs | Instrumental variables |
| IVW | Inverse variance weighting |
| GWAS | Genome-wide association studies |
| MR | Mendelian randomization |
| MVMR | Multivariable Mendelian randomization |
| OR | Odds ratios |
| SNPs | Single nucleotide polymorphisms |
| T2DM | Type 2 diabetes mellitus |
| TG | Triglycerides |
| UVMR | Univariate Mendelian randomization |