
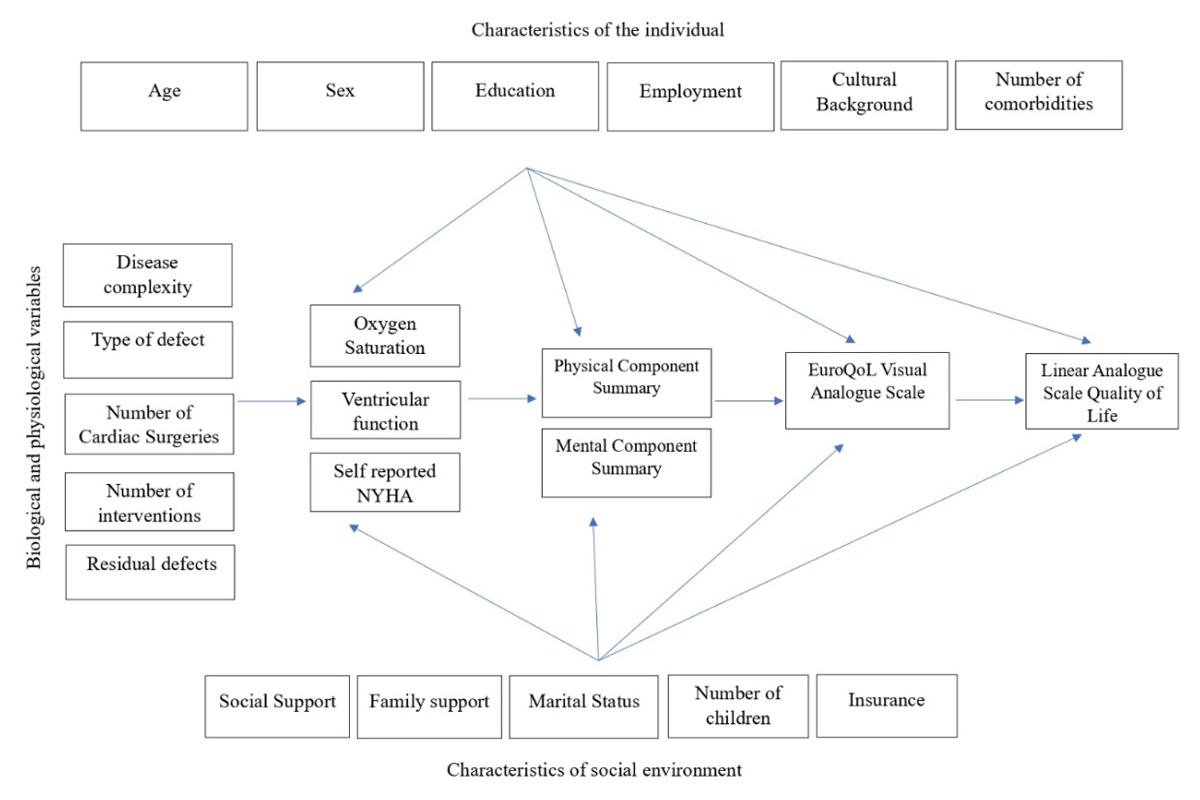
Figure 1
The conceptual model of Wilson and Cleary, eluding causal links among characteristics of the individual, social environment, biological and physiological variables contributing to various facets of quality of life assessment. Characteristics of the individual, the underlying disease, and the environment affect physiological factors. The physiological factors influence the physical and psychological functioning, which in turn influences the patient’s own perception of their health status and overall quality of life.
Table 1
Demographics and medical details stratified by gender.
| CHARACTERISTIC | OVERALL, N = 3251 | MEN, N = 1831 | WOMEN, N = 1421 | p-value2 |
|---|---|---|---|---|
| Age | 24 (21, 30) | 24 (21, 31) | 24 (21, 29) | 0.7 |
| Disease Complexity | 0.2 | |||
| Simple | 68 (21%) | 32 (17%) | 36 (25%) | |
| Moderate | 122 (38%) | 74 (40%) | 48 (34%) | |
| Complex | 135 (42%) | 77 (42%) | 58 (41%) | |
| Employed | 182 (56%) | 119 (65%) | 63 (44%) | <0.001 |
| Education | 0.7 | |||
| Below high school | 27 (8.3%) | 16 (8.7%) | 11 (7.7%) | |
| High school | 95 (29%) | 49 (27%) | 46 (32%) | |
| Bachelor’s degrees | 121 (37%) | 71 (39%) | 50 (35%) | |
| Master’s degree | 82 (25%) | 47 (26%) | 35 (25%) | |
| Married | 86 (26%) | 44 (24%) | 42 (30%) | 0.3 |
| No of children | 0.004 | |||
| 0 | 268 (82%) | 150 (82%) | 118 (83%) | |
| 1 | 23 (7.1%) | 7 (3.8%) | 16 (11%) | |
| 2 | 28 (8.6%) | 22 (12%) | 6 (4.2%) | |
| 3 | 4 (1.2%) | 2 (1.1%) | 2 (1.4%) | |
| 4 | 2 (0.6%) | 2 (1.1%) | 0 (0%) | |
| Self-reported NYHA | 0.8 | |||
| 1 | 161 (50%) | 94 (52%) | 67 (48%) | |
| 2 | 110 (34%) | 62 (34%) | 48 (34%) | |
| 3 | 33 (10%) | 17 (9.4%) | 16 (11%) | |
| 4 | 17 (5.3%) | 8 (4.4%) | 9 (6.4%) | |
| Unknown | 4 | 2 | 2 |
[i] 1 Median (IQR); n (%).
2 Wilcoxon rank sum test; Pearson’s Chi-squared test; Fisher’s exact test.
Table 2
Comparison of Patient Reported outcome measures with global data.
| CHARACTERISTIC1 MEAN (SD) | 2014, N = 2001 | GLOBAL DATA 2014, N = 4028 | p VALUE | 2022, N = 1251 | GLOBAL DATA 2022, N = 8415 | p VALUE |
|---|---|---|---|---|---|---|
| PCS | 67.2 (20.7) | 77.2 ± 20.9 | <0.001 | 68.8 (20.5) | 75.2 ± 21.3 | 0.001 |
| MCS | 68.9 (19.5) | 72.1 ± 19.0 | 0.021 | 71.4 (17.7) | 69.2 ± 18.7 | 0.166 |
| EQ VAS | 77.6 (18.7) | 77.9 ± 16.5 | 0.831 | 76.3 (16.1) | 73.3 ± 17.8 | 0.038 |
| QOL | 76.7 (18.5) | 78.3 ± 16.6 | 0.216 | 72.1 (18.3) | 72.5 ± 20.0 | 0.809 |
[i] PCS – Physical Component Summary.
MC-S – Mental Component Summary.
EQ VAS – EuroQoL Visual Analogue Scale.
QoL – Quality of Life.
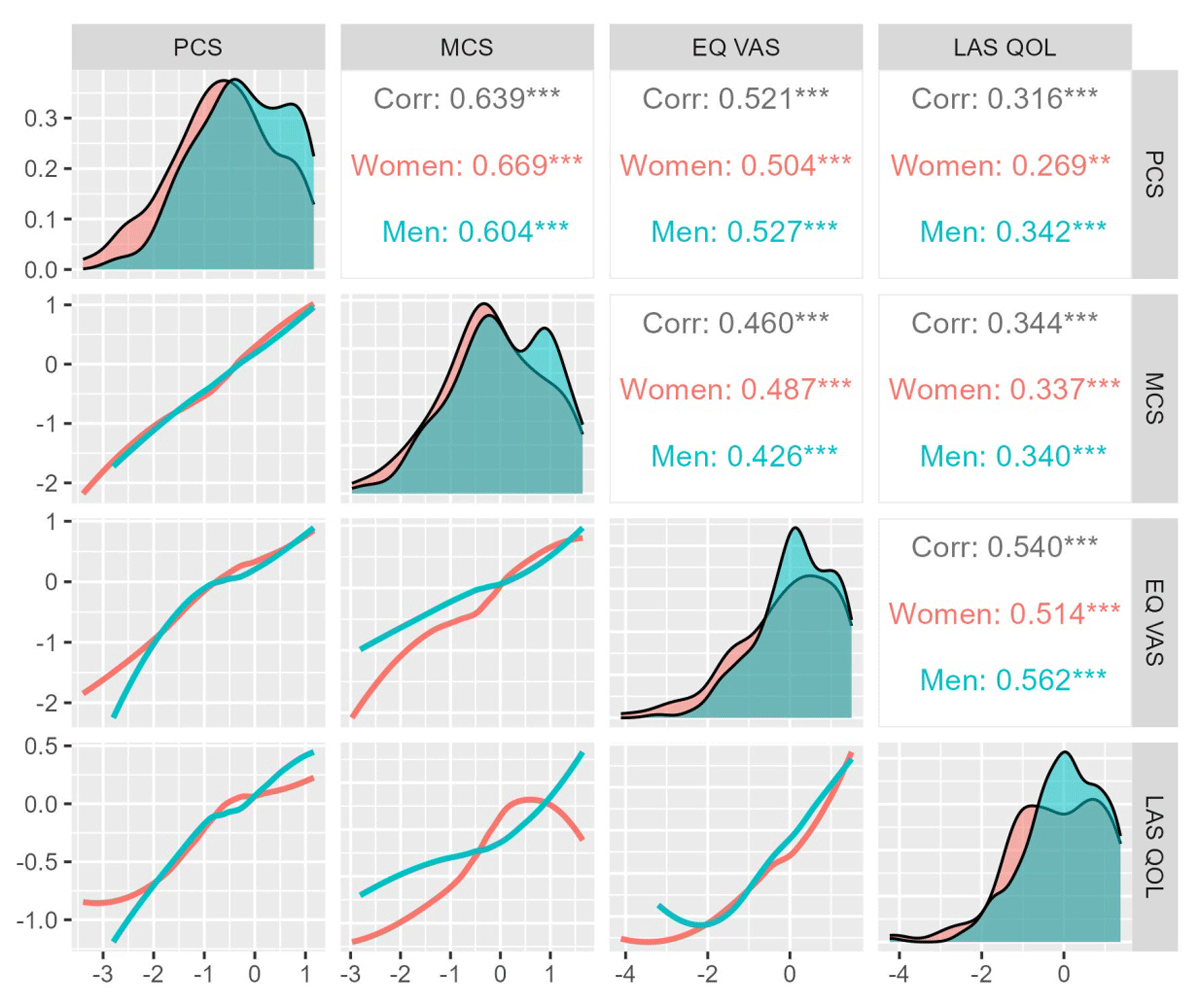
Figure 2
Correlation of the various patient-reported outcome measures. All measures were strongly related to each other. This relationship remained similar for men and women. Standardized values of each of these PROMs are depicted on the x and y axes to demonstrate the relationship between them.
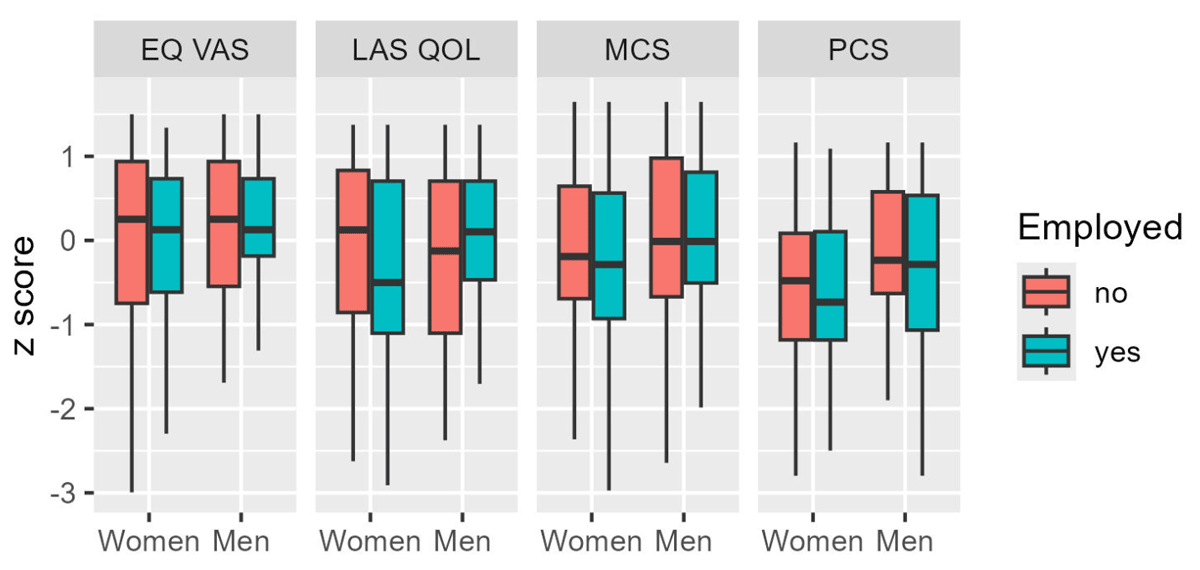
Figure 3
Differential effect of unemployment on the various patient-reported outcome measures. Employed women had worse scores in EuroQoL VAS, MCS, and LAS-QOL. PCS scores of women were unaffected by employment status.
Table 3
Relative ranking and effect sizes of items measuring physical functioning, psychological functioning and general health status and Quality of Life using adjusted R2-independent forward stepwise multiple linear regression.
| MODEL 1 : NYHA INCLUDED | |||||||||||
|---|---|---|---|---|---|---|---|---|---|---|---|
| VARIABLES | PCS (TOTAL R2 = 0.339) | MCS (TOTAL R2 = 0.123) | HS (TOTAL R2 = 0.134) | QOL (TOTAL R2 = 0.040) | AVERAGE R2 RANKS | t VALUE | AVERAGE EFFECT SIZE (COHEN’S f2) | ||||
| PARTIAL R2 RANK | EFFECT SIZE (t-VALUE) | PARTIAL R2 RANK | EFFECT SIZE (t-VALUE) | PARTIAL R2 RANK | EFFECT SIZE (t-VALUE) | PARTIAL R2 RANK | EFFECT SIZE (t-VALUE) | ||||
| Self-reported NYHA-not limited | 5 (0.090) | 9.3 | 1 (0.035) | 6.7 | 2 (0.057) | 6.1 | 2 (0.026) | 2.9 | 2.5 | 6.25 | 0.145 |
| Self-reported NYHA-Slightly limited | 1 (0.009) | 2.9 | – | – | 1 (0.019) | 2.5 | – | – | 1 | 2.7 | 0.316 |
| Male | 3 (0.044) | 3.8 | – | – | – | – | – | – | 3 | 3.8 | 0.446 |
| Masters degree or higher | 2 (0.034) | 3.3 | – | – | – | – | – | – | 2 | 3.3 | 0.462 |
| Center -I | – | – | – | – | – | – | 1 (0.006) | 2.5 | 1 | 2.5 | 0.015 |
| Decrease in Age (Years) | 4 (0.045) | 3.4 | – | – | – | – | – | – | 4 | 3.4 | 0.444 |
| MODEL 2: NYHA EXCLUDED | |||||||||||
| (TOTAL R2 = 0.136) | (TOTAL R2 = 0.012) | (TOTAL R2 = 0.014) | (TOTAL R2 = 0.014) | ||||||||
| Male | 3(0.027) | 4.3 | 1(0) | 2.0 | 1(0) | 2.2 | – | – | 1.7 | 2.83 | 0.051 |
| Decrease in Age (Years) | 4(0.029) | 4.2 | – | – | – | – | – | – | 4 | 4.2 | 0.124 |
| Masters degree or higher | 5(0.031) | 3.2 | – | – | – | – | – | – | 5 | 3.2 | 0.121 |
| Complexity-Simple | 1(0.011) | 3.7 | – | – | – | – | – | – | 1 | 3.7 | 0.144 |
| Complexity-Moderate | 2(0.015) | 2.2 | – | – | – | – | – | – | 2 | 2.2 | 0.141 |
| Center – I | – | – | – | – | – | – | 1(0.0001) | 2.2 | 1 | 2.2 | 0.013 |
[i] PCS – Physical Component Summary.
MCS – Mental Component Summary.
EQ VAS – EuroQoL Visual Analogue Scale.
QoL – Quality of Life.
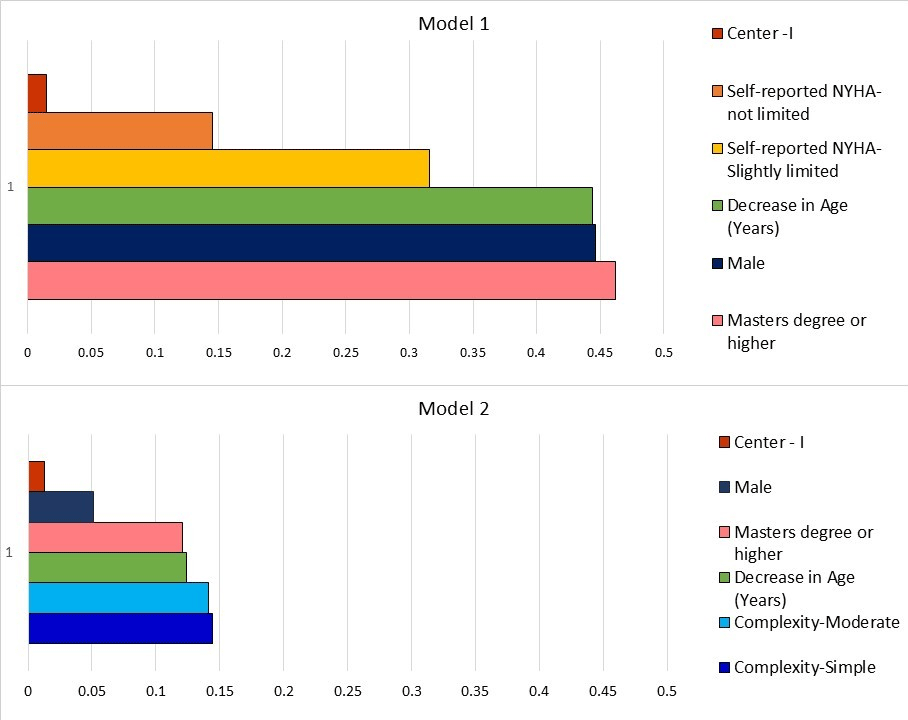
Figure 4
Hierarchy of factors influencing overall quality of life in order of effect size from the Wilson and Cleary model. The average effect size is shown on the x-axis and the factors responsible on the y-axis.