
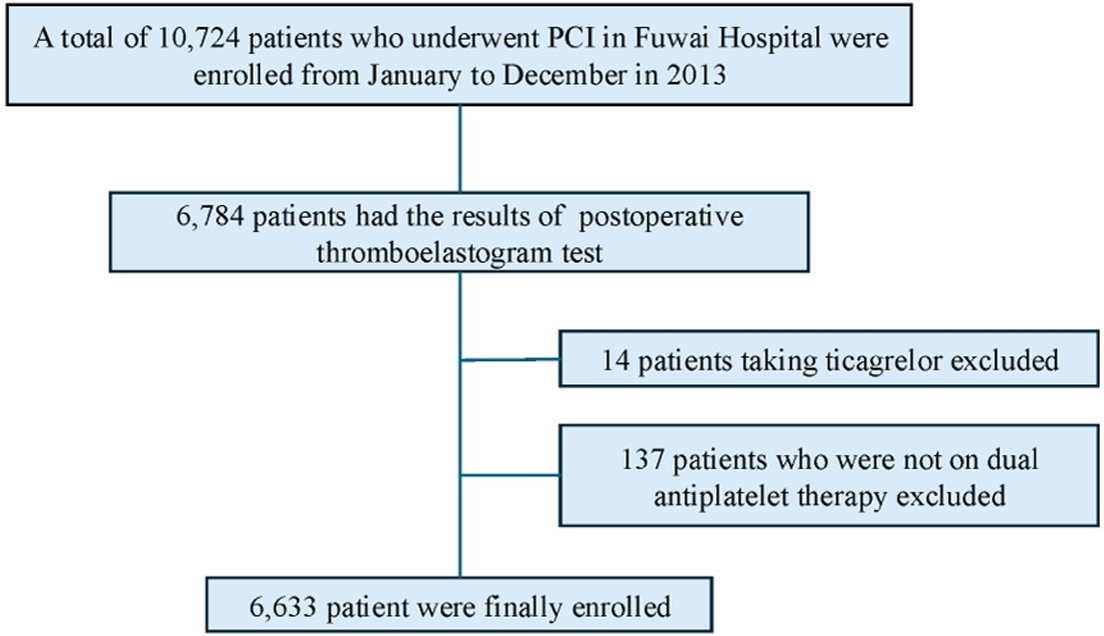
Figure 1
Flowchart of the study. PCI, percutaneous coronary intervention.
Table 1
Baseline characteristics of patients according to the quartiles of remnant cholesterol.
| PARAMETER | Q1 N = 1677 | Q2 N = 1620 | Q3 N = 1659 | Q4 N = 1677 | P-VALUE |
|---|---|---|---|---|---|
| DEMOGRAPHICS | |||||
| Sex [male, n(%)] | 1342 (80.02) | 1256 (77.53) | 1280 (77.15) | 1264 (75.37) | 0.014 |
| Age, year | 60.120 ± 10.068 | 59.010 ± 10.222 | 57.760 ± 10.171 | 55.920 ± 10.072 | <0.001 |
| BMI, kg/m2 | 25.402 ± 3.181 | 25.857 ± 3.223 | 26.068 ± 3.135 | 26.601 ± 3.019 | <0.001 |
| CLINICAL CHARACTERISTICS | |||||
| ACS, n (%) | 899 (53.61) | 907 (55.99) | 964 (58.11) | 1025 (61.12) | <0.001 |
| Smoking history, n (%) | 902 (53.79) | 918 (56.67) | 960 (57.87) | 989 (58.97) | 0.017 |
| Hyperlipidemia, n (%) | 1036 (61.78) | 1087 (67.10) | 1170 (70.52) | 1235 (73.64) | <0.001 |
| Hypertension, n (%) | 1058 (63.09) | 1076 (66.42) | 1064 (64.14) | 1117 (66.61) | 0.087 |
| Diabetes mellitus, n (%) | 498 (29.70) | 516 (31.85) | 475 (28.63) | 537 (32.02) | 0.091 |
| COPD, n (%) | 35 (2.09) | 32 (1.98) | 44 (2.65) | 36 (2.15) | 0.561 |
| Family history of CHD, n (%) | 382 (22.78) | 391 (24.14) | 430 (25.92) | 437 (26.06) | 0.086 |
| Cerebrovascular disease history, n (%) | 179 (10.67) | 174 (10.74) | 189 (11.39) | 145 (8.65) | 0.054 |
| Peripheral vascular disease, n (%) | 57 (3.40) | 34 (2.10) | 50 (3.01) | 49 (2.92) | 0.152 |
| Prior myocardial infarction, n (%) | 351 (20.93) | 333 (20.56) | 343 (20.68) | 286 (17.05) | 0.013 |
| Prior PCI, n (%) | 453 (27.01) | 428 (26.42) | 377 (22.72) | 370 (22.06) | <0.001 |
| Prior CABG, n (%) | 74 (4.41) | 61 (3.77) | 54 (3.25) | 82 (4.89) | 0.087 |
| LABORATORY VARIABLES | |||||
| LVEF, % | 63.627 ± 6.909 | 62.776 ± 6.972 | 62.608 ± 7.602 | 62.671 ± 7.189 | <0.001 |
| Hemoglobin, g/L | 141.187 ± 15.445 | 142.423 ± 14.740 | 142.69 ± 14.931 | 144.609 ± 15.382 | <0.001 |
| PLT, 109/L | 194.874 ± 50.084 | 202.890 ± 52.960 | 208.90 ± 56.496 | 214.355 ± 57.358 | <0.001 |
| MPV, fL | 10.579 ± 0.887 | 10.620 ± 0.922 | 10.619 ± 0.924 | 10.592 ± 0.921 | 0.497 |
| LDL-C, mmol/L | 2.248 ± 0.785 | 2.370 ± 0.826 | 2.547 ± 0.864 | 2.771 ± 0.992 | <0.001 |
| HDL-C, mmol/L | 1.157 ± 0.296 | 1.045 ± 0.266 | 0.988 ± 0.237 | 0.921 ± 0.218 | <0.001 |
| TC, mmol/L | 3.743 ± 0.890 | 3.956 ± 0.935 | 4.237 ± 0.956 | 4.822 ± 1.130 | <0.001 |
| Triglyceride, mmol/L | 1.070 ± 0.327 | 1.384 ± 0.345 | 1.729 ± 0.406 | 2.914 ± 1.426 | <0.001 |
| Glucose, mmol/L | 5.913 ± 1.860 | 6.043 ± 1.849 | 6.049 ± 1.873 | 6.365 ± 2.158 | <0.001 |
| eGFR, ml/min | 91.362 ± 13.889 | 91.566 ± 14.460 | 91.683 ± 15.010 | 92.061 ± 15.492 | 0.573 |
| MEDICATION | |||||
| statin | 1614 (96.24) | 1553 (95.86) | 1609 (96.99) | 1610 (96.00) | 0.328 |
| β-blockers | 1481 (88.31) | 1473 (90.93) | 1517 (91.44) | 1539 (91.77) | 0.002 |
| CCB | 844 (50.33) | 816 (50.37) | 803 (48.40) | 874 (52.12) | 0.203 |
| PLATELET REACTIVITY | |||||
| MA(ADP), mm | 34.257 ± 16.963 | 35.729 ± 17.674 | 36.761 ± 17.924 | 36.988 ± 17.773 | <0.001 |
| LTPR | 677 (40.37) | 612 (37.78) | 600 (36.17) | 605 (36.08) | 0.035 |
| HTPR | 1237 (73.76) | 1137 (70.19) | 1108 (66.79) | 1110 (66.19) | <0.001 |
[i] BMI, body mass index; ACS, acute coronary syndrome; COPD, chronic obstructive pulmonary disease; CHD, coronary heart disease; PCI, percutaneous coronary intervention; CABG, coronary artery bypass graft; LVEF, left ventricle ejection fraction; PLT, platelet count; MPV, mean platelet volume; LDL-C, low-density lipoprotein cholesterol; HDL-C, high-density lipoprotein cholesterol; TC, total cholesterol; eGFR, estimated glomerular filtration rate; CCB, calcium channel blocker; MA(ADP), adenosine diphosphate (ADP)-induced platelet maximum amplitude; LTPR, low on-treatment platelet reactivity; HTPR, high on-treatment platelet reactivity.
Table 2
Logistic regression for LTPR.
| VARIABLES | UNIVARIATE REGRESSION | MULTIVARIATE REGRESSION | MULTIVARIATE REGRESSION | |||
|---|---|---|---|---|---|---|
| OR (95% CI) | P-VALUE | ADJUSTED OR (95% CI) | P-VALUE | ADJUSTED OR (95% CI) | P-VALUE | |
| Sex | 0.509 (0.448–0.579) | <0.001 | 1.114 (0.938–1.323) | 0.219 | 1.082 (0.912–1.283) | 0.366 |
| Age | 0.983 (0.978–0.988) | <0.001 | 0.993 (0.986–1.000) | 0.038 | 0.994 (0.987–1.000) | 0.058 |
| BMI | 0.999 (0.984–1.015) | 0.915 | — | — | — | — |
| ACS | 0.903 (0.817–0.998) | 0.046 | 1.058 (0.870–1.286) | 0.574 | 0.963 (0.866–1.071) | 0.488 |
| Smoking history | 1.336 (1.208–1.478) | <0.001 | 1.136 (0.952–1.355) | 0.157 | 1.012 (0.898–1.139) | 0.849 |
| Hyperlipidemia | 1.016 (0.913–1.131) | 0.765 | — | — | — | — |
| Hypertension | 0.910 (0.820–1.010) | 0.076 | — | — | — | — |
| COPD | 0.934 (0.665–1.313) | 0.696 | — | — | — | — |
| Family history of CHD | 1.019 (0.908–1.143) | 0.753 | — | — | — | — |
| Cerebrovascular disease | 0.830 (0.703–0.981) | 0.029 | 0.917 (0.771–1.091) | 0.329 | 0.915 (0.769–1.088) | 0.315 |
| Peripheral vascular disease | 0.990 (0.735–1.334) | 0.947 | — | — | — | — |
| Prior myocardial infarction | 1.138 (1.006–1.288) | 0.040 | 1.041 (0.902–1.202) | 0.579 | 1.041 (0.902–1.202) | 0.581 |
| Prior PCI | 1.179 (1.051–1.322) | 0.005 | 1.139 (1.005–1.290) | 0.042 | 1.139 (1.005–1.291) | 0.041 |
| Prior CABG | 0.953 (0.741–1.227) | 0.711 | — | — | — | — |
| LVEF | 1.009 (1.002–1.016) | 0.011 | 1.009 (1.001–1.017) | 0.027 | 1.009 (1.001–1.017) | 0.027 |
| Hemoglobin | 1.029 (1.026–1.033) | <0.001 | 1.028 (1.024–1.033) | <0.001 | 1.029 (1.024–1.033) | <0.001 |
| PLT | 0.998 (0.997–0.999) | <0.001 | 0.999 (0.998–1.000) | 0.008 | 0.999 (0.998–1.000) | 0.011 |
| MPV | 1.028 (0.973–1.085) | 0.326 | — | — | — | — |
| LDL-C | 0.875 (0.827–0.927) | <0.001 | 0.741 (0.586–0.938) | 0.013 | 0.861 (0.720–1.029) | 0.100 |
| HDL-C | 1.003 (0.835–1.205) | 0.975 | — | — | — | — |
| TC | 0.895 (0.853–0.938) | <0.001 | 1.150 (0.926–1.428) | 0.207 | 1.002 (0.853–1.176) | 0.983 |
| Triglyceride | 1.000 (0.954–1.048) | 0.994 | — | — | — | — |
| Glucose | 0.956 (0.931–0.981) | <0.001 | 0.951 (0.925–0.977) | <0.001 | 0.949 (0.923–0.976) | <0.001 |
| eGFR | 1.007 (1.004–1.011) | <0.001 | 0.999 (0.994–1.003) | 0.599 | 0.999 (0.994–1.003) | 0.609 |
| statin | 0.837 (0.646–1.083) | 0.176 | — | — | — | — |
| β-blockers | 0.916 (0.773–1.084) | 0.307 | — | — | — | — |
| CCB | 1.101 (0.996–1.216) | 0.059 | — | — | — | — |
| RC, mmol/L | 0.865 (0.755–0.991) | 0.037 | 0.761 (0.609–0.950) | 0.016 | — | — |
| RC | 0.035 | |||||
| Q1 | Reference | — | — | Reference | ||
| Q2 | 0.897 (0.780–1.032) | 0.127 | — | — | 0.896 (0.775–1.036) | 0.140 |
| Q3 | 0.837 (0.728–0.962) | 0.013 | — | — | 0.853 (0.735–0.990) | 0.036 |
| Q4 | 0.834 (0.725–0.958) | 0.011 | — | — | 0.840 (0.707–0.999) | 0.049 |
[i] BMI, body mass index; ACS, acute coronary syndrome; COPD, chronic obstructive pulmonary disease; CHD, coronary heart disease; PCI, percutaneous coronary intervention; CABG, coronary artery bypass graft; LVEF, left ventricle ejection fraction; PLT, platelet count; MPV, mean platelet volume; LDL-C, low-density lipoprotein cholesterol; HDL-C, high-density lipoprotein cholesterol; TC, total cholesterol; RC, remnant cholesterol; eGFR, estimated glomerular filtration rate; CCB, calcium channel blocker; MA(ADP), adenosine diphosphate (ADP)-induced platelet maximum amplitude; LTPR, low on-treatment platelet reactivity; HTPR, high on-treatment platelet reactivity.
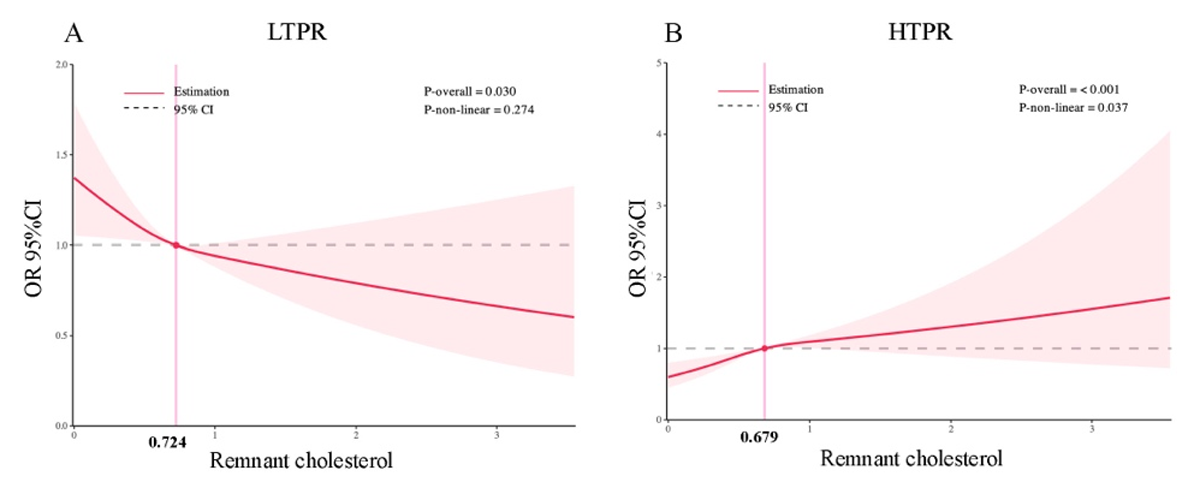
Figure 2
Restricted cubic spline curves of remnant cholesterol for LTPR and HTPR. CI, confidence interval; OR, odd ratio.
Table 3
Logistic regression for HTPR.
| VARIABLES | UNIVARIATE REGRESSION | MULTIVARIATE REGRESSION | MULTIVARIATE REGRESSION | |||
|---|---|---|---|---|---|---|
| OR (95% CI) | P-VALUE | ADJUSTED OR (95% CI) | P-VALUE | ADJUSTED OR (95% CI) | P-VALUE | |
| Sex | 0.325 (0.288–0.366) | <0.001 | 0.649 (0.548–0.769) | <0.001 | 0.673 (0.569–0.796) | <0.001 |
| Age | 1.204 (1.019–1.029) | <0.001 | 1.008 (1.001–1.016) | 0.024 | 1.008 (1.001–1.015) | 0.028 |
| BMI | 0.997 (0.981–1.014) | 0.750 | — | — | — | — |
| ACS | 1.178 (1.059–1.309) | 0.002 | 1.070 (0.954–1.200) | 0.250 | 1.069 (0.953–1.199) | 0.256 |
| Smoking history | 0.595 (0.536–0.661) | <0.001 | 0.996 (0.872–1.136) | 0.948 | 0.995 (0.872–1.135) | 0.940 |
| Hyperlipidemia | 0.967 (0.865–1.081) | 0.557 | — | — | — | — |
| Hypertension | 1.149 (1.029–1.283) | 0.014 | 0.977 (0.868–1.100) | 0.703 | 0.978 (0.868–1.101) | 0.709 |
| COPD | 1.093 (0.771–1.549) | 0.617 | — | — | — | — |
| Family history of CHD | 0.964 (0.854–1.088) | 0.552 | — | — | — | — |
| Cerebrovascular disease | 1.141 (0.964–1.349) | 0.124 | — | — | — | — |
| Peripheral vascular disease | 1.263 (0.934–1.707) | 0.129 | — | — | — | — |
| Prior myocardial infarction | 0.776 (0.678–0.889) | <0.001 | 0.971 (0.834–1.132) | 0.708 | 0.970 (0.832–1.130) | 0.692 |
| Prior PCI | 0.823 (0.727–0.931) | 0.002 | 0.908 (0.791–1.043) | 0.174 | 0.911(0.793–1.046) | 0.187 |
| Prior CABG | 0.823 (0.626–1.082) | 0.163 | — | — | — | — |
| LVEF | 0.995 (0.988–1.002) | 0.194 | — | — | — | — |
| Hemoglobin | 0.961 (0.958–0.965) | <0.001 | 0.967 (0.963–0.971) | <0.001 | 0.966 (0.962–0.971) | <0.001 |
| PLT | 1.005 (1.004–1.006) | <0.001 | 1.004 (1.003–1.005) | <0.001 | 1.004 (1.003–1.005) | <0.001 |
| MPV | 0.970 (0.916–1.027) | 0.298 | — | — | — | — |
| LDL-C | 1.198 (1.131–1.269) | <0.001 | 1.434 (1.113–1.848) | 0.005 | 1.213 (0.997–1.476) | 0.054 |
| HDL-C | 1.159 (0.957–1.403) | 0.132 | — | — | — | — |
| TC | 1.180 (1.125–1.239) | <0.001 | 0.834 (0.660–1.054) | 0.129 | 0.968 (0.811–1.155) | 0.718 |
| Triglyceride | 1.030 (0.981–1.081) | 0.239 | — | — | — | — |
| Glucose | 1.063 (1.036–1.091) | <0.001 | 1.067 (1.038–1.098) | <0.001 | 1.069 (1.039–1.099) | <0.001 |
| eGFR | 0.988 (0.985–0.992) | <0.001 | 0.999 (0.994–1.003) | 0.570 | 0.999 (0.994–1.003) | 0.619 |
| statin | 1.370 (1.021–1.839) | 0.036 | 1.433 (1.049–1.958) | 0.024 | 1.433 (1.049–1.957) | 0.024 |
| β-blockers | 1.113 (0.928–1.336) | 0.247 | — | — | — | — |
| CCB | 0.970 (0.874–1.076) | 0.565 | — | — | — | — |
| RC, mmol/L | 1.251 (1.093–1.430) | 0.001 | 1.461 (1.151–1.855) | 0.002 | — | — |
| RC | ||||||
| Q1 | Reference | — | — | Reference | ||
| Q2 | 1.194 (1.026–1.391) | 0.022 | — | — | 1.193 (1.015–1.402) | 0.032 |
| Q3 | 1.398 (1.204–1.623) | <0.001 | — | — | 1.356 (1.152–1.596) | <0.001 |
| Q4 | 1.436 (1.238–1.666) | <0.001 | — | — | 1.404 (1.164–1.694) | <0.001 |
[i] BMI, body mass index; ACS, acute coronary syndrome; COPD, chronic obstructive pulmonary disease; CHD, coronary heart disease; PCI, percutaneous coronary intervention; CABG, coronary artery bypass graft; LVEF, left ventricle ejection fraction; PLT, platelet count; MPV, mean platelet volume; LDL-C, low-density lipoprotein cholesterol; HDL-C, high-density lipoprotein cholesterol; TC, total cholesterol; RC, remnant cholesterol; eGFR, estimated glomerular filtration rate; CCB, calcium channel blocker; MA(ADP), adenosine diphosphate (ADP)-induced platelet maximum amplitude; LTPR, low on-treatment platelet reactivity; HTPR, high on-treatment platelet reactivity.
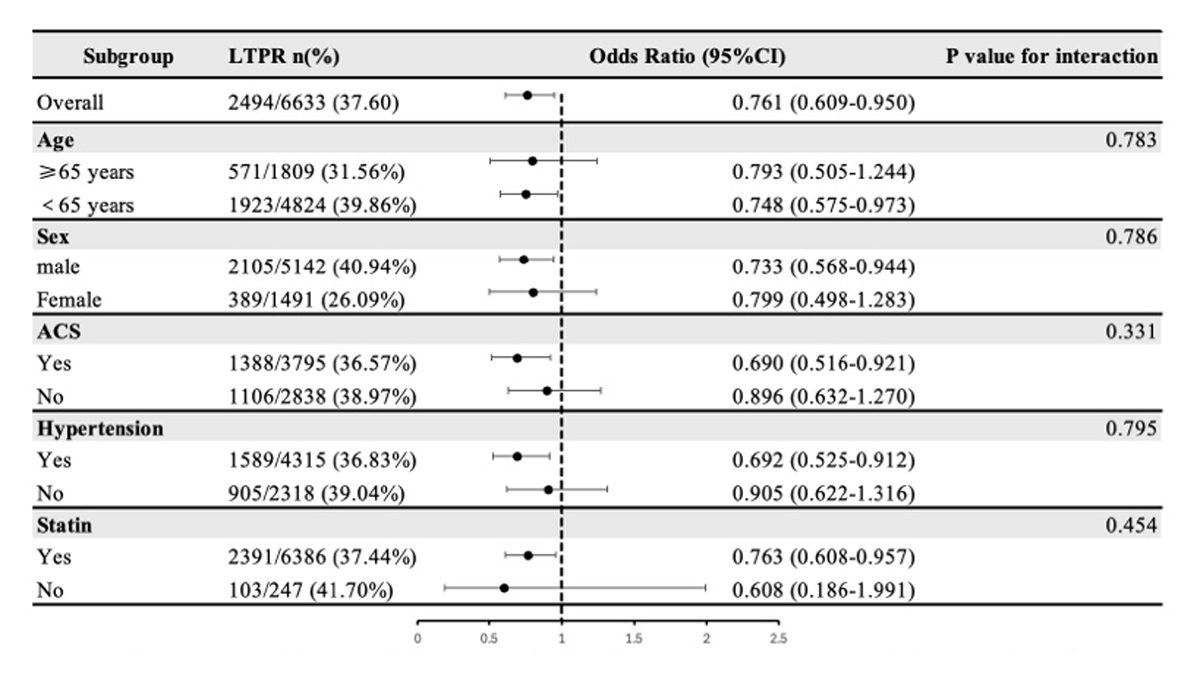
Figure 3
Subgroup analysis of the association between remnant cholesterol and LTPR.

Figure 4
Subgroup analysis of the association between remnant cholesterol and HTPR.