
Table 1
National burden of cardiovascular diseases (CVDs) in Iran in 1990 and 2021.
| MEASURE | METRIC | YEAR | PERCENTAGE CHANGE | |||||||
|---|---|---|---|---|---|---|---|---|---|---|
| 1990 | 2021 | |||||||||
| BOTH | FEMALE | MALE | BOTH | FEMALE | MALE | BOTH | FEMALE | MALE | ||
| Deaths | All ages Number | 86526.77 (81550.86 to 91001.13) | 38607.69 (35583.38 to 41112.91) | 47919.08 (44256.07 to 51426.68) | 169581.89 (154573.58 to 180461.01) | 79336.39 (70863.81 to 85675.66) | 90245.5 (82994.76 to 96221.33) | 95.99 (83.31 to 107.56) | 105.49 (91.49 to 121.0) | 88.33 (71.91 to 104.18) |
| Deaths | Age-standardized Rate | 446.27 (411.54 to 471.33) | 432.79 (393.31 to 463.58) | 452.27 (413.56 to 484.06) | 254.52 (230.23 to 271.35) | 253.68 (223.21 to 274.29) | 258.76 (235.68 to 276.8) | –42.97 (–45.91 to –40.09) | –41.38 (–44.86 to –37.4) | –42.79 (–47.14 to –38.21) |
| DALYs (Disability-Adjusted Life Years) | All ages Number | 2425354.89 (2298593.02 to 2558142.31) | 1023415.86 (951893.81 to 1092198.78) | 1401939.03 (1300850.55 to 1503873.77) | 3727868.15 (3469264.15 to 3945805.21) | 1581366.29 (1450954.14 to 1699692.15) | 2146501.86 (2000574.93 to 2281116.68) | 53.7 (44.83 to 62.9) | 54.52 (42.8 to 66.42) | 53.11 (40.16 to 65.1) |
| DALYs (Disability-Adjusted Life Years) | Age-standardized Rate | 9095.64 (8591.46 to 9580.39) | 8252.1 (7668.7 to 8776.34) | 9789.6 (9037.24 to 10510.78) | 4977.43 (4594.49 to 5292.4) | 4455.22 (4057.54 to 4796.91) | 5524.4 (5118.53 to 5882.89) | –45.28 (–48.06 to –42.42) | –46.01 (–49.33 to –42.47) | –43.57 (–47.95 to –39.28) |
| YLDs (Years Lived with Disability) | All ages Number | 127073.37 (93356.11 to 167448.32) | 59742.55 (44305.93 to 78170.59) | 67330.82 (49066.37 to 89017.19) | 331448.73 (236007.22 to 443324.68) | 150297.95 (107863.03 to 198798.59) | 181150.78 (128620.56 to 243998.79) | 160.83 (147.27 to 176.28) | 151.58 (136.78 to 169.1) | 169.05 (155.11 to 183.85) |
| YLDs (Years Lived with Disability) | Age-standardized Rate | 381.35 (281.07 to 500.78) | 358.1 (265.75 to 463.8) | 405.53 (297.69 to 536.77) | 407.27 (291.48 to 540.79) | 365.83 (264.52 to 481.51) | 448.37 (318.29 to 598.16) | 6.8 (2.36 to 11.12) | 2.16 (–2.77 to 6.9) | 10.56 (6.25 to 15.15) |
| YLLs (Years of Life Lost) | All ages Number | 2298281.52 (2176983.69 to 2413175.76) | 963673.31 (895810.78 to 1032014.58) | 1334608.21 (1236203.33 to 1432838.05) | 3396419.42 (3164494.48 to 3600600.48) | 1431068.34 (1305443.53 to 1534490.9) | 1965351.08 (1847758.35 to 2089599.2) | 47.78 (39.03 to 57.22) | 48.5 (36.47 to 61.37) | 47.26 (34.33 to 59.52) |
| YLLs (Years of Life Lost) | Age-standardized Rate | 8714.29 (8206.47 to 9172.56) | 7894.0 (7283.38 to 8412.93) | 9384.08 (8649.02 to 10060.15) | 4570.16 (4214.83 to 4850.91) | 4089.38 (3698.5 to 4395.72) | 5076.03 (4746.99 to 5399.5) | –47.56 (–50.37 to –44.56) | –48.2 (–51.66 to –44.33) | –45.91 (–50.38 to –41.67) |
| Prevalence | All ages Number | 2938840.14 (2692829.54 to 3200351.41) | 1278346.83 (1172228.22 to 1385506.43) | 1660493.31 (1516851.4 to 1811824.08) | 8306158.04 (7542767.84 to 9207256.92) | 3772277.45 (3436219.84 to 4180431.67) | 4533880.59 (4102813.74 to 5042131.13) | 182.63 (172.13 to 194.39) | 195.09 (183.06 to 208.76) | 173.04 (162.36 to 185.24) |
| Prevalence | Age-standardized Rate | 9955.98 (9174.88 to 10821.79) | 8971.07 (8248.15 to 9721.34) | 10876.22 (9993.32 to 11835.32) | 10385.87 (9450.63 to 11390.38) | 9431.32 (8592.39 to 10342.17) | 11350.32 (10307.17 to 12484.58) | 4.32 (1.31 to 8.05) | 5.13 (1.92 to 9.06) | 4.36 (1.27 to 8.15) |
| Incidence | All ages Number | 355773.62 (301351.93 to 420979.3) | 147928.71 (127961.55 to 171702.96) | 207844.91 (173625.12 to 250193.2) | 923521.56 (782697.44 to 1088274.77) | 402223.3 (342232.33 to 468701.65) | 521298.26 (439580.4 to 620413.55) | 159.58 (149.59 to 170.45) | 171.9 (162.98 to 181.64) | 150.81 (139.55 to 163.33) |
| Incidence | Age-standardized Rate | 1337.36 (1121.69 to 1559.59) | 1167.12 (997.32 to 1351.08) | 1493.54 (1248.8 to 1754.36) | 1197.14 (1008.83 to 1398.38) | 1060.46 (906.87 to 1234.36) | 1335.7 (1116.68 to 1574.31) | –10.48 (–12.15 to –8.77) | –9.14 (–10.81 to –7.5) | –10.57 (–12.77 to –8.34) |
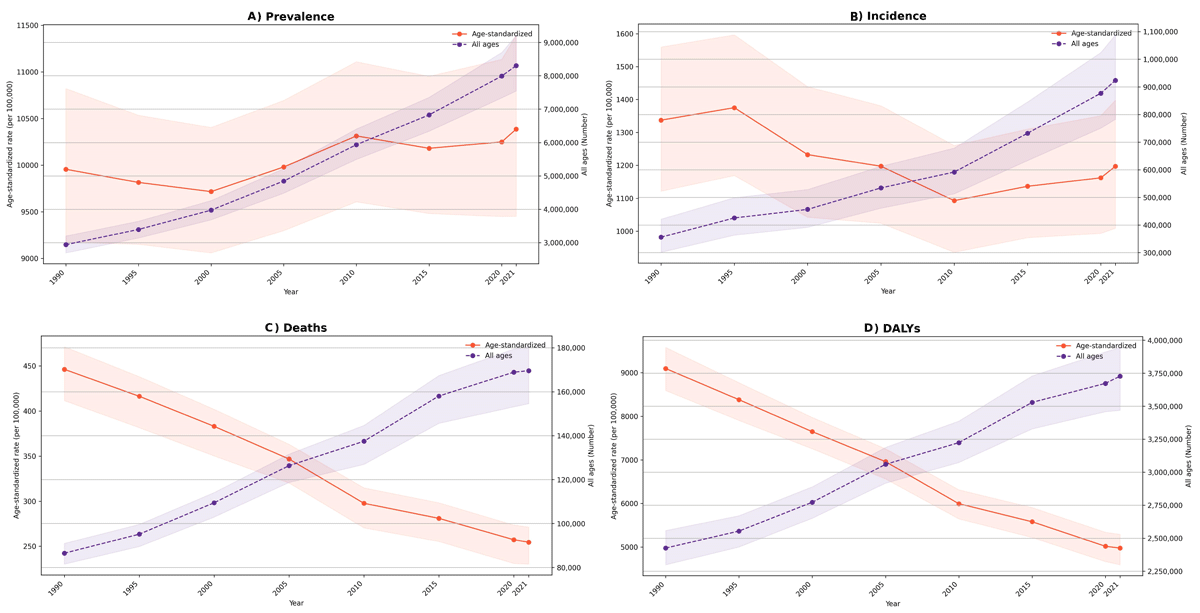
Figure 1
Time trend of burden measures of cardiovascular diseases (CVDs) in Iran from 1990 to 2021.
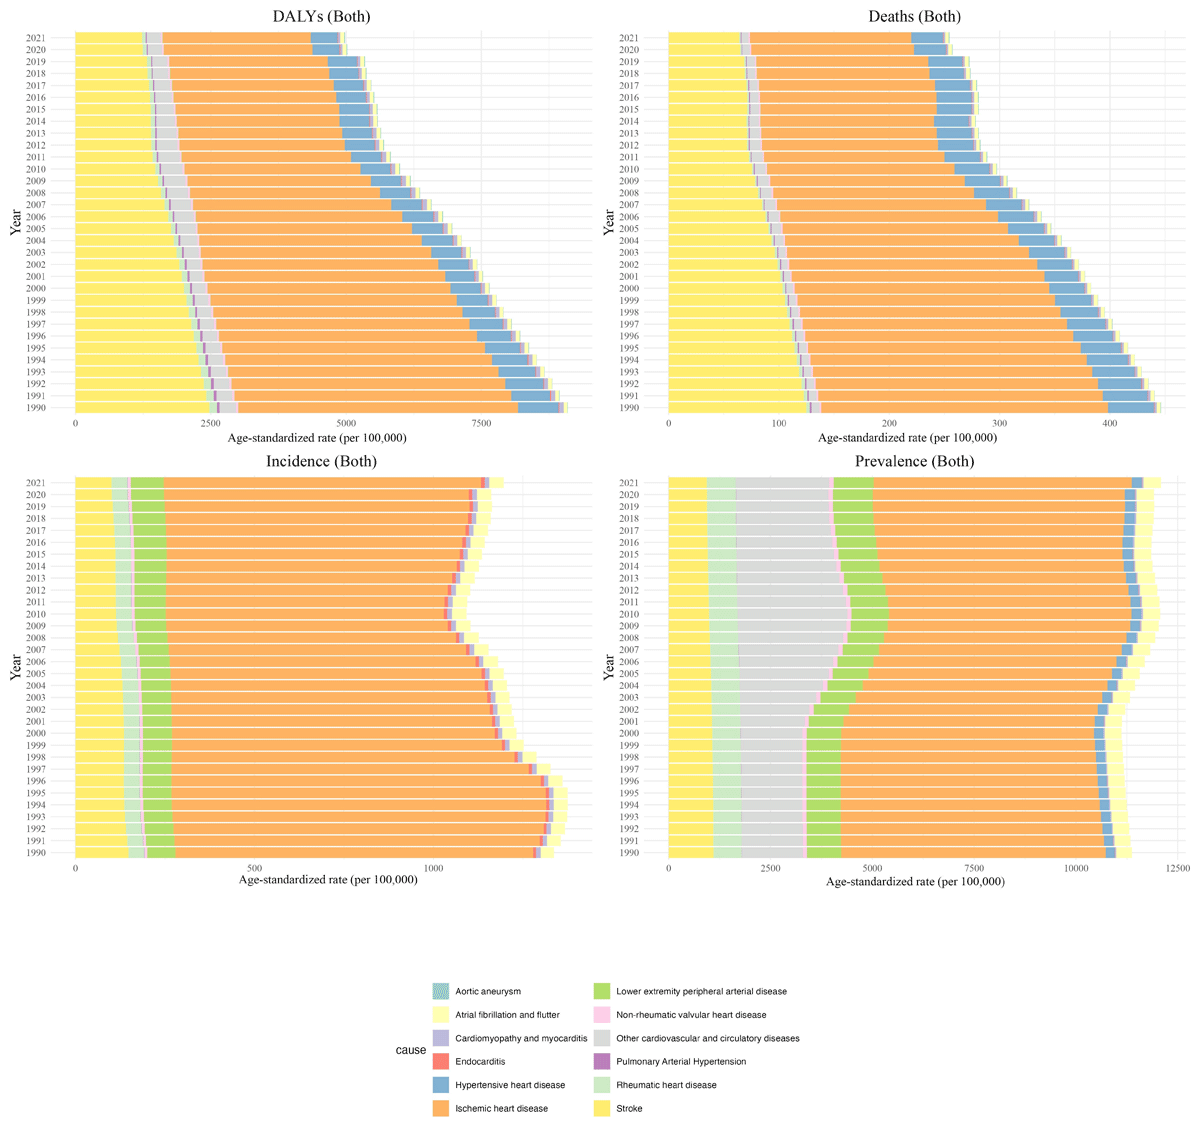
Figure 2
Time trend of burden measures of cardiovascular diseases (CVDs) by cause in Iran from 1990 to 2021.
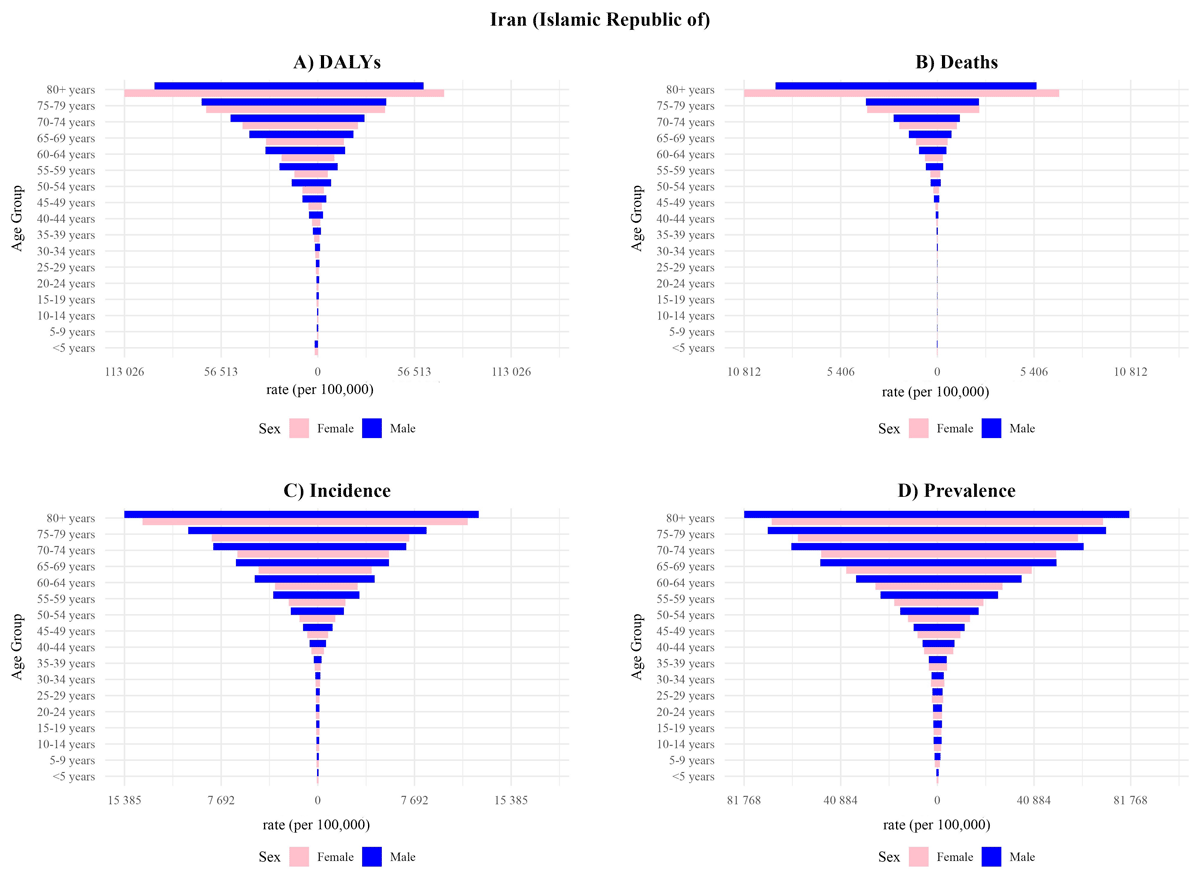
Figure 3
The comparison of burden measures of cardiovascular diseases (CVDs) in different age groups in Iran between 1990 and 2021.
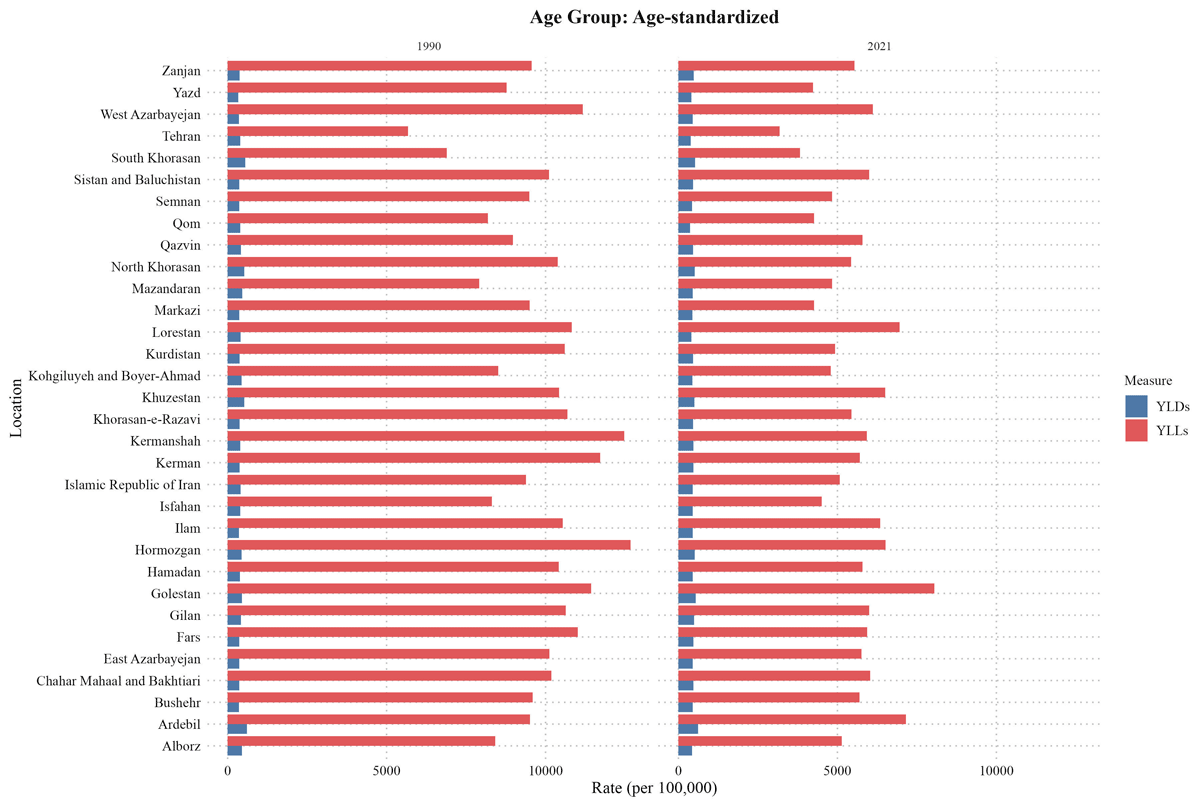
Figure 4
Years of life lost (YLL) and years lived with disability (YLD) comparison in Iran and its provinces between 1990 and 2021.
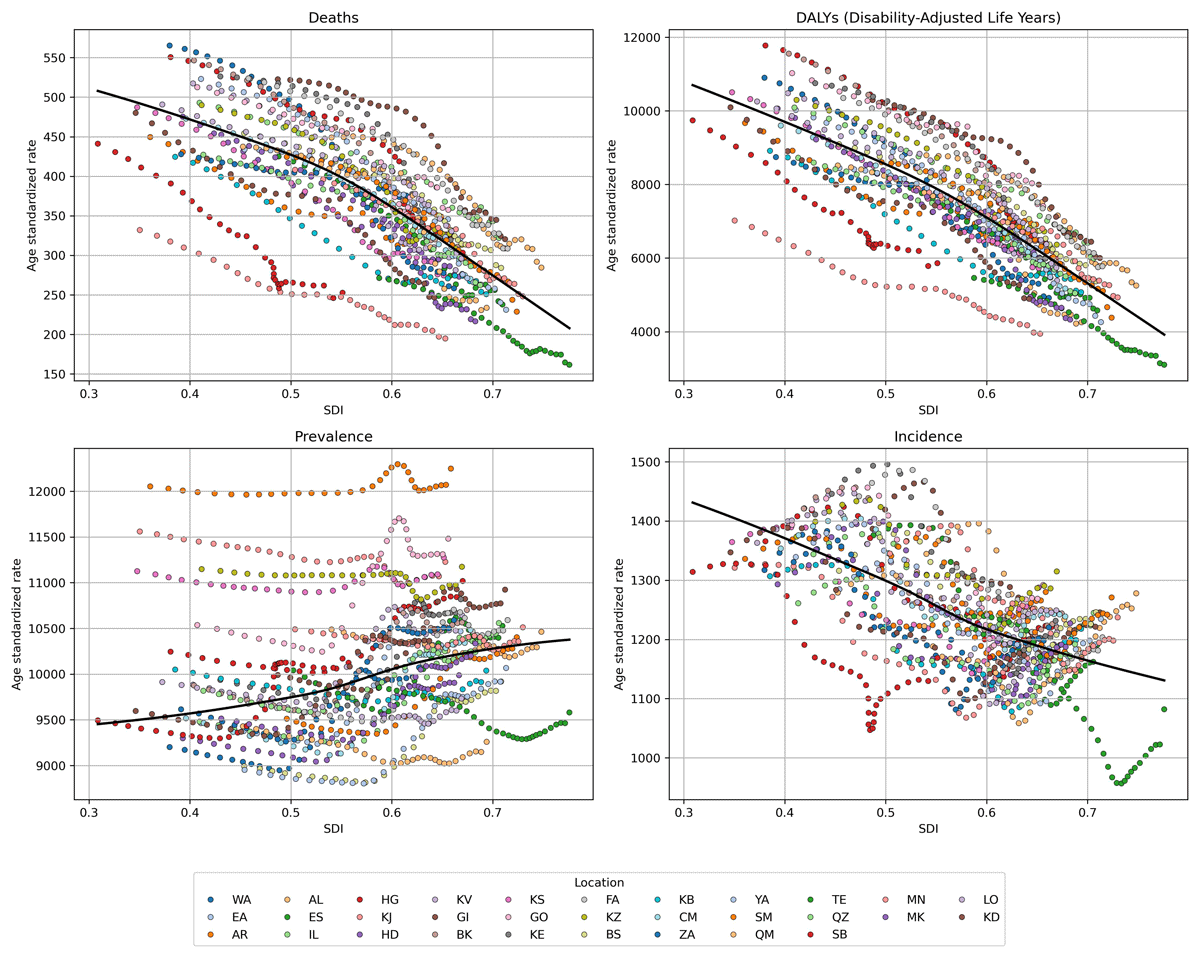
Figure 5
The association of burden measures of cardiovascular diseases (CVDs) with socio-demographic index (SDI) of provinces in Iran from 1990 to 2021. (Alborz: AL, Ardabil: AR, Kermanshah: BK, Bushehr: BS, Chaharmahal and Bakhtiari: CM, East Azerbaijan: EA, Isfahan: ES, Fars: FA, Gilan: GI, Golestan: GO, Hamadan: HD, Hormozgan: HG, Ilam: IL, Kohgiluyeh and Boyer-Ahmad: KB, Kurdistan: KD, Kerman: KE, South Khorasan: KJ, North Khorasan: KS, Khorasan Razavi: KV, Khuzestan: KZ, Lorestan: LO, Markazi: MK, Mazandaran: MN, Qom: QM, Qazvin: QZ, Sistan and Baluchestan: SB, Semnan: SM, Tehran: TE, West Azerbaijan: WA, Yazd: YA, Zanjan: ZA).
Table 2
Decomposition analysis of cardiovascular diseases (CVDs) incidence by sex between 1990 to 2021 in Iran.
| SEX | NEW CASES | EXPECTED NEW CASES | CONTRIBUTION OF EACH FACTOR | OVERALL CHANGE (%) | ||||
|---|---|---|---|---|---|---|---|---|
| 1990 | 2021 | POPULATION GROWTH | POPULATION GROWTH + AGING | POPULATION GROWTH (%) | AGE STRUCTURE CHANGE (%) | INCIDENCE RATE CHANGE (%) | ||
| Both | 355,774 | 923,522 | 531,827 | 1,016,378 | 49.5 | 136.2 | –26.1 | 159.6 |
| Female | 147,929 | 402,223 | 221,770 | 440,182 | 49.9 | 147.6 | –25.6 | 171.9 |
| Male | 207,845 | 521,298 | 309,832 | 576,195 | 49.1 | 128.2 | –26.5 | 150.8 |
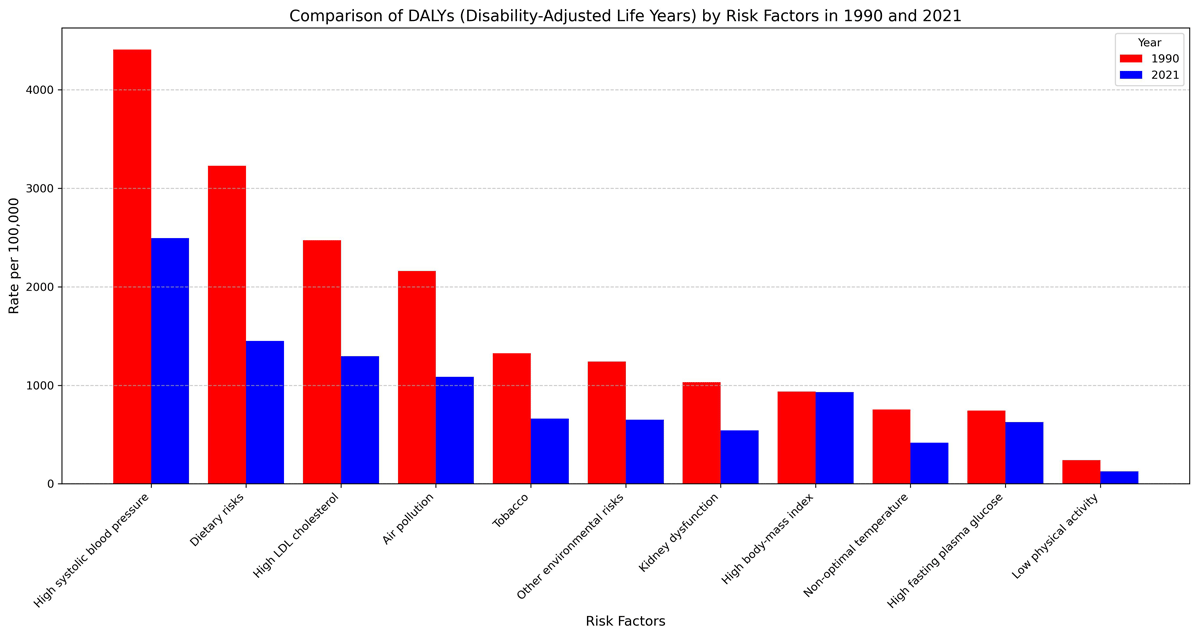
Figure 6
Comparison of disability-adjusted life years (DALYs) attributable to each risk factor in Iran between 1990 and 2021.