
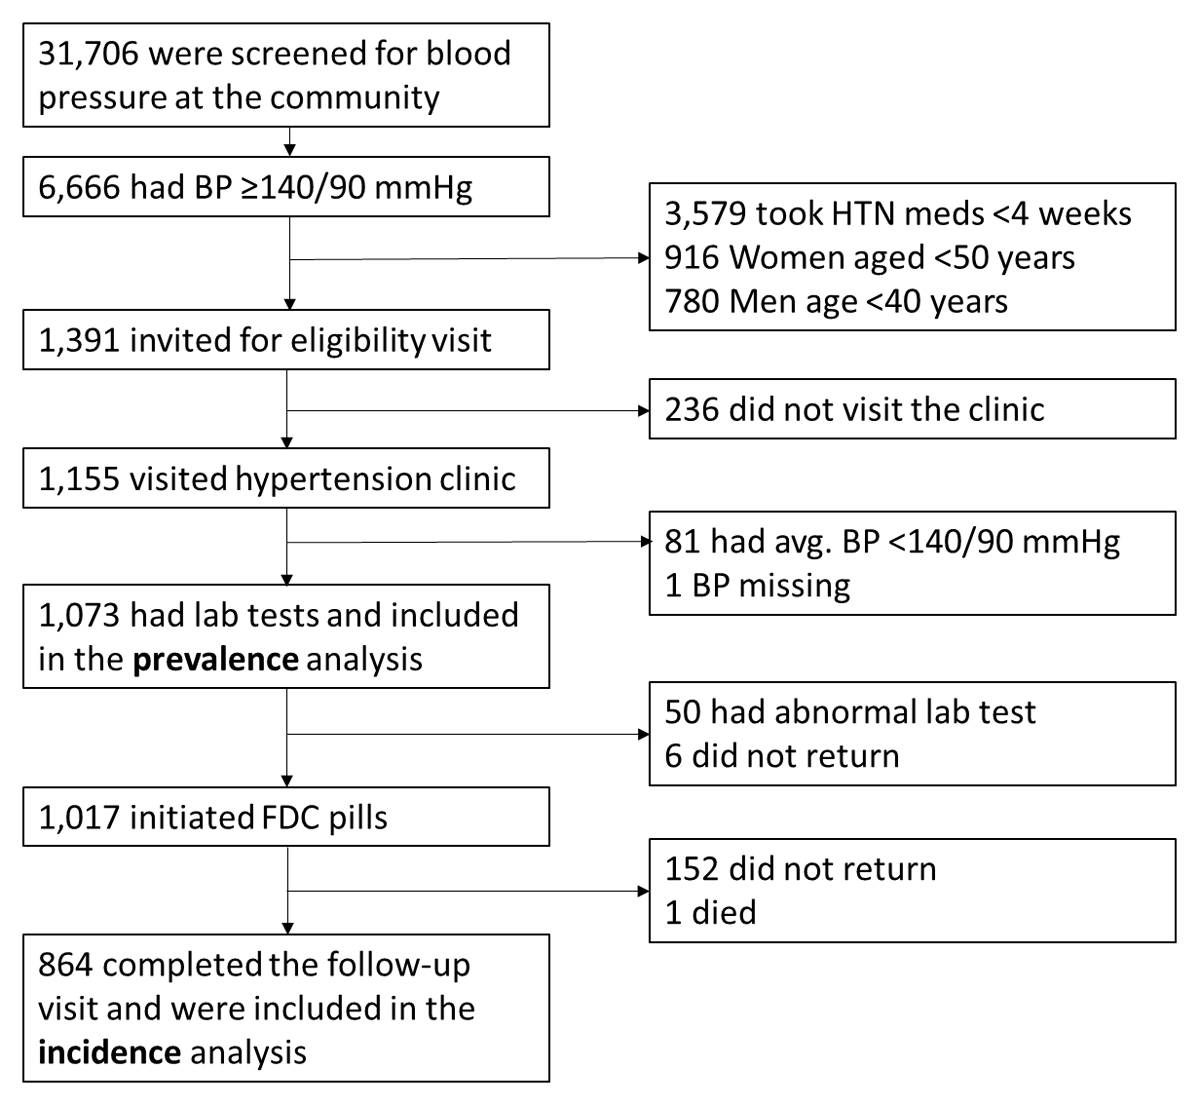
Figure 1
Cohort diagram.
Abbreviations: BP, blood pressure; HTN, hypertension; FDC, fixed-dose combination.
Table 1
Characteristics of 1,073 adults with hypertension in Bangladesh in community BP screening in the overall population and stratified by the status of dyskalemia.
| CHARACTERISTICS | OVERALL (n = 1073) | PREVALENT DYSKALEMIA STATUS AT SCREENING | ||
|---|---|---|---|---|
| HYPOKALEMIA < 3 MMOL/L (n = 17) | NORMOKALEMIA 3.0 TO 5.5 MMOL/L (n = 1054) | HYPERKALEMIA* > 5.5 MMOL/L (n = 2) | ||
| Age years, mean (SD) | 54 (9.5) | 54 (7.9) | 54 (9.5) | – |
| Male gender, no (%) | 761 (71) | 10 (59) | 750 (71) | – |
| Height cm, mean (SD) | 159 (8.9) | 155 (7.3) | 159 (8.9) | – |
| Weight kg, mean (SD) | 64 (12) | 60 (9.5) | 64 (12) | – |
| Body mass index kg/m2, mean (SD) | 25 (4.0) | 25 (2.7) | 25 (4.0) | – |
| SV Systolic BP mmHg, mean (SD) | 159 (13) | 169 (13) | 159 (13) | – |
| SV Diastolic BP mmHg, mean (SD) | 95 (10) | 101 (13) | 95 (10) | – |
| EV Systolic BP mmHg, mean (SD) | 155 (13) | 163 (14) | 155 (13) | – |
| EV Diastolic BP mmHg, mean (SD) | 93 (9.9) | 98 (14) | 93 (9.8) | – |
| Average of SV and EV – systolic BP, mean (SD) | 157 (12) | 166 (13) | 157 (12) | – |
| Average diastolic BP, mean (SD) | 94 (9.3) | 99 (13) | 94 (9.2) | – |
| Medical history, no (%) | ||||
| No history | 891 (83) | 9 (53) | 881 (84) | |
| Heart failure | 0 (0.0) | 0 (0.0) | 0 (0.0) | – |
| Myocardial infarction | 1 (0.1) | 0 (0.0) | 1 (0.1) | – |
| Stroke | 4 (0.4) | 1 (5.9) | 3 (0.3) | – |
| Diabetes | 175 (16) | 7 (41) | 166 (16) | – |
| Kidney disease | 2 (0.2) | 0 (0.0) | 2 (0.2) | – |
| COPD, Asthma | 0 (0.0) | 0 (0.0) | 0 (0.0) | – |
| Have you ever smoked?, no (%) | ||||
| Never | 735 (69) | 13 (76) | 720 (68) | – |
| Former | 112 (10) | 1 (6) | 110 (10) | – |
| Current | 225 (21) | 3 (18) | 222 (21) | – |
| Creatinine clearance (CrCl), ml/min mean (SD) | 70 (22) | 58 (17) | 70 (22) | – |
| Dipstick proteinuria result?, no (%) | ||||
| Negative | 1037 (97) | 15 (88) | 1019 (97) | – |
| Trace | 12 (1) | 0 (0) | 12 (1) | – |
| 1+ | 20 (2) | 2 (12) | 18 (2) | – |
| 2+ | 3 (0) | 0 (0) | 3 (0) | – |
| 3+ | 2 (0) | 0 (0) | 2 (0) | – |
[i] *Data are not shown for those with hyperkalemia due to small sample size (n = 2).
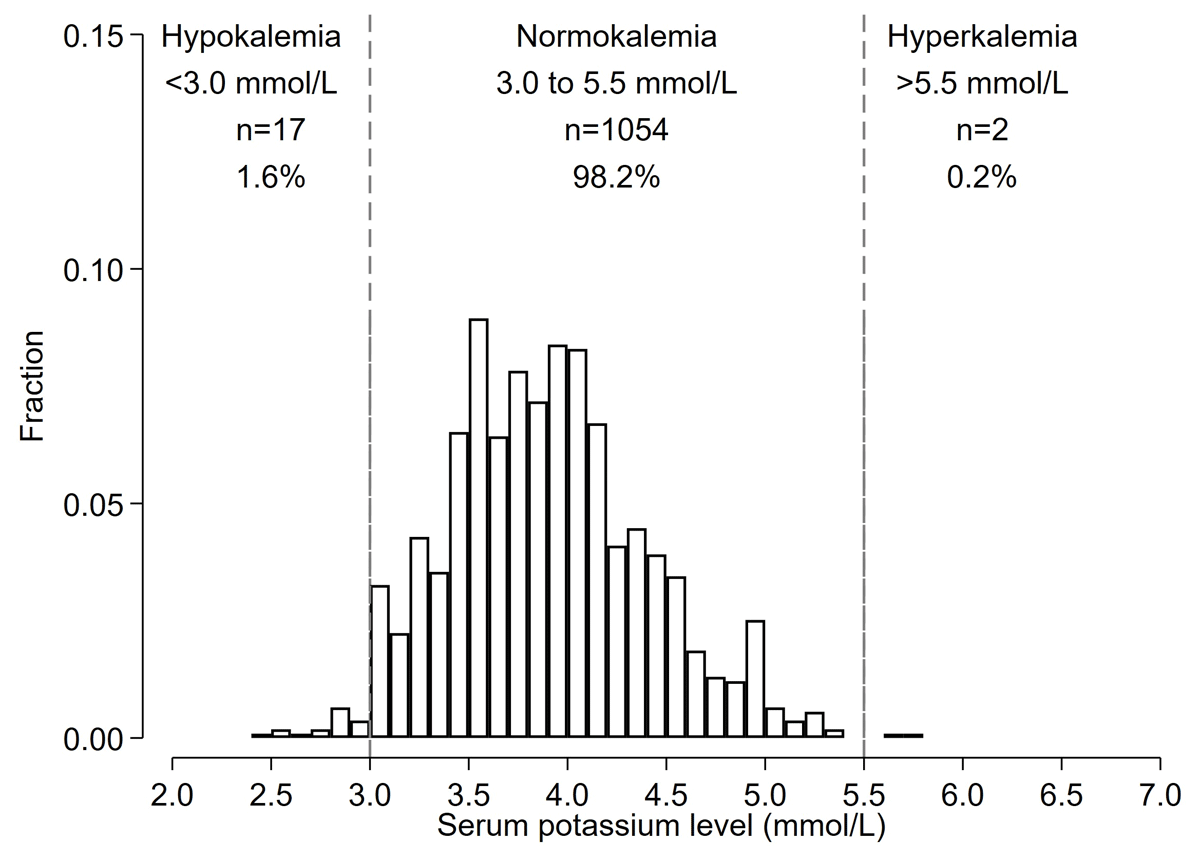
Figure 2
Histograms of baseline potassium levels among Bangladeshi adults with hypertension identified during screening (Prevalence analysis).
*Histogram shows the distribution of potassium levels prior to the start of FDC pills among those who were candidates for starting FDC pills (n = 1,073).
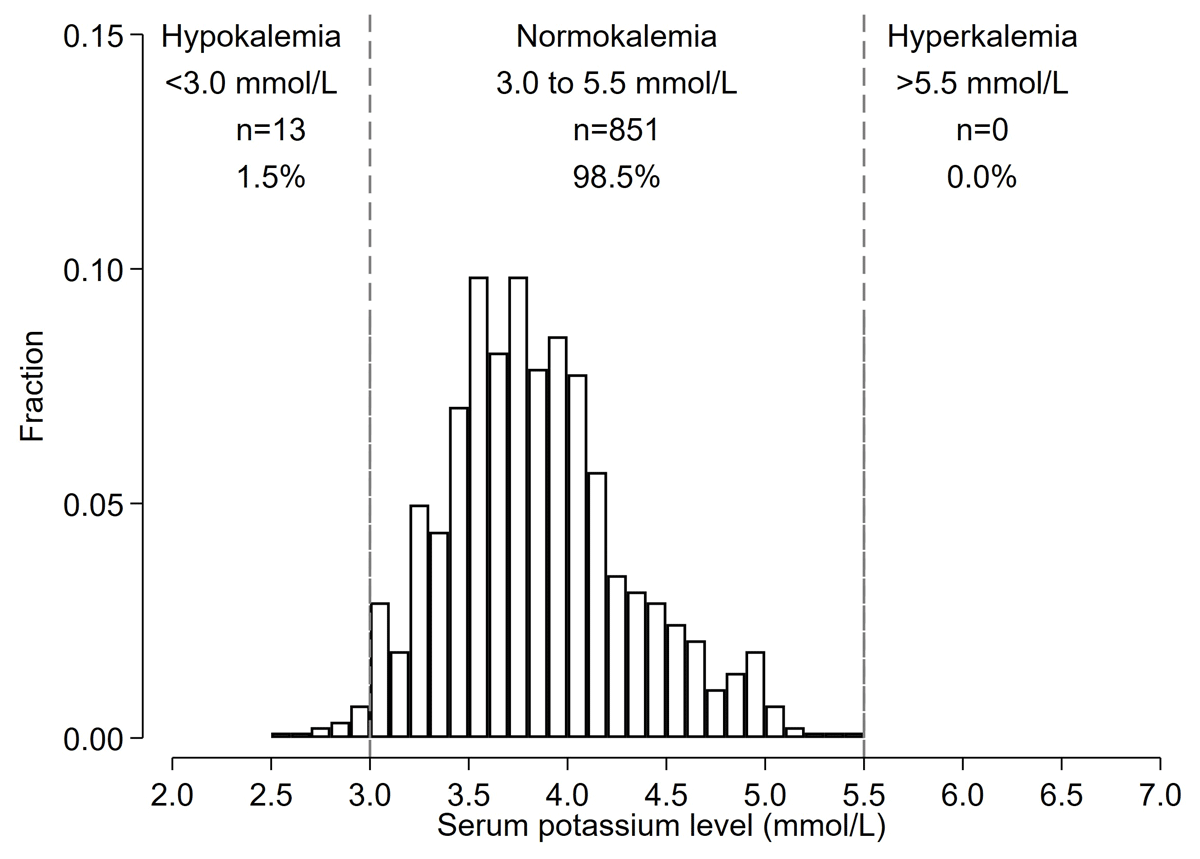
Figure 3
Histograms of potassium levels at follow-up among Bangladeshi adults with hypertension who started FDC (Incidence Analysis).
*Among 1,017 participants who initiated FDC pills, 864 completed the follow-up and are included in the histogram.
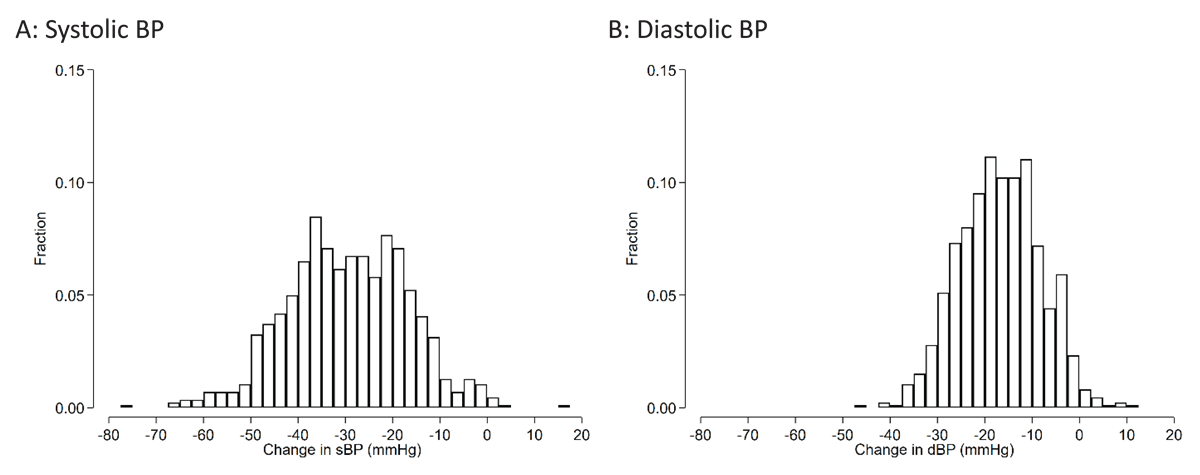
Figure 4
Histograms of changes in blood pressure between baseline and follow-up visits among Bangladeshi adults with hypertension who started FDC.
The mean systolic BP change (95%CI) was –29.8 (–30.6 to –28.9) mmHg. The mean diastolic BP change was –16.9 (–17.5 to –16.4) mmHg.