
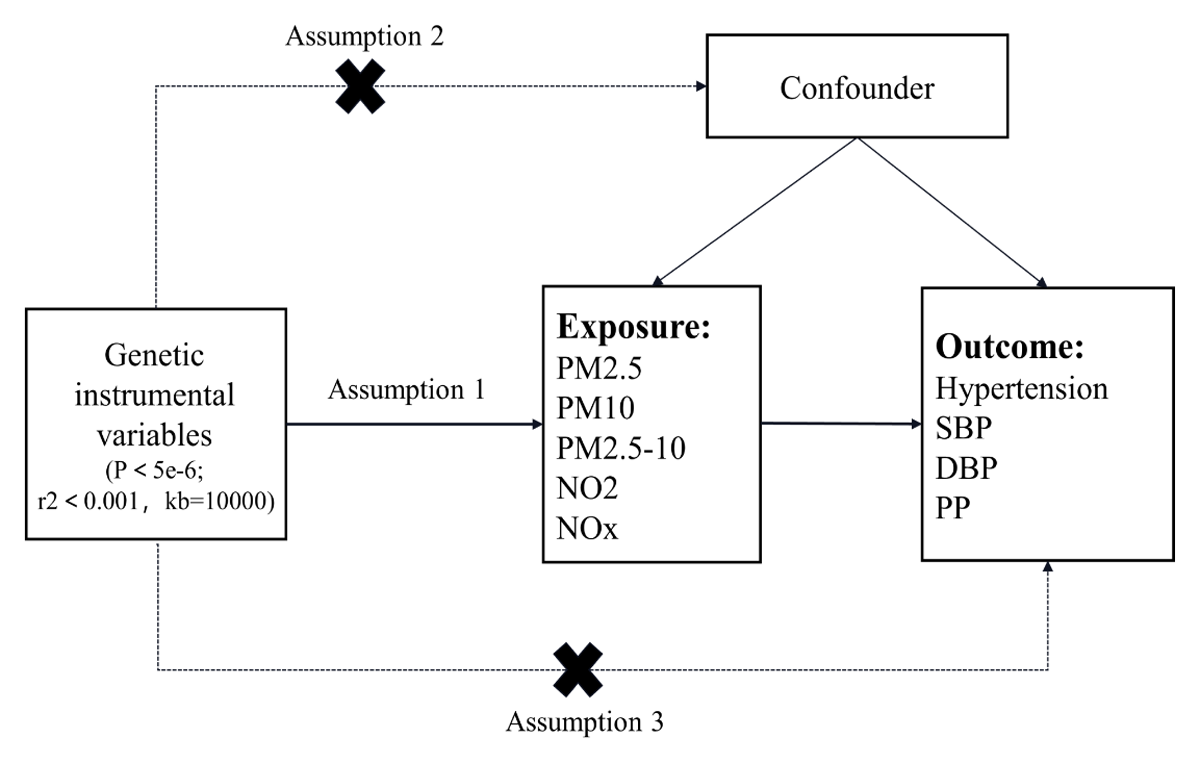
Figure 1
Flow chart of MR Study design.
Note: The MR study includes assumptions 1, 2, and 3. The solid line represents a direct causal effect, where the instrumental variable is strongly related to the exposure level and affects the outcome through the exposure. The dashed line indicates that the instrumental variable is not associated with any confounders.
Table 1
Genome-wide association study (GWAS) for air pollutants and blood pressure.
| GWAS ID | YEAR | TRAIT | SAMPLE SIZE | nSNP | POPULATION |
|---|---|---|---|---|---|
| ukb-b-10817 | 2018 | PM2.5 | 423,796 | 9,851,867 | European |
| ukb-b-18469 | 2018 | PM10 | 423,796 | 9,851,867 | European |
| ukb-b-12963 | 2018 | PM2.5–10 | 423,796 | 9,851,867 | European |
| ukb-b-2618 | 2018 | NO2 | 456,380 | 9,851,867 | European |
| ukb-b-12417 | 2018 | NOx | 456,380 | 9,851,867 | European |
| finn-b-I9_HYTENS | 2021 | Hypertension | 218,754 | 16,380,466 | European |
| ieu-b-38 | 2018 | SBP | 757,601 | 7,088,083 | European |
| ieu-b-39 | 2018 | DBP | 757,601 | 7,160,619 | European |
| ebi-a-CST90018970 | 2021 | PP | 360,863 | 19,047,322 | European |
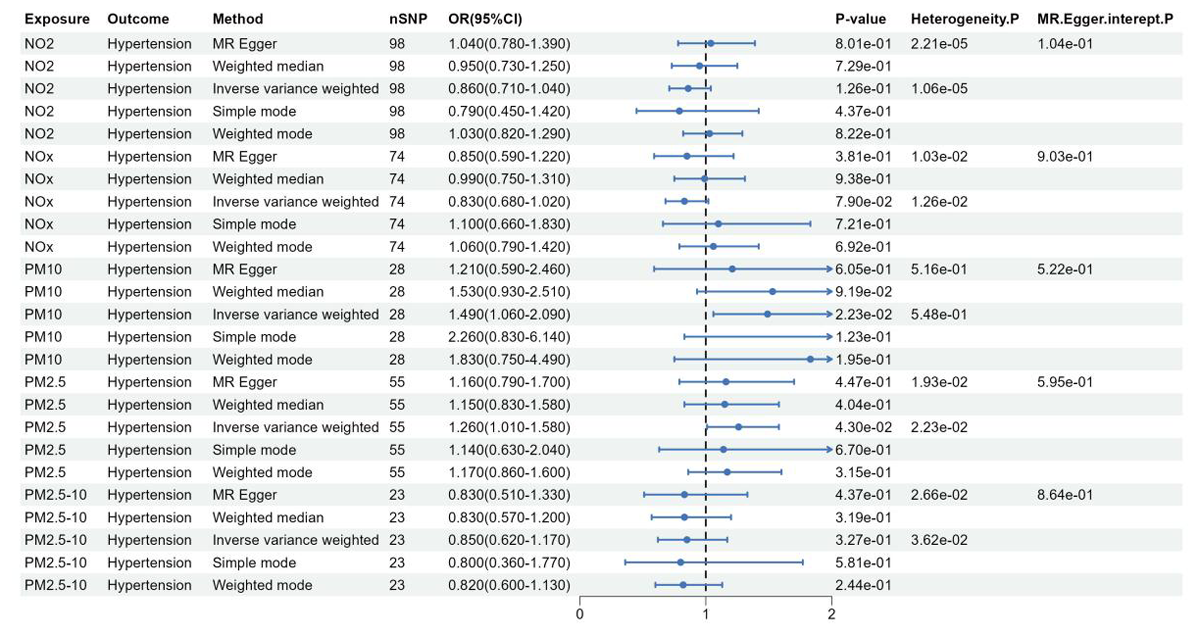
Figure 2
Forest plot of the association between air pollution and hypertension.
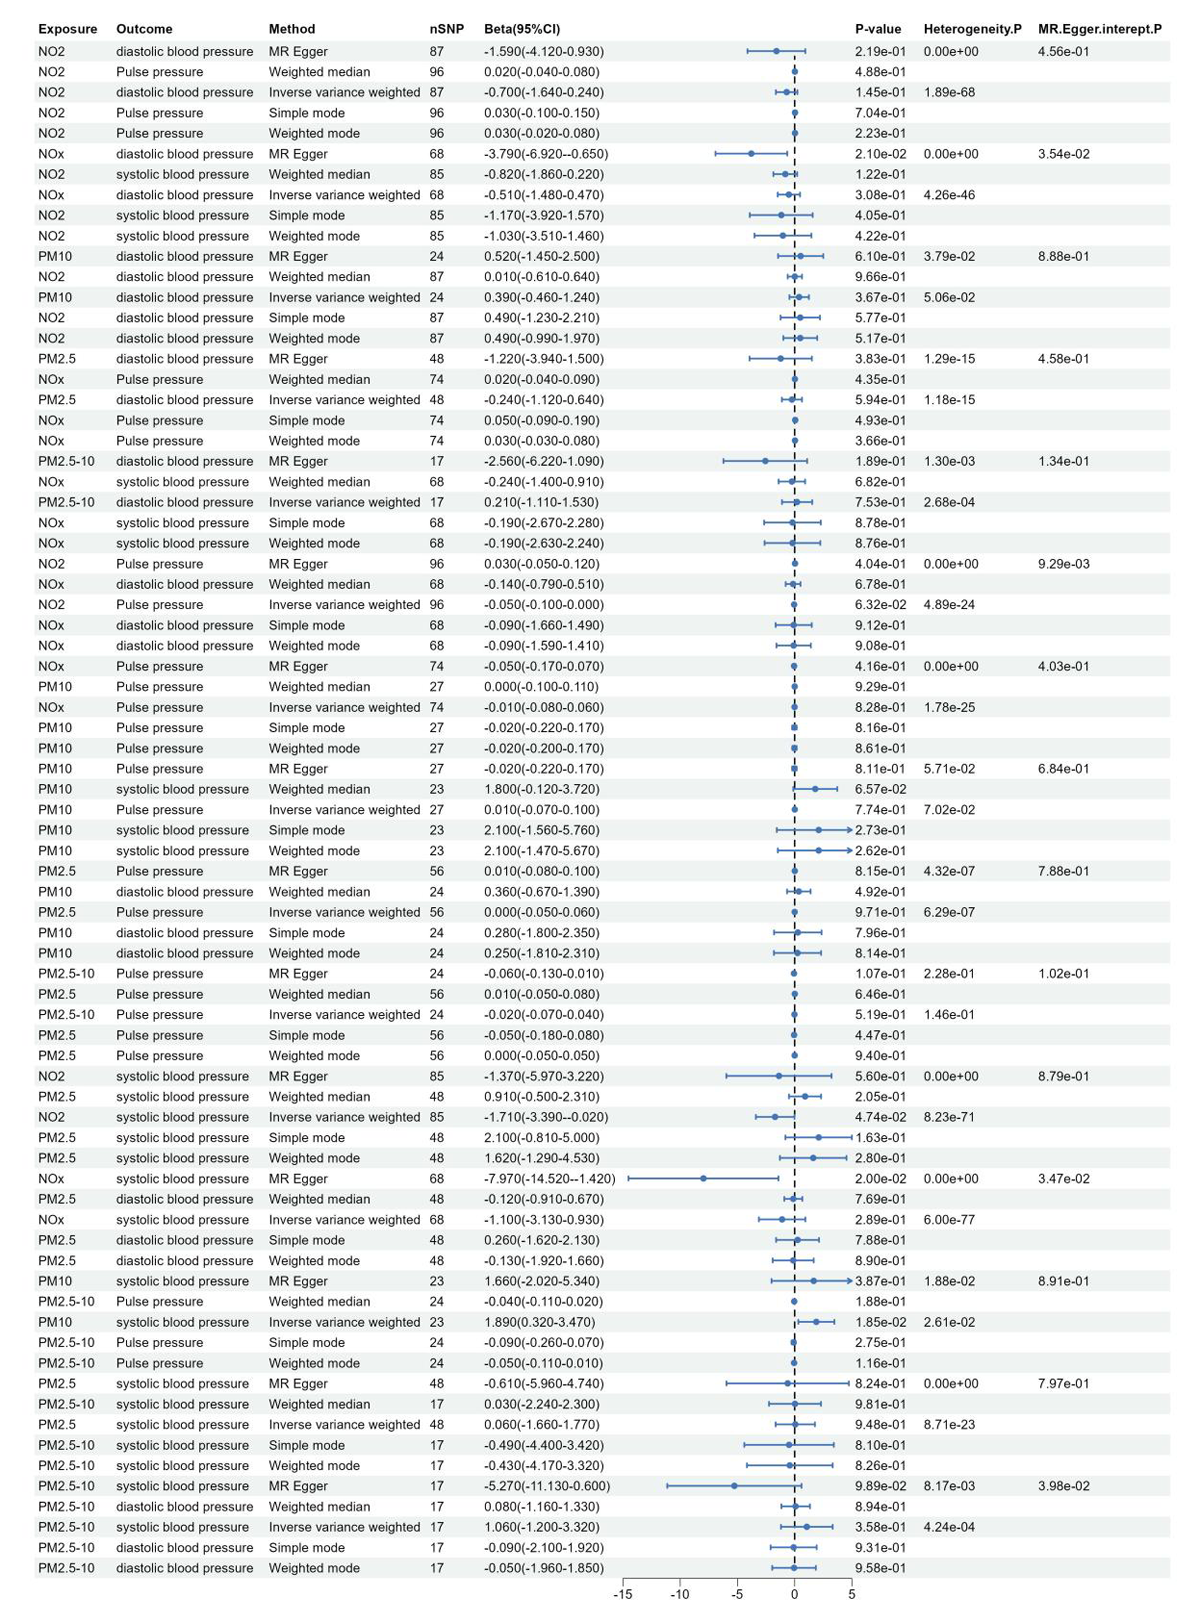
Figure 3
Forest plot of the association between air pollution and systolic blood pressure, diastolic blood pressure, and pulse pressure.
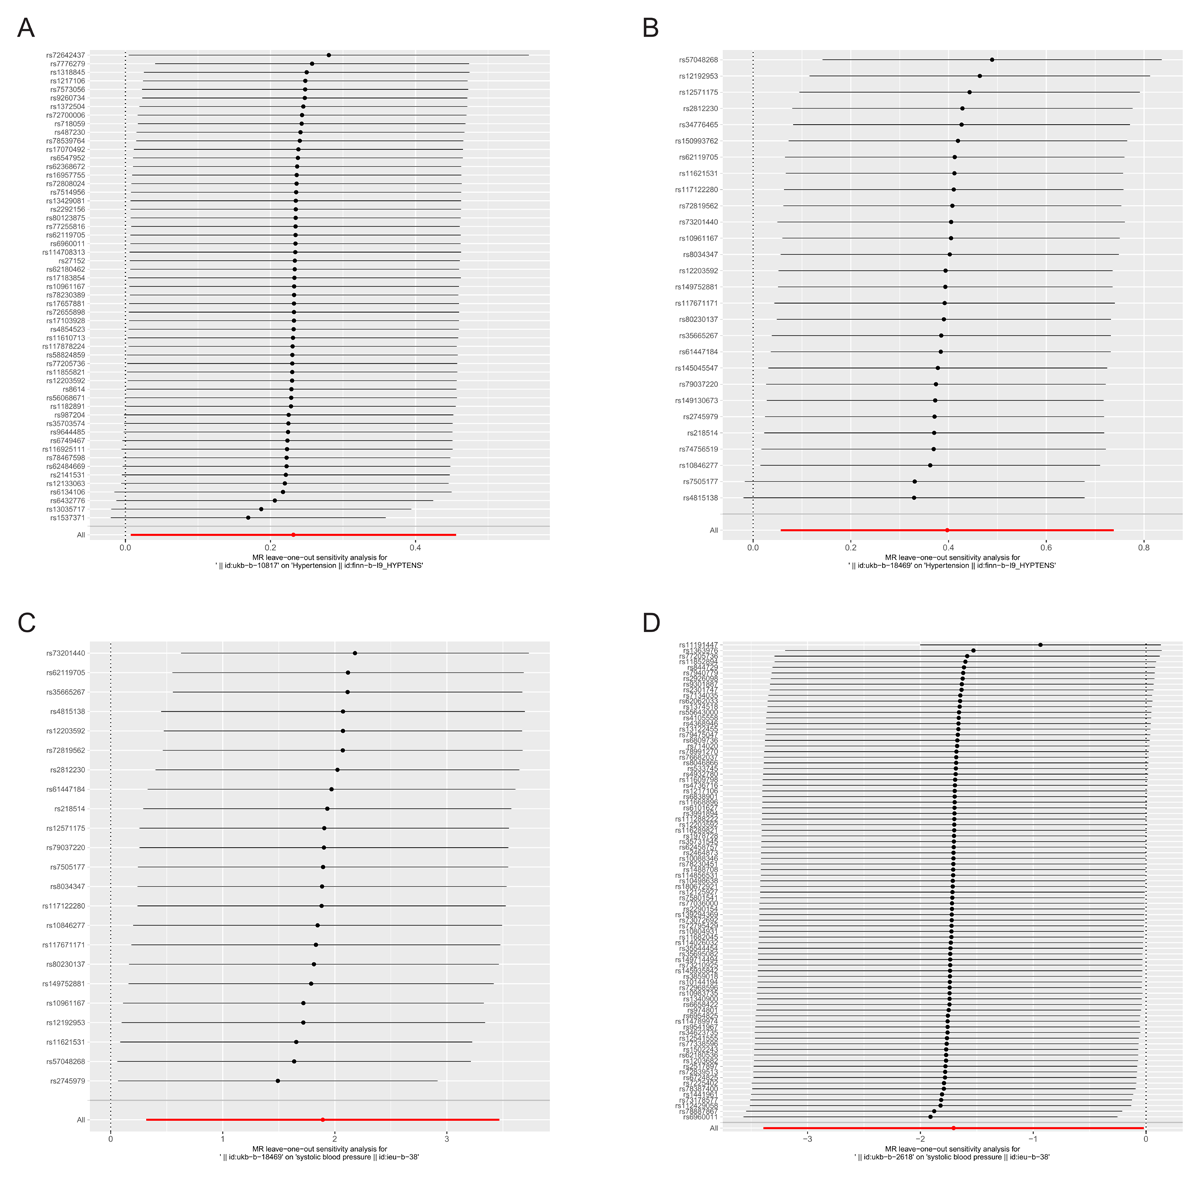
Figure 4
Forest plot of leave-one-out analysis of SNP causal effects of air pollution on blood pressure.
Note: Error bars represent 95% confidence intervals (CI). A: PM10-Hypertension; B: PM10-systolic blood pressure; C: PM2.5-hypertension; D: NO2-systolic blood pressure.