
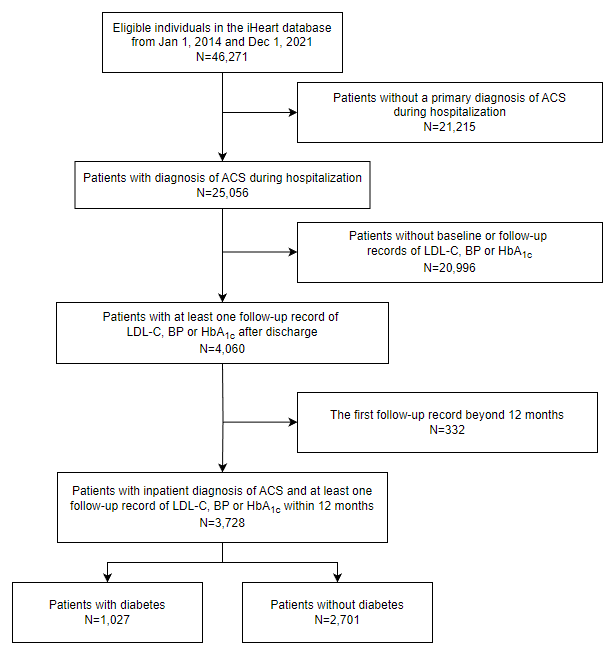
Figure 1
Flowchart of patient selection.
Table 1
Baseline characteristics of study patients.
| PATIENT CHARACTERISTICS | ALL | DIABETES | NON-DIABETES | p VALUE |
|---|---|---|---|---|
| (n = 3728) | (n = 1027) | (n = 2701) | ||
| Age, yr | 73.3 (12.5) | 74.8 (11.3) | 72.7 (12.9) | <0.001 |
| Sex | <0.001 | |||
| Male | 2395 (64.2%) | 586 (57.1%) | 1809 (67.0%) | |
| Female | 1333 (35.8%) | 441 (42.9%) | 892 (33.0%) | |
| Index hospitalization for ACS | ||||
| ACS subtype | ||||
| NSTEMI | 523 (14.0%) | 180 (17.5%) | 343 (12.7%) | <0.001 |
| STEMI | 1164 (31.2%) | 232 (22.6%) | 932 (34.5%) | |
| UA | 1790 (48.0%) | 528 (51.4%) | 1262 (46.7%) | |
| Undetermined | 251 (6.7%) | 87 (8.5%) | 164 (6.1%) | |
| SBP, mmHg | 136 (21) | 140 (22) | 135 (20) | <0.001 |
| DBP, mmHg | 79 (12) | 78 (12) | 79 (12) | 0.655 |
| PCI or CABG | 1650 (44.3%) | 503 (49.0%) | 1147 (42.5%) | <0.001 |
| Laboratory values | ||||
| FG, mmol/L | 6.7 (5.3–9.0) | 8.6 (6.5–11.9) | 6.2 (5.1–7.9) | <0.001 |
| HbA1c, % | 6.2 (5.7–7.1) | 7.4 (6.5–8.7) | 6.0 (5.6–6.4) | <0.001 |
| TC, mmol/L | 4.5 (3.8–5.4) | 4.5 (3.7–5.4) | 4.5 (3.8–5.4) | 0.249 |
| TG, mmol/L | 1.4 (1.0–2.0) | 1.5 (1.1–2.3) | 1.4 (1.0–2.0) | <0.001 |
| LDL-C, mmol/L | 2.8 (2.2–3.4) | 2.7 (2.1–3.5) | 2.8 (2.2–3.4) | 0.315 |
| HDL-C, mmol/L | 1.1 (0.9–1.3) | 1.0 (0.9–1.3) | 1.1 (0.9–1.3) | <0.001 |
| Non-HDL-C, mmol/L | 3.5 (2.9–4.0) | 3.5 (2.9–4.0) | 3.5 (2.9–4.0) | 0.833 |
| Lp (a), mg/L | 263 (123–400) | 253 (110–417) | 267 (128–394) | 0.408 |
| NT-proBNP, pg/ml | 688 (306–1856) | 711 (314–1977) | 673 (304–1766) | 0.216 |
| NEU, % | 70.6 (61.3–80.0) | 68.8 (60.4–78.0) | 71.8 (61.6–80.7) | <0.001 |
| eGFR, mL/min/1.73 m2 | 84.4 (66.8–98.6) | 85.1 (63.1–99.3) | 84.3 (67.7–98.2) | 0.575 |
| Cr, μmol/L | 80 (66–100) | 78 (63–105) | 81 (67–98) | 0.232 |
| D-dimer, mg/L | 0.5 (0.3–1.0) | 0.5 (0.3–1.0) | 0.5 (0.3–1.0) | 0.554 |
| Comorbidities | ||||
| Dyslipidemia | 2694(72.3%) | 778 (75.8%) | 1916 (71.0%) | 0.004 |
| Hypertension | 2056(55.2%) | 792 (77.1%) | 1264 (46.8%) | <0.001 |
| Smoker | 1333(35.8%) | 405 (39.4%) | 928 (34.4%) | <0.001 |
| Atrial fibrillation | 257(6.9%) | 79 (7.7%) | 178 (6.6%) | 0.340 |
| Prior MI | 895(24.0%) | 349 (34.0%) | 546 (20.2%) | <0.001 |
| Cerebrovascular disease | 740(19.8%) | 310 (30.2%) | 430 (15.9%) | <0.001 |
[i] Abbreviations: ACS, acute coronary syndrome; NSTEMI, non-ST-elevation myocardial infarction; STEMI, ST-segment elevation myocardial infarction; UA, unstable angina; SBP, systolic blood pressure; DBP, diastolic blood pressure; PCI, percutaneous coronary intervention; CABG, coronary artery bypass grafting; FG, fasting glucose; HbA1c, glycated hemoglobin; TC, total cholesterol; TG, triglyceride; LDL-C, low-density lipoprotein cholesterol; HDL-C, high-density lipoprotein cholesterol; Lp (a), lipoprotein (a); NT-proBNP, N-Terminal pro-brain natriuretic peptide; eGFR, estimated glomerular filtration rate; Cr, creatinine; MI, myocardial infarction.
Data are n (%), mean (SD), or median (IQR). P values for comparison between diabetes and non-diabetes.
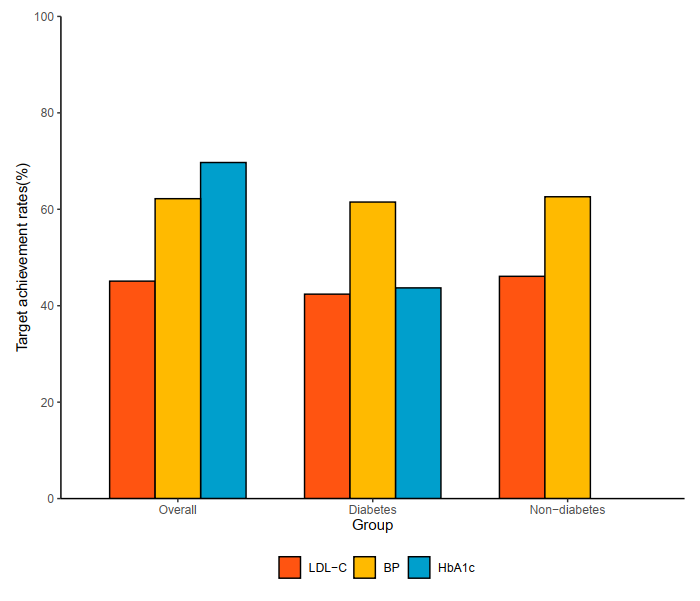
Figure 2
Target Achievement Rate of LDL-C, BP and HbA1c.
Table 2
Association of clinical variables and achievement of LDL-C, BP and HbA1c in diabetes patients.
| VARIABLE | LDL-C | BP | HBA1C |
|---|---|---|---|
| OR (95% CI) | OR (95% CI) | OR (95% CI) | |
| Age >65 yr | 0.508(0.212–1.218) | 0.861(0.387–1.914) | 0.540(0.236–1.233) |
| Male | 1.471(0.763–2.836) | 1.084(0.580–2.024) | 1.257(0.658–2.401) |
| Revascularization | 1.309(0.682–2.510) | 1.216(0.655–2.257) | 1.185(0.627–2.238) |
| Prior MI | 0.704(0.366–1.357) | 1.003(0.541–1.859) | 0.411(0.217–0.778)* |
| Atrial fibrillation | 1.146(0.435–3.024) | 1.633(0.641–4.162) | 0.384(0.152–0.973)* |
| eGFR <60 mL/min/1.73 m² | 1.113(0.465–2.662) | 0.446(0.198–1.004) | 2.286(0.984–5.313) |
| Newly diagnosed MI | 2.403(0.931–6.207) | 1.847(0.772–4.418) | 1.003(0.415–2.422) |
| Measurements ≥3 times | 2.392(1.264–4.524) | 1.420(0.788–2.560) | 1.829(0.997–3.356) |
| First measurement ≤3 months | 2.091(1.095–3.993) | 1.679(0.904–3.118) | 0.998(0.531–1.875) |
[i] Abbreviations: OR, odds ratio; MI, myocardial infarction; eGFR, estimated glomerular filtration rate; *P < 0.05. ORs (95% CI) of achievement of LDL-C, BP, and HbA1c were fully adjusted models.
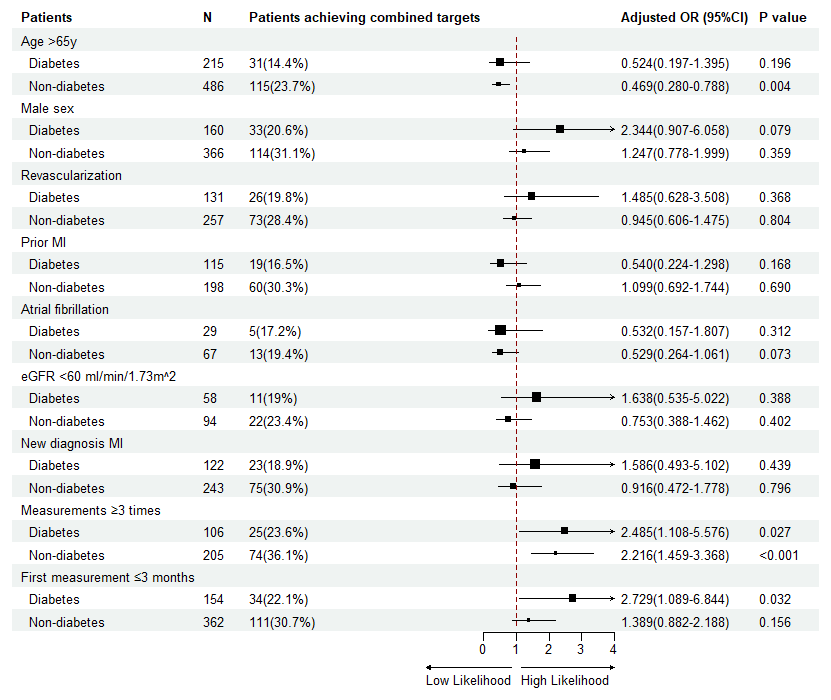
Figure 3
Multivariate logistic analysis of risk for combined achievements in patients with or without diabetes.
| ACS | Acute coronary syndrome |
| LDL-C | Low-density lipoprotein cholesterol |
| SBP | Systolic blood pressure |
| HbA1c | Glycated hemoglobin |
| CVD | Cardiovascular disease |
| MACE | Major adverse cardiovascular events |
| BP | Blood pressure |
| EHRs | Electronic health records |
| CCA | Chinese Cardiovascular Association |
| STEMI | ST-segment elevation myocardial infarction |
| NSTEMI | Non-ST-elevation myocardial infarction |
| UA | Unstable angina |
| FG | Fasting glucose |
| eGFR | Estimated glomerular filtration rate |
| Cr | Creatinine |
| NT-proBNP | N-Terminal pro-brain natriuretic peptide |
| PCI | Percutaneous coronary intervention |
| CABG | Coronary artery bypass graft |
| OR | Odds ratio |
| CI | Confidence interval |
| TC | Total cholesterol |
| HDL-C | High-density lipoprotein cholesterol |
| MI | Myocardial infarction |