
Table 1
Baseline characteristics of study participants by pregnancy loss.
| PREGNANCY LOSS | p | ||
|---|---|---|---|
| NO (n = 5636) | YES (n = 1850) | ||
| Age when enrolled in the cohort, years | 58.6 (9.7) | 56.9 (8.7) | <0.001 |
| Age at first birth, years | 22.8 (3.5) | 23.4 (3.3) | <0.001 |
| Body mass index, kg/m2 | |||
| Normal weight | 1,973 (44.0%) | 646 (39.8%) | 0.01 |
| Overweight | 894 (19.9%) | 354 (21.8%) | |
| Obesity | 1,616 (36.1%) | 622 (38.4%) | |
| Education level, % | |||
| Lower than Primary | 2510 (44.5%) | 560 (30.3%) | <0.001 |
| Primary and secondary | 2013 (35.7%) | 688 (37.2%) | |
| Tertiary education | 1113 (19.7%) | 602 (32.5%) | |
| Smoker, % | 389 (7.9%) | 107 (6.9%) | 0.17 |
| Alcohol drinker, % | 675 (13.8%) | 249 (16.0%) | 0.03 |
| Physical activity score | 157.2 (112.6) | 140.0 (100.8) | 0.001 |
| Hypertension, % | 1,255 (30.2%) | 326 (25.7%) | 0.002 |
| Diabetes, % | 292 (6.0%) | 111 (7.2%) | 0.098 |
| Marital status-with partners, % | 4,176 (84.7%) | 1,380 (88.1%) | 0.001 |
| Age at menarche, years | 16.1 (2.0) | 15.9 (2.0) | <0.001 |
| Age at menopause, years | 48.7 (4.5) | 48.8 (4.3) | 0.59 |
| Depression, % | 2,001 (42.8%) | 643 (43.1%) | 0.832 |
| Gravidity | 3.1 (1.6) | 4.0 (1.6) | <0.001 |
| Number of live births | 3.1 (1.6) | 2.6 (1.5) | <0.001 |
| 1 | 581 (10.3%) | 401 (21.7%) | <0.001 |
| 2 | 1,837 (32.6%) | 664 (35.9%) | |
| 3 | 1,382 (24.5%) | 373 (20.2%) | |
| 4 | 864 (15.3%) | 214 (11.6%) | |
| 5 | 972 (17.3%) | 198 (10.7%) | |
[i] Values are percentages for categorical variables and means and standard deviations for continuous variables. P-value refers the comparison between women with history of pregnancy loss and without pregnancy loss. Total counts may vary because of missing values.
Table 2
Hazard ratios and 95% confidence intervals for cardiovascular disease associated with pregnancy loss and number of pregnancy loss among 7486 women.
| CARDIOVASCULAR DISEASE | CORONARY HEART DISEASE | STROKE | ||||
|---|---|---|---|---|---|---|
| HR (95%) | p | HR (95%) | p | HR (95%) | p | |
| Model 1 | ||||||
| Pregnancy loss (ever vs never) | 1.81 (1.64 to 2.00) | <0.001 | 1.80 (1.62 to 2.00) | <0.001 | 1.77 (1.44 to 2.17) | <0.001 |
| Number of pregnancy loss | ||||||
| No pregnancy loss | 1.00 | 1.00 | 1.00 | |||
| 1 | 1.83 (1.63 to 2.05) | <0.001 | 1.82 (1.62 to 2.06) | <0.001 | 1.81 (1.44 to 2.28) | <0.001 |
| ≥2 | 1.77 (1.50 to 2.10) | <0.001 | 1.74 (1.44 to 2.08) | <0.001 | 1.67 (1.18 to 2.36) | <0.001 |
| Continuous number | 1.38 (1.30 to 1.46) | <0.001 | 1.36 (1.28 to 1.45) | <0.001 | 1.35 (1.20 to 1.53) | <0.001 |
| Model 2 | ||||||
| Pregnancy loss (ever vs never) | 1.73 (1.56 to 1.92) | <0.001 | 1.71 (1.53 to 1.91) | <0.001 | 1.78 (1.44 to 2.19) | <0.001 |
| Number of pregnancy loss | ||||||
| No pregnancy loss | 1.00 | 1.00 | 1.00 | |||
| 1 | 1.76 (1.57 to 1.98) | <0.001 | 1.75 (1.55 to 1.98) | <0.001 | 1.84 (1.45 to 2.33) | <0.001 |
| ≥2 | 1.65 (1.39 to 1.96) | <0.001 | 1.61 (1.34 to 1.94) | <0.001 | 1.62 (1.14 to 2.31) | 0.01 |
| Continuous number | 1.28 (1.20 to 1.35) | <0.001 | 1.26 (1.19 to 1.34) | <0.001 | 1.28 (1.15 to 1.43) | <0.001 |
[i] HR, hazard ratio. Model 1 was the univariable model. Model 2 adjusted age at baseline, age at first birth, menarche, menopause, number of live births, BMI, diabetes, hypertension, marital status, smoking status, drinking status, education level, depression symptom and physical activity.
Table 3
Hazard ratios and 95% confidence intervals for cardiovascular disease associated with induced abortion, miscarriage and stillbirth among 6994 women.
| CARDIOVASCULAR DISEASE | CORONARY HEART DISEASE | STROKE | ||||
|---|---|---|---|---|---|---|
| HR (95%) | p | HR (95%) | p | HR (95%) | p | |
| Model 1 | ||||||
| No pregnancy loss | 1.00 | 1.00 | 1.00 | |||
| Induced abortion | 2.44 (2.12 to 2.81) | <0.001 | 2.36 (2.03 to 2.74) | <0.001 | 2.82 (2.13 to 3.75) | <0.001 |
| Miscarriage | 1.37 (1.13 to 1.67) | <0.001 | 1.43 (1.16 to 1.76) | <0.001 | 1.14 (0.74 to 1.74) | 0.56 |
| Stillbirth | 1.11 (0.80 to 1.54) | 0.52 | 1.09 (0.76 to 1.56) | 0.64 | 1.10 (0.57 to 2.12) | 0.79 |
| Model 2 | ||||||
| No pregnancy loss | 1.00 | 1.00 | 1.00 | |||
| Induced abortion | 2.11 (1.82 to 2.44) | <0.001 | 2.02 (1.73 to 2.36) | <0.001 | 2.70 (2.02 to 3.62) | <0.001 |
| Miscarriage | 1.41 (1.16 to 1.72) | <0.001 | 1.47 (1.19 to 1.81) | <0.001 | 1.21 (0.78 to 1.86) | 0.40 |
| Stillbirth | 1.29 (0.93 to 1.80) | 0.13 | 1.28 (0.89 to 1.83) | 0.18 | 1.28 (0.66 to 2.49) | 0.47 |
[i] This analysis was restricted to women who had no or one pregnancy loss. HR, hazard ratio. Model 1 was the univariable model. Model 2 adjusted age at baseline, age at first birth, menarche, menopause, number of live births, BMI, diabetes, hypertension, marital status, smoking status, drinking status, education level, depression symptom and physical activity.
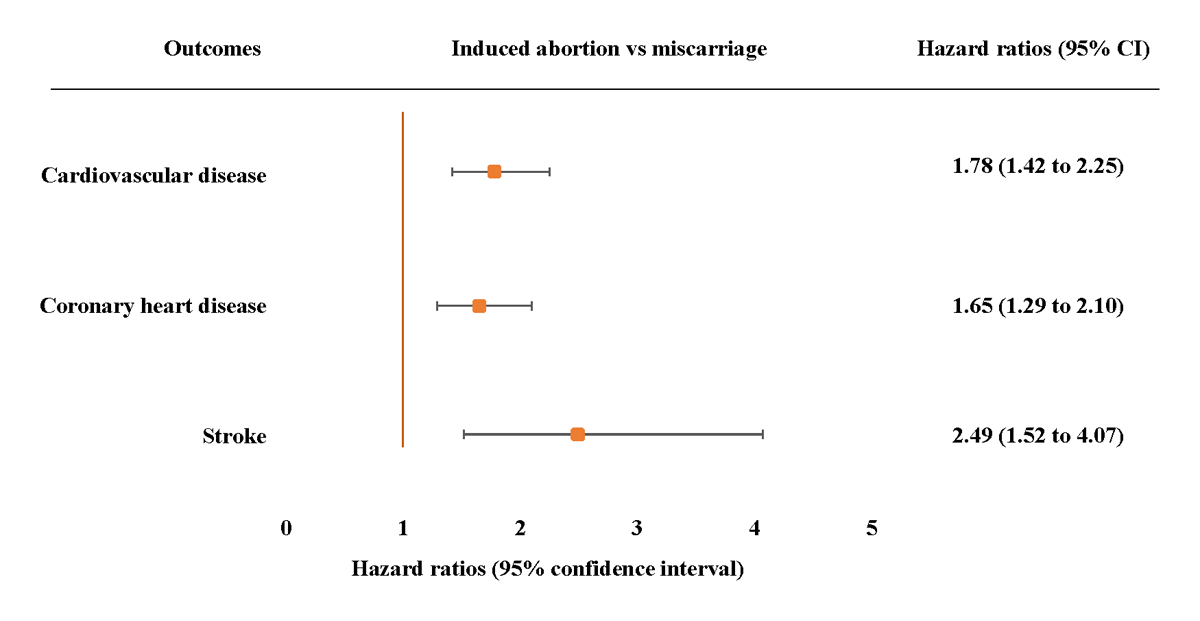
Figure 1
Adjusted hazard ratios (95% confidence intervals) for incident cardiovascular disease, coronary heart disease and stroke associated with induced abortion compared with miscarriage. Adjusted model 3 adjusted age at baseline, age at first birth, menarche, menopause, number of live births, BMI, diabetes, hypertension, marital status, smoking status, drinking status, education level depression symptom and physical activity. The hazard ratios (HRs) are plotted on a floating absolute scale. Each square has an area inversely proportional to the standard error of the log risk. Vertical lines indicate the corresponding 95% confidence intervals (CIs). Analyses are among women who had no or one pregnancy loss.
Table 4
Hazard ratios and 95% confidence intervals for cardiovascular disease associated with age at pregnancy loss among 7483 women.
| CARDIOVASCULAR DISEASE | CORONARY HEART DISEASE | STROKE | ||||
|---|---|---|---|---|---|---|
| AGE AT FIRST PREGNANCY LOSS | HR (95%) | p | HR (95%) | p | HR (95%) | p |
| Model 1 | ||||||
| No pregnancy loss | 1.00 | 1.00 | 1.00 | |||
| ≤23 | 1.20 (1.00 to 1.44) | 0.048 | 1.22 (1.01 to 1.48) | 0.041 | 1.14 (0.79 to 1.65) | 0.48 |
| 23–25 | 2.03 (1.66 to 2.48) | <0.001 | 2.16 (1.75 to 2.67) | <0.001 | 1.26 (0.75 to 2.12) | 0.38 |
| 26–29 | 2.16 (1.84 to 2.53) | <0.001 | 2.03 (1.71 to 2.41) | <0.001 | 2.63 (1.94 to 3.57) | <0.001 |
| ≥30 | 2.36 (1.98 to 2.82) | <0.001 | 2.27 (1.88 to 2.74) | <0.001 | 2.46 (1.71 to 3.52) | <0.001 |
| Per 1 unit increase in age group | 1.27 (1.23 to 1.31) | <0.001 | 1.26 (1.21 to 1.30) | <0.001 | 1.29 (1.20 to 1.38) | <0.001 |
| Model 2 | ||||||
| No pregnancy loss | 1.00 | 1.00 | 1.00 | |||
| ≤23 | 1.14 (0.95 to 1.37) | 0.15 | 1.15 (0.95 to 1.40) | 0.15 | 1.11 (0.77 to 1.61) | 0.58 |
| 23–25 | 1.75 (1.42 to 2.15) | <0.001 | 1.85 (1.49 to 2.30) | <0.001 | 1.15 (0.68 to 1.93) | 0.61 |
| 26–29 | 1.96 (1.67 to 2.31) | <0.001 | 1.84 (1.54 to 2.19) | <0.001 | 2.62 (1.90 to 3.59) | <0.001 |
| ≥30 | 3.05 (2.54 to 3.67) | <0.001 | 2.89 (2.37 to 3.53) | <0.001 | 3.84 (2.62 to 5.63) | <0.001 |
| Per 1 unit increase in age group | 1.29 (1.24 to 1.34) | <0.001 | 1.27 (1.22 to 1.33) | <0.001 | 1.36 (1.26 to 1.47) | <0.001 |
[i] HR, hazard ratio. Model 1 was the univariable model. Model 2 adjusted age at baseline, age at first birth, menarche, menopause, number of live births, BMI, diabetes, hypertension, marital status, smoking status, drinking status, education level, depression symptom and physical activity.