
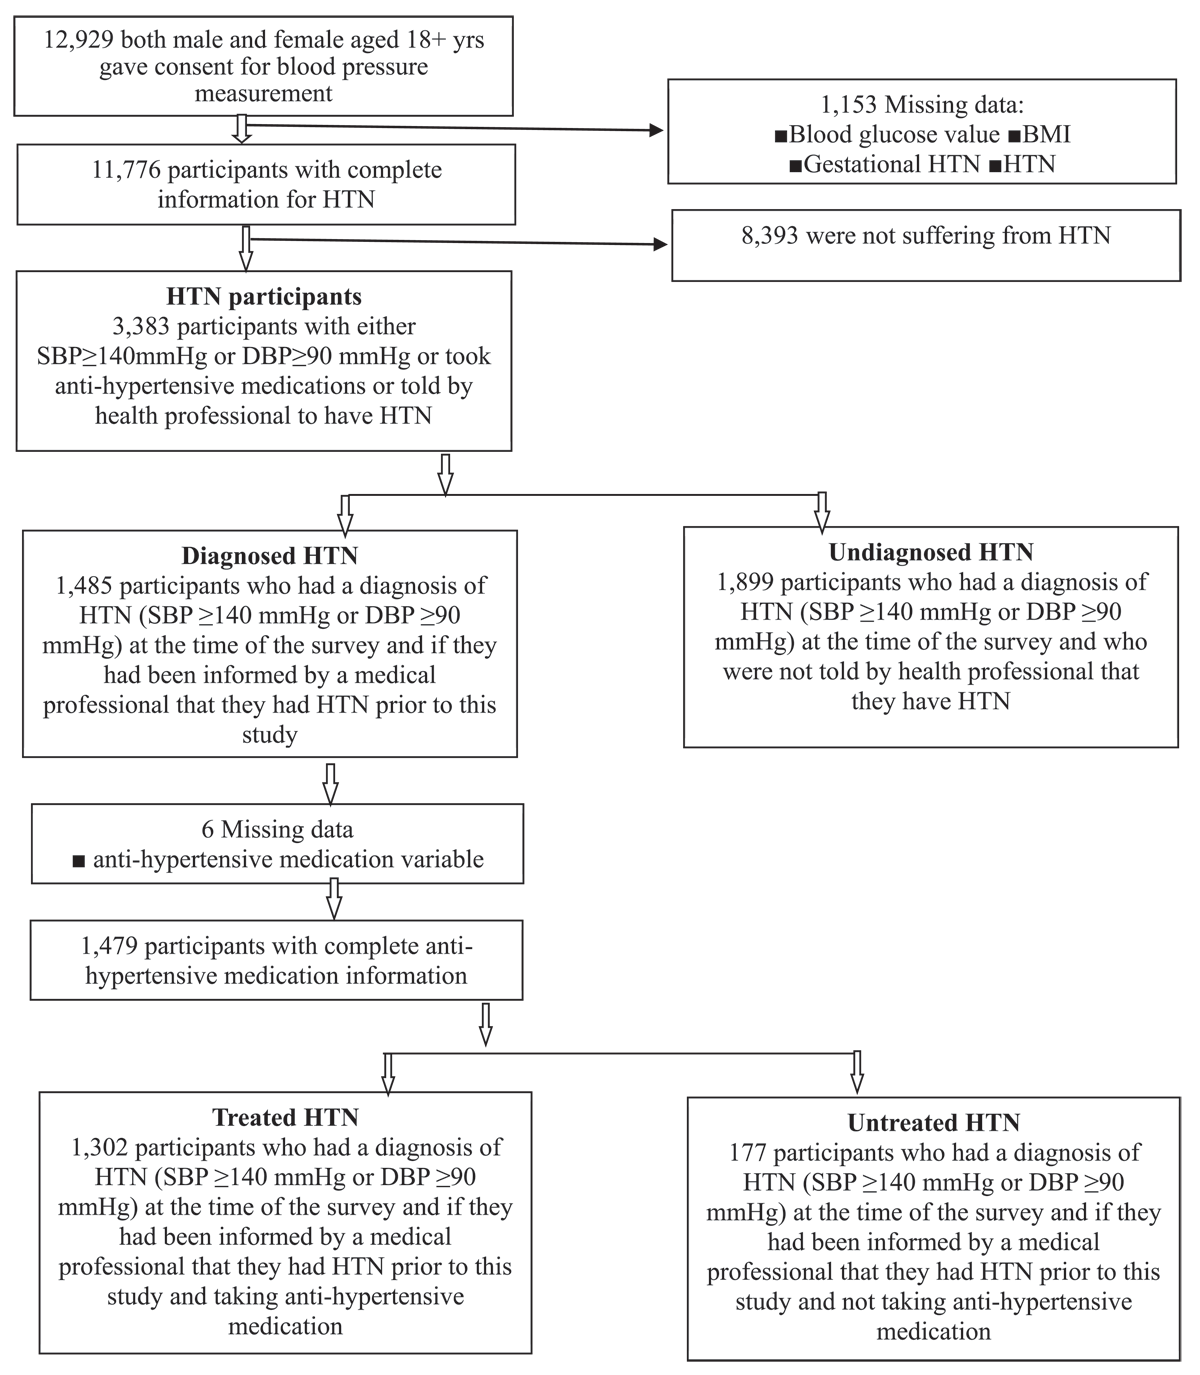
Figure 1
Selection of the sample.
Table 1
Descriptive statistics according to the age-adjusted prevalence of hypertension, undiagnosed hypertension, and untreated hypertension among individuals aged 18 years or older: 2017–2018, Bangladesh Demographic and Health Survey.
| MEASURES | %1 | AGE-ADJUSTED PREVALENCE (%) | ||
|---|---|---|---|---|
| HYPERTENSION (n = 11,776) | UNDIAGNOSED HYPERTENSION (n = 3,383) | UNTREATED HYPERTENSION (n = 1,479) | ||
| Age, yrs | ||||
| 18–34 | 43.8 | 13 | 70.9 | 24.4 |
| 35–39 | 11.8 | 27.6 | 68 | 12.3 |
| 40–44 | 8.9 | 30.7 | 55.8 | 15.6 |
| 45–49 | 8.5 | 37.2 | 53.9 | 7.2 |
| 50–54 | 5.7 | 41.2 | 53.5 | 13.1 |
| 55–59 | 5.8 | 45.1 | 46.7 | 7.5 |
| 60–64 | 5.8 | 49.8 | 45.7 | 7.3 |
| 65+ | 9.6 | 55.4 | 51.8 | 11 |
| Currently married | ||||
| No | 19.5 | 25 | 62.1 | 11.5 |
| Yes | 80.5 | 24.7 | 56.9 | 12.5 |
| Currently working | ||||
| No | 37.9 | 28.6 | 50.2 | 10.4 |
| Yes | 62.1 | 23.4 | 62.5 | 14.2 |
| BMI | ||||
| Underweight | 17.6 | 13.3 | 70.6 | 15.2 |
| Normal | 58.4 | 22.2 | 60.6 | 11.7 |
| Overweight/obese | 24.1 | 40.4 | 47.5 | 12.4 |
| Education | ||||
| No education | 26 | 23.3 | 60.8 | 65.4 |
| Primary | 30.1 | 24.3 | 54.8 | 61.6 |
| Secondary | 29 | 27.8 | 55.6 | 60 |
| Higher | 14.9 | 29.6 | 55.6 | 61.3 |
| Gender | ||||
| Female | 56.2 | 27.8 | 50.1 | 11.4 |
| Male | 43.8 | 22.3 | 67.4 | 14.1 |
| Living in a patriarchal family | ||||
| No | 11.9 | 27.7 | 54.4 | 10.6 |
| Yes | 88.1 | 24.8 | 57.6 | 12.5 |
| No. of adult member | ||||
| 1–2 | 36.3 | 25.6 | 60 | 14.2 |
| 3 | 25 | 25.6 | 58.3 | 9.4 |
| 4+ | 38.7 | 24.6 | 54.5 | 12.7 |
| No. of household member | ||||
| 1–4 | 43.6 | 25.8 | 59.1 | 13.4 |
| 5 | 19.3 | 25.7 | 55.6 | 8.7 |
| 6+ | 37.1 | 24.1 | 55.6 | 12.9 |
| Place of residence | ||||
| Rural | 73.5 | 24.3 | 59.1 | 13.4 |
| Urban | 26.5 | 27.6 | 51.7 | 9.7 |
| Division | ||||
| Barisal | 5.6 | 27.6 | 56.7 | 12.1 |
| Chittagong | 17.2 | 28.5 | 52.6 | 7.9 |
| Dhaka | 22.3 | 22.6 | 54.2 | 7.7 |
| Khulna | 12.6 | 25.7 | 56.5 | 15.6 |
| Mymensingh | 8.2 | 20 | 58.1 | 8.1 |
| Rajshahi | 14.7 | 25.1 | 59.9 | 21.3 |
| Rangpur | 12.8 | 27.4 | 66.9 | 20.9 |
| Sylhet | 6.6 | 23.9 | 49.7 | 5.3 |
| SES | ||||
| Nonpoor | 60.6. | 27.4 | 52.6 | 11 |
| Poor | 39.4 | 21.7 | 66.3 | 15.5 |
| Prevalence | 25.1 | 57.2 | 12.3 | |
[i] Note:1 Weighted percentage was presented.
Table 2
Adjusted odds ratio for the association between SES and other covariates with the prevalence of hypertension, undiagnosed hypertension, and untreated hypertension among individuals aged 18 years or older: 2017–2018, Bangladesh Demographic and Health Survey.
| MEASURES | aOR (95% CI) | ||
|---|---|---|---|
| HYPERTENSION (n = 11,776) | UNDIAGNOSED HYPERTENSION (n = 3,383) | UNTREATED HYPERTENSION (n = 1,479) | |
| Age, yrs | |||
| 18–34 | 1.00 | 1.00 | 1.00 |
| 35–39 | 2.54 (2.13–3.02)a | 0.90 (0.64–1.26) | 0.44 (0.23–0.88)c |
| 40–44 | 3.11 (2.59–3.74)a | 0.51 (0.37–0.70)a | 0.60 (0.32–1.12) |
| 45–49 | 4.26 (3.50–5.19)a | 0.48 (0.35–0.66)a | 0.25 (0.13–0.50)a |
| 50–54 | 5.89 (4.75–7.29)a | 0.37 (0.27–0.51)a | 0.44 (0.23–0.85)c |
| 55–59 | 6.99 (5.73–8.53)a | 0.27 (0.20–0.39)a | 0.25 (0.12–0.52)a |
| 60–64 | 9.03 (7.31–11.17)a | 0.23 (0.17–0.32)a | 0.25 (0.12–0.49)a |
| 65+ | 12.03 (9.94–14.56)a | 0.26 (0.19–0.35)a | 0.36 (0.20–0.64)b |
| Currently married | |||
| No | 1.00 | 1.00 | 1.00 |
| Yes | 0.78 (0.67–0.91)c | 0.74 (0.59–0.92)b | 0.71 (0.43–1.18) |
| Currently working | |||
| No | 1.00 | 1.00 | 1.00 |
| Yes | 0.92 (0.81–1.05) | 1.05 (0.87–1.28) | 1.21 (0.79–1.85) |
| BMI | |||
| Underweight | 1.00 | 1.00 | 1.00 |
| Normal | 1.93 (1.69–2.21)a | 0.63 (0.49–0.83)b | 0.85 (0.43–1.69) |
| Overweight/obese | 5.04 (4.27–5.95)a | 0.44 (0.33–0.59)a | 0.89 (0.43–1.82) |
| Education | |||
| No education | 1.00 | 1.00 | 1.00 |
| Primary | 1.06 (0.93–1.21) | 0.79 (0.64–0.98)c | 1.57 (0.99–2.48) |
| Secondary | 1.12 (0.96–1.31) | 0.81 (0.63–1.05) | 1.10 (0.63–1.91) |
| Higher | 1.13 (0.94–1.36) | 0.82 (0.60–1.29) | 1.82 (0.94–3.52) |
| Gender | |||
| Female | 1.00 | 1.00 | 1.00 |
| Male | 0.80 (0.71–0.91)a | 2.36 (1.92–2.90)a | 1.19 (0.77–1.86) |
| Living in a patriarchal family | |||
| No | 1.00 | 1.00 | 1.00 |
| Yes | 1.05 (0.89–1.24) | 0.98 (0.73–1.30) | 1.35 (0.74–2.49) |
| No. of adult member | |||
| 1–2 | 1.00 | 1.00 | 1.00 |
| 3 | 0.95 (0.82–1.11) | 1.03 (0.81–1.31) | 0.89 (0.53–1.48) |
| 4+ | 0.89 (0.75–1.06) | 0.98 (0.76–1.27) | 1.44 (0.82–2.53) |
| No. of household member | |||
| 1–4 | 1.00 | 1.00 | 1.00 |
| 5 | 0.99 (0.86–1.16) | 0.88 (0.69–1.13) | 0.57 (0.32–1.00) |
| 6+ | 0.94 (0.80–1.10) | 0.94 (0.74–1.21) | 0.72 (0.43–1.22) |
| Place of residence | |||
| Rural | 1.00 | 1.00 | 1.00 |
| Urban | 1.09 (0.96–1.23) | 0.89 (0.73–1.09) | 0.79 (0.50–1.23) |
| Division | |||
| Barisal | 1.00 | 1.00 | 1.00 |
| Chittagong | 0.88 (0.70–1.11) | 1.01 (0.72–1.43) | 0.55 (0.25–1.20) |
| Dhaka | 0.64 (0.51–0.81)a | 1.02 (0.73–1.44) | 0.61 (0.27–1.29) |
| Khulna | 0.81 (0.65–1.02) | 1.09 (0.77–1.53) | 1.40 (0.65–3.01) |
| Mymensingh | 0.67 (0.54–0.85)b | 1.04 (0.72–1.50) | 0.59 (0.26–1.38) |
| Rajshahi | 0.87 (0.68–1.10) | 1.10 (0.79–1.54) | 1.84 (0.86–3.92) |
| Rangpur | 1.05 (0.85–1.31) | 1.40 (1.00–1.96)c | 2.02 (1.03–3.97)c |
| Sylhet | 0.86 (0.68–1.09) | 0.71 (0.49–1.04) | 0.37 (0.15–0.91)c |
| SES | |||
| Nonpoor | 1.00 | 1.00 | 1.00 |
| Poor | 0.88 (0.77–0.99)c | 1.53 (1.24–1.89)b | 1.68 (1.02–2.76)c |
[i] Note: CI = Confidence interval; aOR = Adjusted odds ratio. Here a, b, and c indicate p < 0.001, p < 0.01, and p < 0.05.
Table 3
Decomposition results of the explained poor-nonpoor gap of hypertension, undiagnosed hypertension, and untreated hypertension among individuals aged 18 years or older: 2017–2018, Bangladesh Demographic and Health Survey.
| PREDICTORS | HYPERTENSION (n = 11,776) | UNDIAGNOSED HYPERTENSION (n = 3,383) | UNTREATED HYPERTENSION (n = 1,479) | |||
|---|---|---|---|---|---|---|
| COEFFICIENT1 (95%CI) | % CONTRIBUTION | COEFFICIENT1 (95%CI) | % CONTRIBUTION | COEFFICIENT1 (95%CI) | % CONTRIBUTION | |
| Age | –0.0178 (–0.019, –0.016)a | –41.01 | 0.0159 (0.013, 0.019)a | 43.68 | –0.0052 (–0.008, –0.002)c | –30.2 |
| Currently married | 0.0002 (–0.0004, 0.0008) | 0.44 | –0.0035 (–0.006, –0.001)c | –9.62 | –0.0012 (–0.004, 0.002) | –6.97 |
| Currently working | 0.0003 (–0.0034, 0.0039) | 0.64 | 0.0002 (–0.005, 0.006) | 0.55 | –0.0027 (–0.007, 0.002) | –15.78 |
| BMI | 0.0579 (0.0522, 0.0638)a | 133.41 | –0.0352 (–0.048, –0.023)a | –96.7 | –0.0048 (–0.015, 0.006) | –27.9 |
| Education | 0.0029 (–0.005, 0.11) | 6.68 | 0.0156 (0.031, 0.007)c | 42.86 | 0.0023 (–0.016, 0.021) | 13.37 |
| Gender | 0.0002 (–0.0008, 0.0005) | 0.46 | 0.0093 (0.007, 0.012) a | 21.43 | 0.0027 (–0.004, 0.009) | 15.7 |
| Living in a patriarchal family | –0.0008 –(0.0005, 0.0003) | –0.19 | 0.0009 (–0.0005, 0.0007) | 0.25 | 0.0019 (–0.0006, 0.004) | 11.04 |
| No. of adult members | –0.0057 (–0.0105, 0.008) | –13.04 | 0.0013 (–0.007, 0.009) | 3.57 | 0.0022 (–0.004, 0.008) | 12.78 |
| No. of household members | 0.0005 (–0.0015, 0.0025) | 1.19 | –0.0016 (–0.006, 0.003) | –4.39 | –0.0007 (–0.0027, 0.001) | –4.07 |
| Place of residence | 0.0051 (–0.0009, 0.011) | 11.82 | –0.0065 (–0.020, 0.007) | –17.86 | –0.0080 (–0.019, 0.002) | –46.51 |
| Division | –0.0009 (–0.0019, 0.0018) | –0.21 | –0.0005 (–0.005, 0.004) | –1.37 | –0.0033 (–0.008, 0.002) | –19.18 |
| Total explained gap (%)2 | 0.0434 (65.1%) | 100 | –0.0364 (30%) | 100 | –0.0172 (43.9%) | 100 |
| Difference3 | –0.0666 | –0.1218 | –0.0391 | |||
[i] Here a, b, and c indicate p < 0.001, p < 0.01, and p < 0.05.
1 A positive (negative) coefficient of the covariate indicates that it widens (reduces) the gap between the poor and the non-poor to experience the occurrence of the outcome variables.
2 Within the explained gap of the prevalence of hypertension, as having undiagnosed hypertension, and untreated hypertension 65.1%, 30%, and 43.9% can explained by the differences between the poor and non-poor individuals in the distribution of age, currently married, currently working, BMI, education, gender, living in a patriarchal family, no. of adult members, no. of household members, place of residence, and division respectively.
3 The difference between hypertension, as having undiagnosed hypertension, and untreated hypertension amongst poor-non-poor.