
Table 1
Baseline characteristics of symptomatic patients with zero Agatston score.
| BASELINE CHARACTERISTICS | N = 534 |
|---|---|
| Mean age | 53 ± 11 |
| Gender, male, n (%) | 365 (68.4) |
| Gender, female, n (%) | 169 (31.6) |
| Hypertension, n (%) | 19 (3.6) |
| Diabetes Mellitus, n (%) | 98 (18.4) |
| Smoking, n (%) | 7 (1.3) |
| Dyslipidemia, n (%) | 267 (50) |
| Family history of CAD, n (%) | 9 (1.7) |
| Symptom, chest pain, n (%) | 521 (97.4) |
| Symptom, dyspnea, n (%) | 13 (2.4) |
| Prior stress testing, n (%) | 189 (35.4%) |
| ETT, positive | 18 (3.6) |
| ETT, negative | 66 (12.3) |
| MPS, positive | 5 (1) |
| MPS, negative | 56 (10.9) |
| Stress echo, positive | 2 (.4) |
| Stress echo, negative | 13 (2.5) |
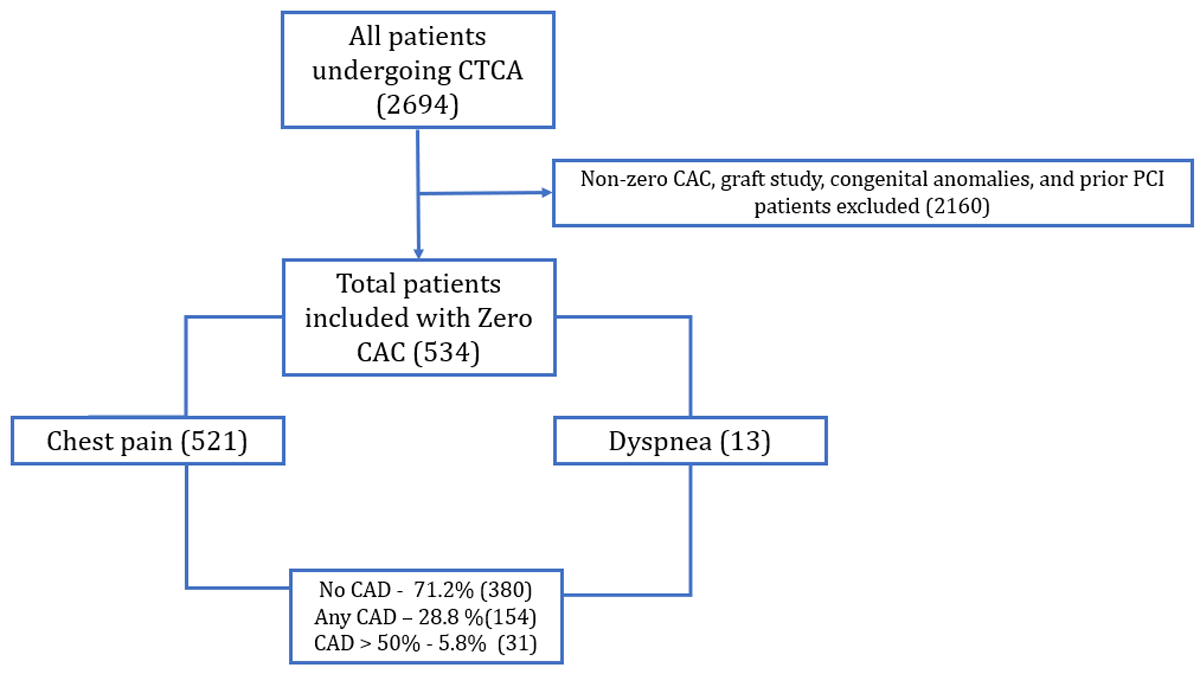
Figure 1
Study flow chart.
Table 2
Coronary artery disease distribution in symptomatic patients with zero Agatston score.
| CTCA VARIABLES | N (%) |
|---|---|
| CAD more than 50%, n (%) | 31 (5.8) |
| Any CAD – soft plaque, n (%) | 154 (28.8) |
| Left main disease, n (%) | |
| Mild | 13 (2.4) |
| None | 521 (97.6) |
| LAD disease, n (%) | |
| Mild | 101 (18.9) |
| Moderate | 10 (1.9) |
| Severe | 10 (1.9) |
| None | 77.3 (77.3) |
| LCx disease, n (%) | |
| Mild | 34 (6.4) |
| Moderate | 2 (.4) |
| Severe | 5 (.9) |
| None | 493 (92.3) |
| RCA disease, n (%) | |
| Mild | 52 (9.7) |
| Moderate | 8 (1.5) |
| Severe | 3 (.6) |
| None | 471 (88.2) |
| OM disease, n (%) | |
| Mild | 12 (2.2) |
| Moderate | 3 (.6) |
| Severe | 4 (.7) |
| None | 515 (96.4) |
| Diagonal disease, n (%) | |
| Mild | 20 (3.7) |
| Moderate | 4 (.7) |
| Severe | 5 (.9) |
| None | 505 (94.5) |
| Ramus, n (%) | |
| Mild | 6 |
| Moderate | 1 |
| Occluded | 1 |
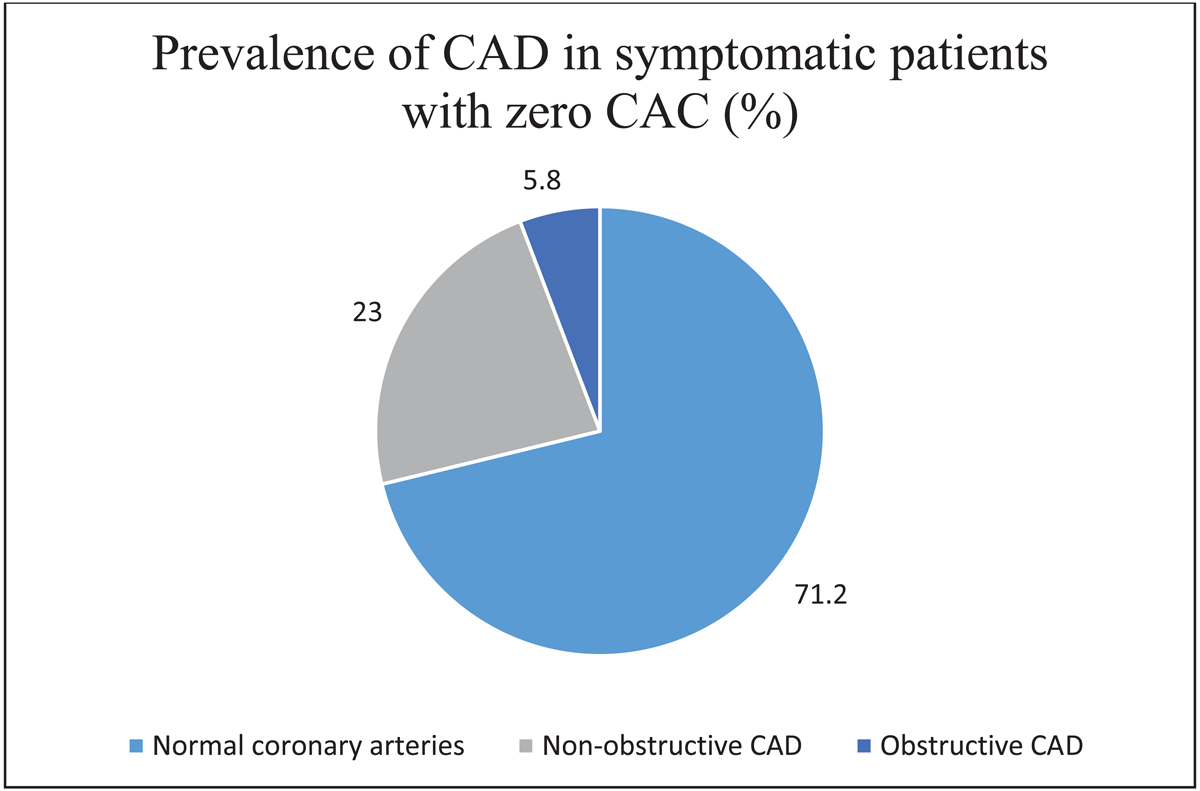
Figure 2
Distribution of coronary artery disease in symptomatic patients with zero Agatston score. CAC, coronary artery calcium. CAD, coronary artery disease.
Table 3
Outcome on follow-up.
| OUTCOMES ON FOLLOW-UP | N (%) |
|---|---|
| Follow-up available | 328 (61.4) |
| Follow-up duration, mean | 96.6 months ± 49.8 (range 21–194 months), |
| Mortality | 10 (3) |
| Angina | 13 (3.96) |
| Non-fatal MI | 4 (1.2) |
| Revascularization | 9 (2.7) |
| Non-elective revascularization | 4 (1.2) |
| All-cause MACE (Major adverse cardiovascular events) | 29 (8.8) |
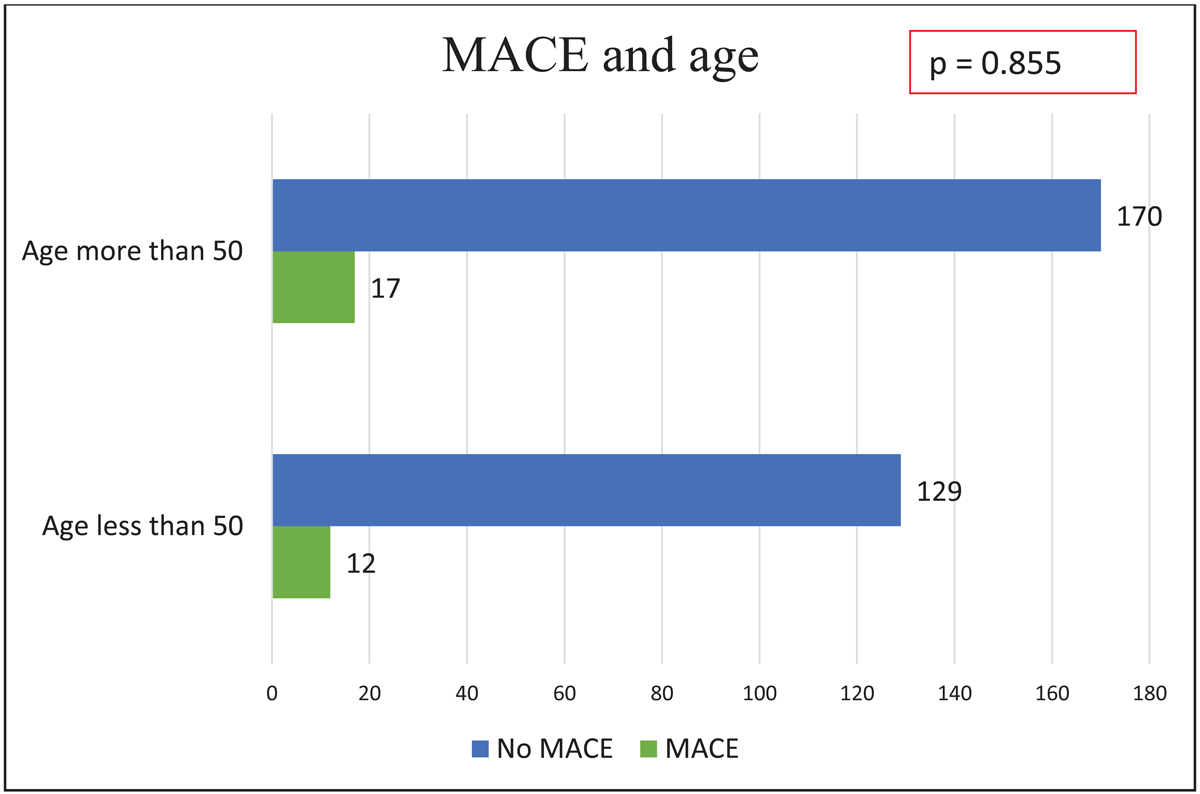
Figure 3
Major adverse cardiovascular events by age.
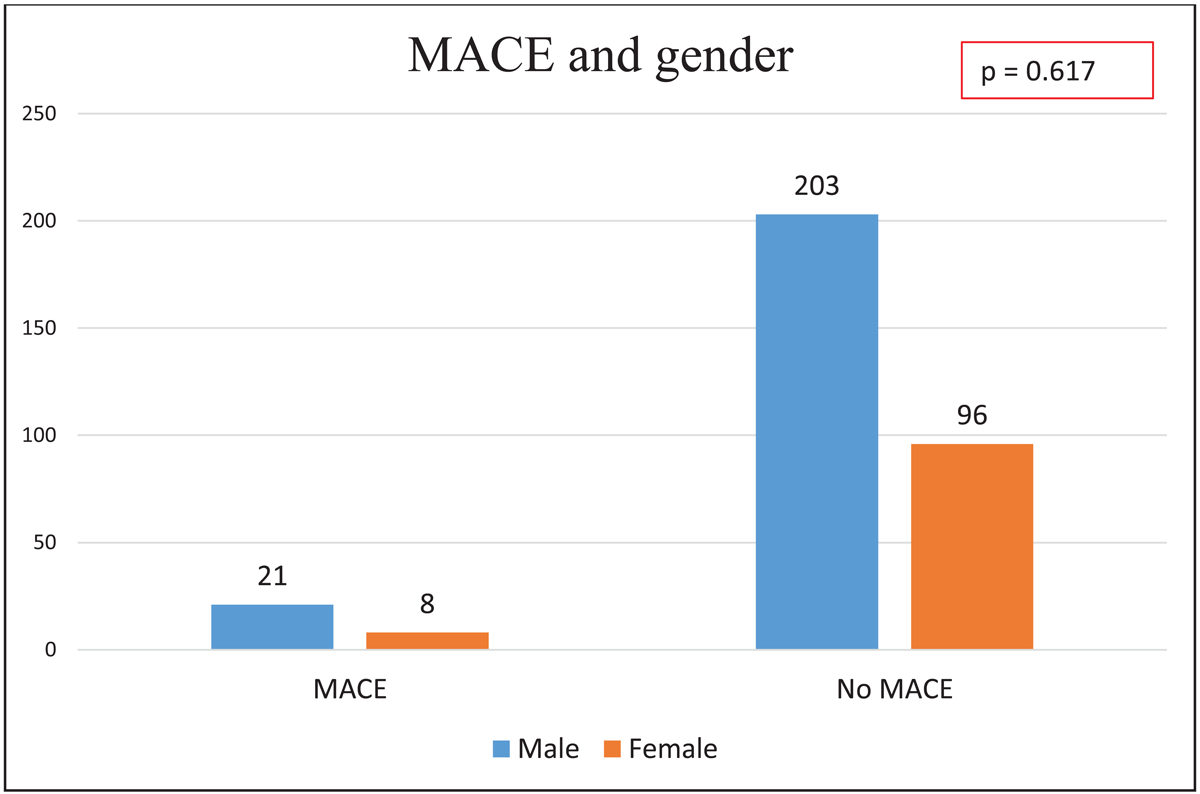
Figure 4
Major adverse cardiovascular events by gender.
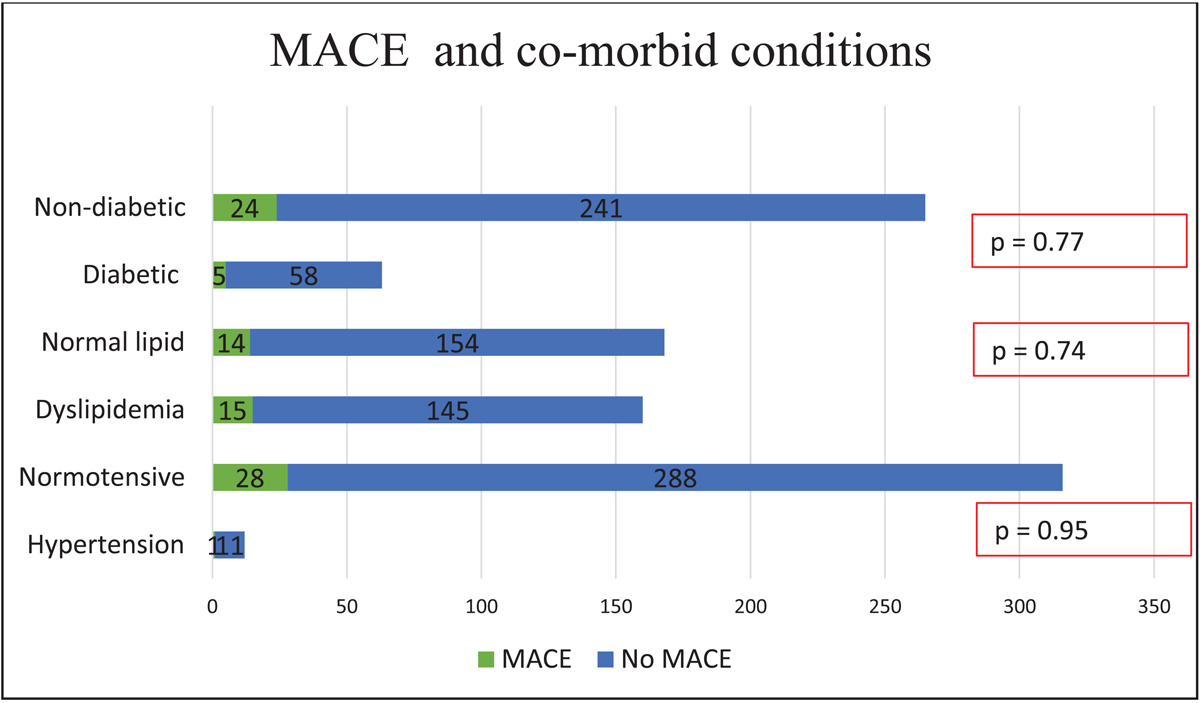
Figure 5
Major adverse cardiovascular events by co-morbid conditions.
Table 4
Comparison of patients with and without major adverse cardiovascular events on follow-up.
| VARIABLES | MACE | NO MACE | P VALUE |
|---|---|---|---|
| Age, more than 50 years | 17 | 170 | 0.855 |
| Gender, Male (n) | 21 | 203 | 0.617 |
| Hypertension | 1 | 11 | 0.95 |
| Dyslipidemia | 15 | 145 | 0.74 |
| Diabetes Mellitus | 5 | 58 | 0.778 |
| Symptoms, chest pain | 29 | 288 | 0.293 |
| Symptoms, dyspnea | 0 | 10 | 0.317 |
| CAD > 50% | 2 | 17 | 0.79 |
Table 5
Comparison of patients with and without obstructive coronary artery disease.
| VARIABLES | CAD MORE THAN 50% | CAD LESS THAN 50% | P VALUE |
|---|---|---|---|
| Gender, male | 24 | 341 | 0.263 |
| Gender, female | 7 | 162 | |
| Hypertension | 1 | 18 | 0.918 |
| Diabetes mellitus | 6 | 92 | 0.882 |
| Dyslipidemia | 17 | 250 | 0.579 |
| Family history, premature coronary artery disease | 0 | 9 | 0.453 |
| Chest pain | 30 | 491 | 0.768 |
| Dyspnea | 1 | 12 | 0.768 |
Table 6
Outcomes of symptomatic patients with and without obstructive coronary artery disease.
| OUTCOME VARIABLES | CAD > 50% | CAD < 50% | P VALUE |
|---|---|---|---|
| All-cause MACE | 2 | 27 | 0.79 |
| Mortality on follow-up | 1 | 9 | 0.82 |
| Angina on follow-up | 1 | 12 | 0.765 |
| Non-fatal MI on follow-up | 0 | 4 | 0.618 |
| Revascularization on follow-up | 0 | 9 | 0.45 |
| Non-elective revascularization | 0 | 4 | 0.618 |
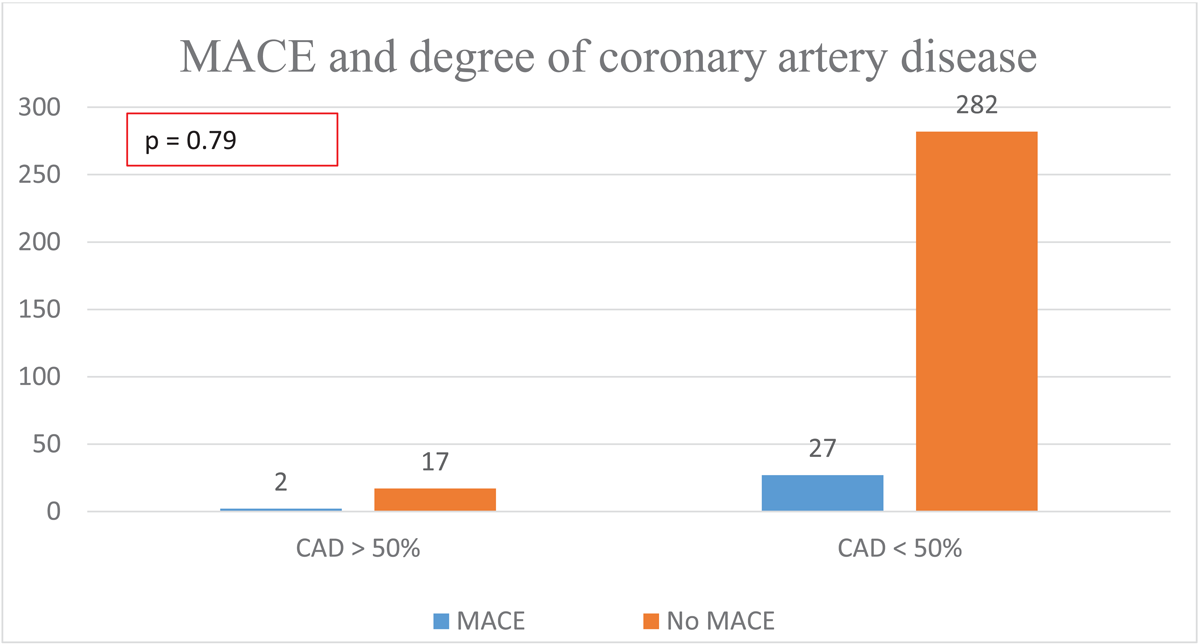
Figure 6
Major adverse cardiovascular events by degree of coronary artery stenosis.