
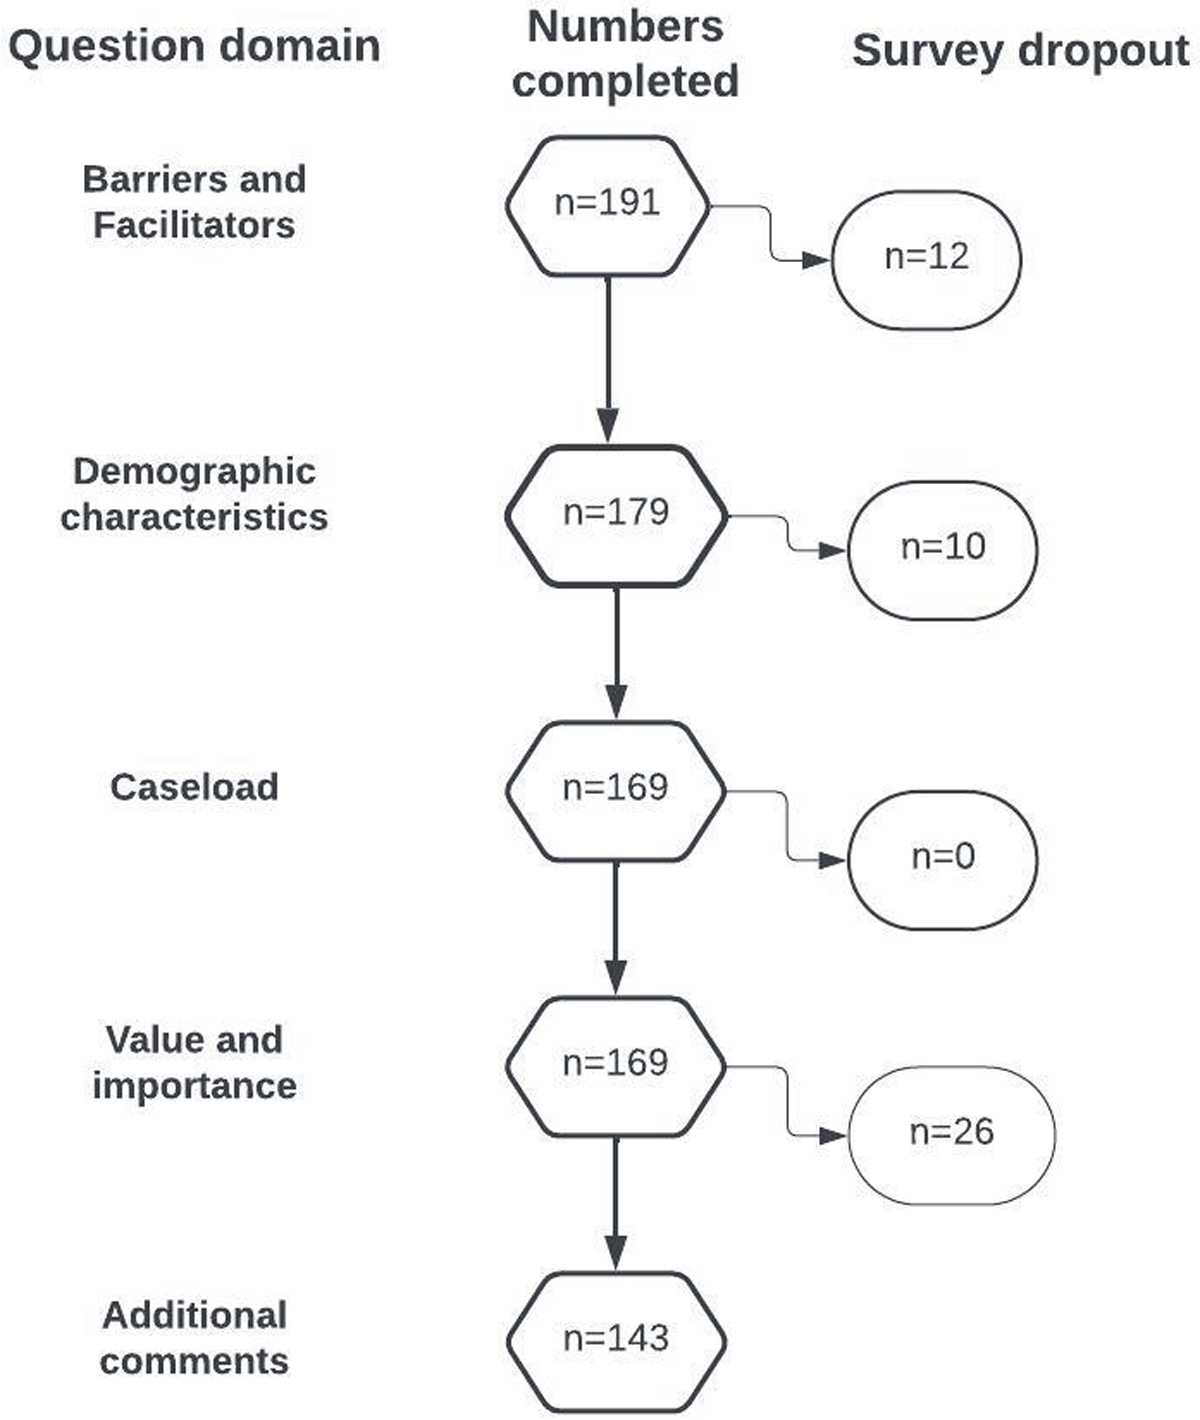
Figure 1
Number of participants who completed each block of survey questions.
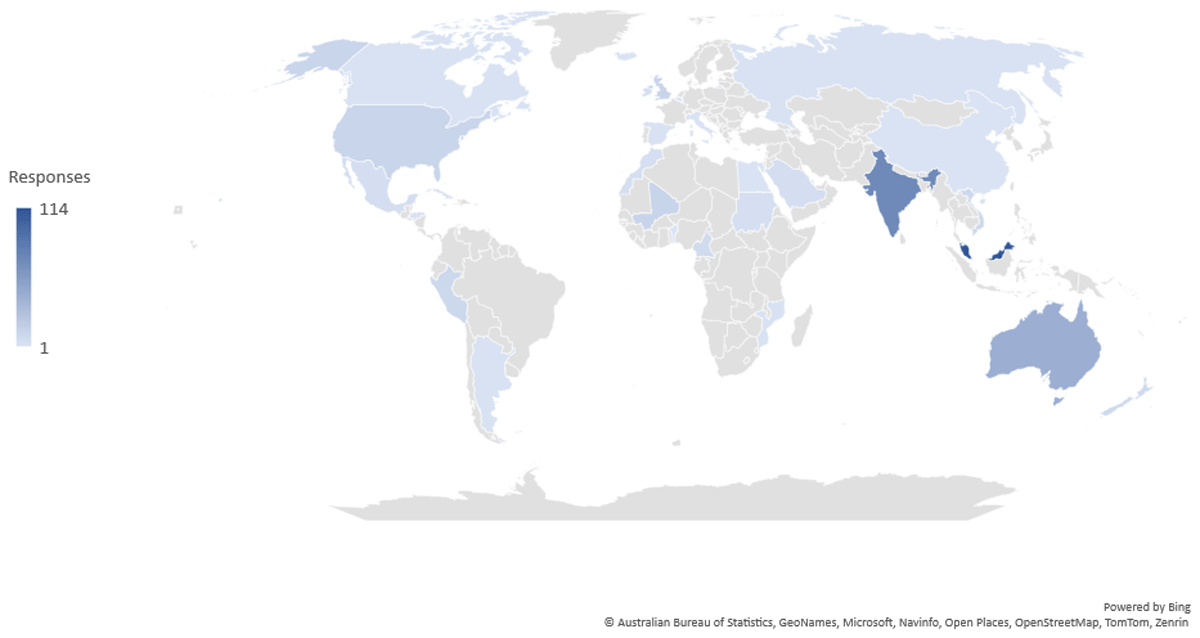
Figure 2
Map of countries represented.
Number of participants per country: Argentina (n = 1), Australia (n = 21), Bahamas (n = 1), Bahrain (n = 2), Belgium (n = 1), Cote d’Ivoire (n = 2), Cameroon (n = 5), Honduras (n = 1), India (n = 34), Jamaica (n = 1), Malaysia (n = 64), Mali (n = 8), Mexico (n = 3), Mozambique (n = 1), New Zealand (n = 6), Peru (n = 5), Saint Kitts (n = 1), Saudi Arabia (n = 4), Singapore (n = 2), Spain (n = 1), Sudan (n = 2), United Kingdom (n = 3), United States of America (n = 5), Viet Nam (n = 5).
Table 1
Participant characteristics, clinical experience, and prescribing patterns.
| OVERALL COHORT (n = 179) | HIGH INCOME COUNTRIES (GROSS NATIONAL INCOME (GNI) PER CAPITA IN US DOLLARS $13,846 OR MORE) (n = 47) | UPPER MIDDLE-INCOME COUNTRIES (GNI $4,466USD TO $13,845) (n = 73) | LOWER MIDDLE-INCOME COUNTRIES (GNI $1,136USD TO $4,465) (n = 49) | LOW-INCOME COUNTRIES (GNI $1.135USD OR LESS) (n = 10) | |
|---|---|---|---|---|---|
| Age, (n (%)) | |||||
| 25 years or less | 1 (1%) | 1 (2%) | 0 | 0 | 0 |
| 26–35years | 55 (31%) | 8 (17%) | 19 (26%) | 27 (56%) | 1 (9%) |
| 36–45 years | 71 (40%) | 14 (30%) | 39 (53%) | 14 (29%) | 4 (36%) |
| 46–55 years | 30 (17%) | 10 (21%) | 11 (15%) | 4 (8%) | 5 (45%) |
| 56–65 years | 14 (8%) | 10 (21%) | 3 (4%) | 1 (2%) | 0 |
| 66+ years | 8 (5%) | 0 | 0 | 0 | 0 |
| Gender, (n (%)) | |||||
| Male | 111 (62%) | 29 (62%) | 40 (55%) | 34 (69%) | 8 (80%) |
| Female | 68 (38%) | 17 (36%) | 33 (45%) | 15 (31%) | 2 (20%) |
| Non-binary/third gender | 0 | 1 (2%) | 0 | 0 | 0 |
| Years practicing, median (IQR) | 13 (8, 20) | 18 (10, 30) | 14 (10, 19) | 9 (5, 15) | 20 (16, 22) |
| Specialty, (n (%)) | |||||
| Cardiologist | 40 (22%) | 13 (28%) | 8 (11%) | 10 (20%) | 9 (90%) |
| Endocrinologist | 3 (2%) | 0 | 3 (4%) | 0 | 0 |
| Family Practitioner | 45 (25%) | 27 (57%) | 11 (15%) | 7 (15%) | 0 |
| Geriatrician | 52 (29%) | 4 (9%) | 21 (29%) | 27 (56%) | 0 |
| Nephrologist | 4(2%) | 1 (2%) | 3 (4%) | 0 | 0 |
| Anaesthetist | 1 (1%) | 0 | 1 (2%) | 0 | 0 |
| Emergency | 1 (1%) | 0 | 1 (2%) | 0 | 0 |
| General Medicine | 10 (6%) | 1 (2%) | 7 (15%) | 1 (2%) | 1 (9%) |
| Internal Medicine | 12 (7%) | 0 | 9 (19%) | 3 (6%) | |
| Neurology | 4 (2%) | 0 | 4 (8%) | 0 | |
| Neurosurgery | 1 (1%) | 0 | 1 (2%) | 0 | |
| Rehab | 3 (2%) | 1 (2%) | 2 (4%) | 0 | |
| Rheumatology | 3 (2%) | 0 | 2 (4%) | 1 (2%) | |
| Patients per week, (n (%)) | |||||
| 0–20 | 78 (44%) | 26 (57%) | 39 (53%) | 8 (16%) | 5 (50%) |
| 21–40 | 45 (25%) | 11 (24%) | 19 (26%) | 13 (27%) | 2 (20%) |
| 41–60 | 24 (13%) | 5 (11%) | 9 (12%) | 9 (19%) | 1 (10%) |
| 61–80 | 13 (7%) | 2 (4%) | 2 (3%) | 8 (17%) | 1 (10%) |
| 81–100 | 7 (4%) | 1 (2%) | 3 (4%) | 2 (4%) | 1 (10%) |
| 100+ | 11 (6%) | 1 (2%) | 1 (1%) | 9 (19%) | 0 |
| Considering your last working week, what percentage of the patients you saw were on the following antihypertensive regimens: [n; mean (IQR)] | |||||
| Initial monotherapy | 160; 28 (16, 39) | 44; 29 (19, 42) | 68; 29 (16, 43) | 41; 27 (15, 34) | 7; 24 (10, 35) |
| Single pill combination of two medicines | 160; 22 (8, 30) | 44; 20 (10, 27) | 68; 15 (3, 21) | 41; 31 (19, 39) | 7; 46 (33, 52) |
| Single pill combination of three or more medicines | 160; 8 (0, 11) | 44; 10 (0, 18) | 68; 6 (0, 8) | 41; 9 (2, 10) | 7; 11 (3, 16) |
| Two blood pressure lowering medicines separately | 160; 26 (17, 35) | 44; 26 (15, 40) | 68; 30 (21, 37) | 41; 22 (15, 29) | 7; 16 (9, 23) |
| Three or more blood pressure lowering medicines separately | 160; 16 (5, 23) | 44; 15 (6, 21) | 68; 20 (10, 30) | 41; 12 (4, 21) | 7; 3 (0, 5) |
| Thinking about the patients you saw last week on single drug monotherapy; what percentage are on each on the following: [n; mean (IQR)] | |||||
| ACE inhibitor or ARB (Ramipril or telmisartan) | 160; 33 (21, 38) | 44; 38 (23, 55) | 68; 32 (22, 33) | 41; 28 (20, 36) | 7; 32 (7, 22) |
| Dihydropyridine calcium channel blocker (amlodipine) | 160; 31 (19, 42) | 44; 28 (10, 29) | 68; 29 (22, 41) | 41; 36 (23, 45) | 7; 29 (25, 60) |
| Thiazide-like diuretic (e.g. hydrochlorothiazide) | 160; 10 (1, 15) | 44; 7 (1, 17) | 68; 13 (1, 10) | 41; 9 (7, 15) | 7; 7 (1, 8) |
| Loop diuretic (e.g. furosemide) | 160; 6 (0, 10) | 44; 5 (0, 9) | 68; 6 (0, 12) | 41; 6 (1, 8) | 7; 11 (0, 3) |
| Beta blocker (e.g. atenolol. metoprolol) | 160; 14 (7, 20) | 44; 13 (5, 16) | 68; 14 (8, 23) | 41; 14 (7, 17) | 7; 14 (8, 23) |
| Other blood pressure lowering medicine | 160; 7 (1, 10) | 44; 9 (1, 10) | 68; 6 (0, 10) | 41;7 (3, 10) | 7; 7 (2, 8) |
Table 2
Barriers and facilitators to prescribing for doctors in high- and upper-middle income or lower-middle and low-income countries.
| STATEMENTS ABOUT BARRIERS AND FACILITATORS TO PRESCRIBING FIXED-DOSE COMBINATION ANTIHYPERTENSIVE MEDICATIONS FOR THE CONTROL OF HYPERTENSION | ALL (INCLUDING DATA WHERE COUNTRY OF WORK WAS NOT AVAILABLE) n = 179 | HIGHER INCOME n = 120 | LOWER INCOME n = 59 | STANDARDIZED MEAN DIFFERENCE (BETWEEN HIGHER AND LOWER INCOME COUNTRIES) | 95% CONFIDENCE INTERVAL |
|---|---|---|---|---|---|
| Appointment Time You have insufficient time during consultations to explain medication changes to the patient. | |||||
| Strongly disagree | 35 (20%) | 23 (19%) | 12 (20%) | 0.01 | –0.30 to 0.32 |
| Disagree | 61 (34%) | 39 (32%) | 22 (37%) | ||
| Neither disagree nor agree | 21 (12%) | 18 (15%) | 3 (5%) | ||
| Agree | 55 (31%) | 36 (30%) | 19 (32%) | ||
| Strongly agree | 7 (4%) | 4 (3%) | 3 (5%) | ||
| Access Your patients do not have access to fixed-dose combination antihypertensive medications where you work. | |||||
| Strongly disagree | 57 (32%) | 34 (28%) | 23 (39%) | 0.08 | –0.23 to 0.39 |
| Disagree | 40 (22%) | 28 (23%0 | 12 (20%) | ||
| Neither disagree nor agree | 15 (8%) | 13 (11%) | 2 (3%) | ||
| Agree | 38 (21%) | 28 (23%) | 10 (17%) | ||
| Strongly agree | 29 (16%) | 17 (14%) | 12 (20%) | ||
| Confidence in clinic BP measurement You do not trust blood pressure measurements taken in the clinic setting. | |||||
| Strongly disagree | 34 (19%) | 22 (18%) | 12 (20%) | 0.14 | –0.17 to 0.45 |
| Disagree | 47 (26%) | 29 (24%) | 18 (31%) | ||
| Neither disagree nor agree | 28 (16%) | 21 (18%) | 7 (12%) | ||
| Agree | 62 (35%) | 41 (34%) | 21 (36%) | ||
| Strongly agree | 8 (5%) | 7 (6%) | 1 (2%) | ||
| Cost to the medical practice Fixed-dose combination antihypertensive medications are too expensive for your medical practice to support. | |||||
| Strongly disagree | 23 (13%) | 18 (16%) | 5 (9%) | 0.07 | –0.24 to 0.39 |
| Disagree | 42 (25%) | 23 (20%) | 19 (33%) | ||
| Neither disagree nor agree | 19 (11%) | 13 (11%) | 6 (11%) | ||
| Agree | 60 (35%) | 40 (35%) | 20 (35%) | ||
| Strongly agree | 27 (16%) | 23 (18%) | 7 (12%) | ||
| Side effects Your patients are concerned about experiencing more adverse events (for example, dizziness, headache) when taking fixed-dose combination antihypertensive medications compared to adding medicines sequentially. | |||||
| Strongly disagree | 30 (17%) | 19 (16%) | 11 (19%) | –0.32 | –0.64 to –0.01 |
| Disagree | 68 (38%) | 52 (43%) | 16 (27%) | ||
| Neither disagree nor agree | 44 (25%) | 32 (27%) | 12 (20%) | ||
| Agree | 31 (17%) | 15 (12%) | 16 (27%) | ||
| Strongly agree | 6 (4%) | 2 (2%) | 4 (7%) | ||
| Adherence You are concerned your patients will not adhere to the fixed-dose combination medication regimen. | |||||
| Strongly disagree | 71 (40%) | 47 (39%) | 24 (41%) | –0.06 | –0.37 to 0.25 |
| Disagree | 72 (40%) | 48 (40%) | 24 (41%) | ||
| Neither disagree nor agree | 15 (9%) | 12 (10%) | 3 (5%) | ||
| Agree | 15 (9%) | 12 (10%) | 3 (5%) | ||
| Strongly agree | 6 (3%) | 1 (1%) | 5 (9%) | ||
| Clinician nudge A clinician nudge that provides a prompt in the electronic health record during the patient visit to prescribe fixed-dose combination antihypertensive medications would support the prescription of those medications. | |||||
| Strongly disagree | 8 (5%) | 8 (7%) | 0 | –0.13 | –.44 to 0.19 |
| Disagree | 15 (8%) | 11 (9%) | 4 (7%) | ||
| Neither disagree nor agree | 47 (26%) | 27 (22%) | 20 (34%) | ||
| Agree | 80 (45%) | 54 (45%) | 26 (44%) | ||
| Strongly agree | 29 (16%) | 20 (17%) | 9 (15%) | ||
| Education Providing education and feedback on prescribing patterns compared with peers focusing on fixed-dose combination antihypertensive medications would support the prescription of those medications. | |||||
| Strongly disagree | 9 (5%) | 6 (5%) | 3 (5%) | 0.01 | –0.30 to 0.33 |
| Disagree | 10 (6%) | 6 (5%) | 4 (7%) | ||
| Neither disagree nor agree | 17 (10%) | 11 (9%) | 6 (10%) | ||
| Agree | 59 (33%) | 42 (35%) | 17 (29%) | ||
| Strongly agree | 84 (46%) | 55 (46%) | 29 (49%) | ||
| Additional BP measures data Having access to data from remote monitoring devices such as smartwatches would support the prescription of fixed-dose combination antihypertensive medications. | |||||
| Strongly disagree | 9 (5%) | 6 (5%) | 3 (5%) | 0.23 | –0.08 to 0.55 |
| Disagree | 24 (13%) | 13 (11%) | 11 (19%) | ||
| Neither disagree nor agree | 16 (15%) | 18 (15%) | 8 (14%) | ||
| Agree | 79 (44%) | 51 (42%) | 28 (47%) | ||
| Strongly agree | 41 (23%) | 32 (27%) | 9 (15%) | ||
| Health literacy Patient information such as leaflets and flyers in clinics focusing on fixed-dose combination antihypertensive medications would support the prescription of those medications. | |||||
| Strongly disagree | 18 (10%) | 12 (10%) | 6 (10%) | 0.03 | –0.29 to 0.34 |
| Disagree | 22 (12%) | 15 (12%) | 7 (12%) | ||
| Neither disagree nor agree | 51 (28%) | 34 (28%) | 17 (29%) | ||
| Agree | 66 (37%) | 43 (36%) | 23 (39%) | ||
| Strongly agree | 22 (12%) | 16 (13%) | 6 (10%) | ||
Table 3
Relationship between frequency of prescribing FDC antihypertensive medicines and barriers and facilitators.
| BARRIER OR FACILITATOR | β | 95% CONFIDENCE INTERVAL | P-VALUE | P-VALUE (95% CI) FOR INTERACTION WITH COUNTRY INCOME LEVEL |
|---|---|---|---|---|
| Appointment time | –0.06 | –0.43 to 0.31 | 0.74 | |
| Access | –0.58 | –0.86 to –0.29 | <0.001 | 0.22 (–0.28 to 0.71) |
| Confidence in blood pressure (BP) measurement | –0.35 | –0.70 to 0.01 | 0.06 | |
| Cost to medical practice | –0.81 | –1.14 to –0.50 | <0.001 | 0.02 (–0.57 to 0.61) |
| Side effects | –0.32 | –0.74 to 0.10 | 0.13 | |
| Adherence | 0.00 | –0.43 to 0.43 | 0.99 | |
| Clinician nudge | 0.22 | –0.22 to 0.66 | 0.33 | |
| Education | –0.10 | –0.50 to 0.30 | 0.62 | |
| Additional BP measures data | –0.17 | –0.56 to 0.23 | 0.40 | |
| Health literacy | 0.11 | –0.29 to 0.50 | 0.59 |
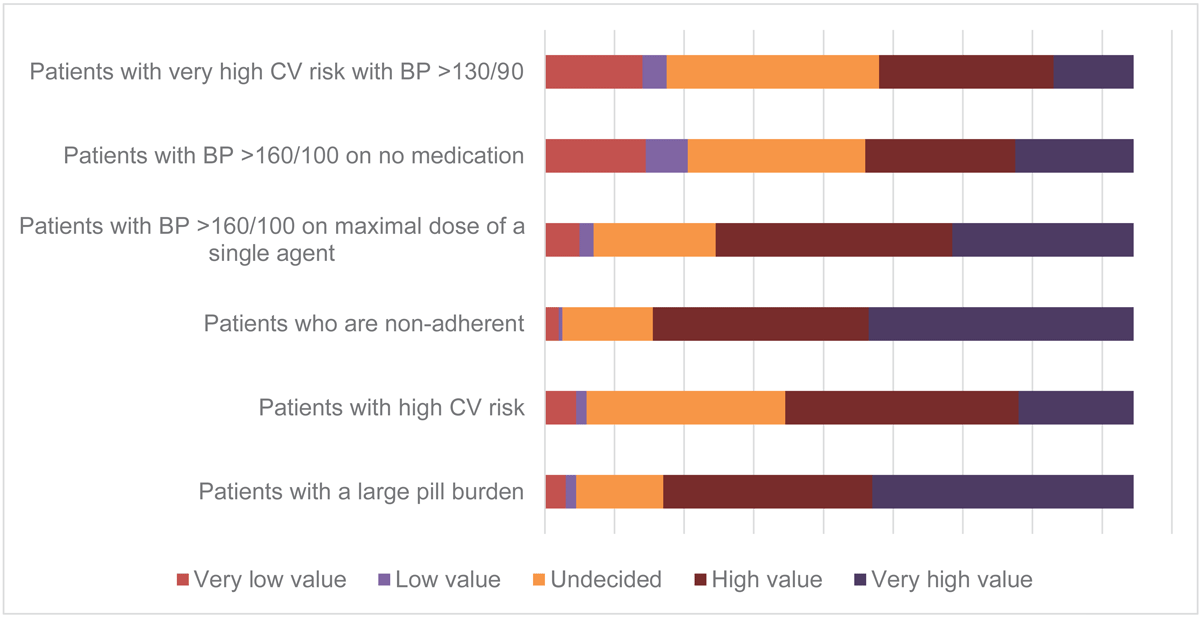
Figure 3
Value placed on fixed-dose combination antihypertensive medication in clinical scenarios.
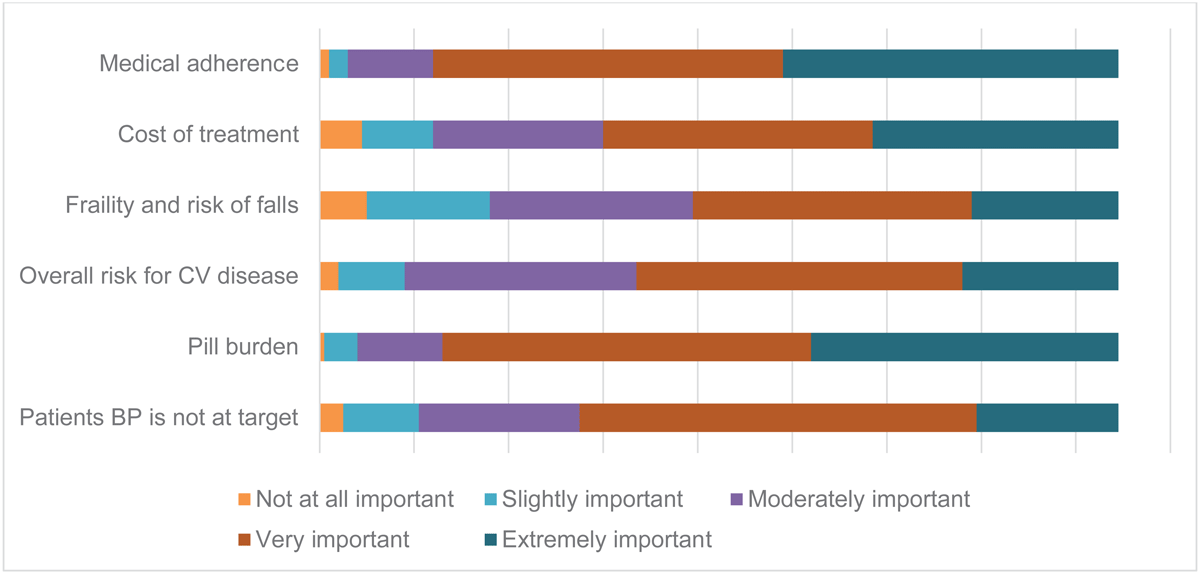
Figure 4
Factors important in the decision to initiate fixed-dose combination medicines.