
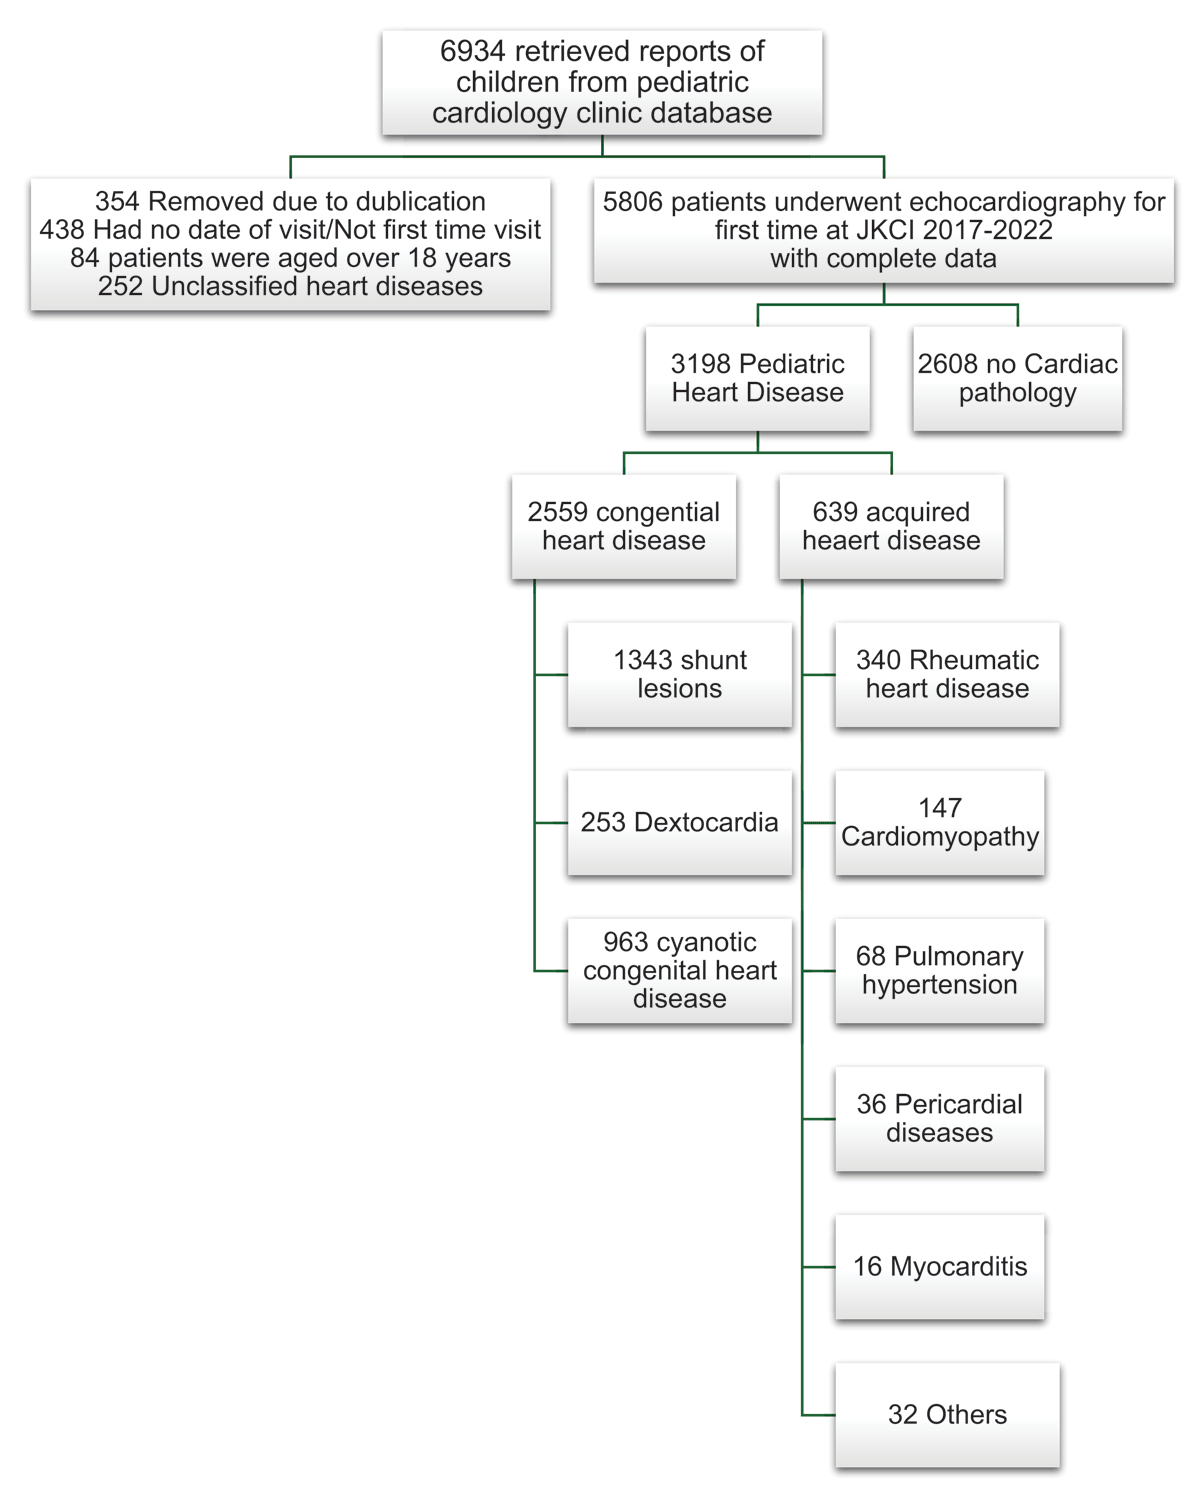
Figure 1
Flow chart of patients undergoing first Echocardiography at JKCI between 2017 to 2022.
Table 1
Demographic Characteristics of Children with Heart Disease.
| VARIABLE | CONGENITAL HEART DISEASE (n = 2559) | ACQUIRED HEART DISEASE (n = 639) | TOTAL |
|---|---|---|---|
| Age in Yrs (Median; IQR) | 1.0 (0.33–3.5) | 9.7 (3.2–13.8) | 1.4 (0.4–5.8) |
| Sex N(%) | |||
| Female | 1250 (48.8%) | 320 (50.1%) | 1570 (49.1%) |
| Male | 1309 (51.2%) | 319 (49.9%) | 1628 (50.9%) |
| Body Weight in kg (Median; IQR),n = 2,403 CHD; n = 580 AHD | 7.0 (5.0–12.0) | 21.0 (11.0–32.6) | 8.0 (5.0–16.0) |
| Height in cm (Median; IQR),n = 1,544 CHD; n = 352 AHD | 67 (57.0–89.0) | 123.0 (86.3–144.0) | 70.0 (59.0–103.0) |
[i] CHD = congenital heart disease; AHD = acquired heart disease.
Table 2
Distribution of Various Congenital Heart Diseases by Gender and Year.
| LESION TYPES | GENDER DISTRIBUTION | AGE AT DIAGNOSIS | YEAR OF DIAGNOSIS | |||||||||
|---|---|---|---|---|---|---|---|---|---|---|---|---|
| MALE n 1,309 | FEMALE n 1,242 | TOTAL n 2,551 | % | MEDIAN AGE | RANGE | 2017 | 2018 | 2019 | 2020 | 2021 | 2022 | |
| Ventricular septal defect | 279 | 213 | 492 | 19.2 | 1.0 | 16.5 | 112 | 54 | 83 | 58 | 101 | 84 |
| Patent ductus arteriosus | 200 | 286 | 486 | 19.0 | 0.9 | 17.3 | 67 | 45 | 70 | 69 | 135 | 100 |
| Atrial septal defect | 175 | 210 | 385 | 15.1 | 0.8 | 17.8 | 47 | 29 | 45 | 69 | 101 | 94 |
| Tetralogy of Fallot | 201 | 138 | 339 | 13.3 | 2.3 | 16.5 | 63 | 27 | 42 | 48 | 86 | 73 |
| Dextrocardia | 135 | 112 | 247 | 9.7 | 0.8 | 15.4 | 5 | 0 | 44 | 77 | 69 | 52 |
| Atrio ventricular septal defect | 56 | 63 | 119 | 4.7 | 0.6 | 17.1 | 29 | 15 | 15 | 4 | 26 | 30 |
| Pulmonary valve stenosis | 59 | 38 | 97 | 3.8 | 1.0 | 16.5 | 13 | 13 | 15 | 17 | 25 | 14 |
| Transposition of great arteries | 33 | 27 | 60 | 2.3 | 0.3 | 13.7 | 6 | 7 | 7 | 5 | 19 | 16 |
| Double outlet right ventricle | 49 | 44 | 93 | 3.6 | 1.0 | 17.7 | 11 | 7 | 16 | 13 | 23 | 23 |
| Persistent truncus arteriosus | 35 | 34 | 69 | 2.7 | 0.8 | 14.0 | 10 | 14 | 13 | 6 | 11 | 15 |
| Pulmonary valve atresia | 8 | 7 | 15 | 0.6 | 0.2 | 13.6 | 2 | 1 | 3 | 2 | 3 | 4 |
| Hypoplastic left heart syndrome | 6 | 7 | 13 | 0.1 | 1.4 | 6.7 | 0 | 0 | 0 | 3 | 7 | 4 |
| Tricuspid atresia (or stenosis) | 30 | 30 | 60 | 2.3 | 0.8 | 12.9 | 11 | 6 | 14 | 10 | 12 | 7 |
| Others | 43 | 33 | 76 | 2.9 | 5 | 5 | 11 | 12 | 18 | 23 | ||
| Total | 381 | 223 | 378 | 393 | 636 | 539 | ||||||
Table 3
Distribution of Acquired Head Disease.
| DISTRIBUTION OF ACQUIRED HEART DISEASES N 639 | ||
|---|---|---|
| TYPES | FREQUENCY | PERCENTAGE |
| Rheumatic heart disease | 340 | 53.2 |
| Dilated cardiomyopathy | 147 | 23.0 |
| Myocardidtis | 16 | 2.5 |
| Pericardial diseases | 36 | 5.6 |
| Pulmonary hypertension | 68 | 10.6 |
| Others | 32 | 5.0 |
Table 4
Distribution of Rheumatic Heart Disease by Valvular Type N 340.
| TYPE | FREQUENCY | PERCENTAGE |
|---|---|---|
| Mitral stenosis | 6 | 1.7 |
| Aortic stenosis | 5 | 1.5 |
| Combined mitral disease | 69 | 20.3 |
| Aortic insufficiency | 91 | 26.8 |
| Multiple valve disease | 74 | 21.8 |
| Mitral insufficiency | 91 | 26.8 |
| Tricuspid insufficiency | 4 | 1.2 |
Table 5
Plan of Care of Children with Heart Disease after First Echocardiography.
| PLAN | PLAN FOR CHILDREN WITH CONGENITAL HEART DISEASE | PLAN FOR CHILDREN WITH ACQUIRED HEART DISEASE | ||
|---|---|---|---|---|
| FREQUENCY | PERCENT | FREQUENCY | PERCENTAGE | |
| Established diagnosis, need treatment | 1,524 | 59.6 | 375 | 58.7 |
| Admitted for catheterization | 21 | 0.8 | 0 | 0.0 |
| Admitted for surgery | 72 | 2.8 | 2 | 0.3 |
| Admitted for medical treatment | 156 | 6.1 | 88 | 13.8 |
| Discharge from clinic | 45 | 1.8 | 25 | 3.9 |
| Further investigations | 685 | 26.8 | 125 | 19.6 |
| Medications | 56 | 2.2 | 24 | 3.8 |