
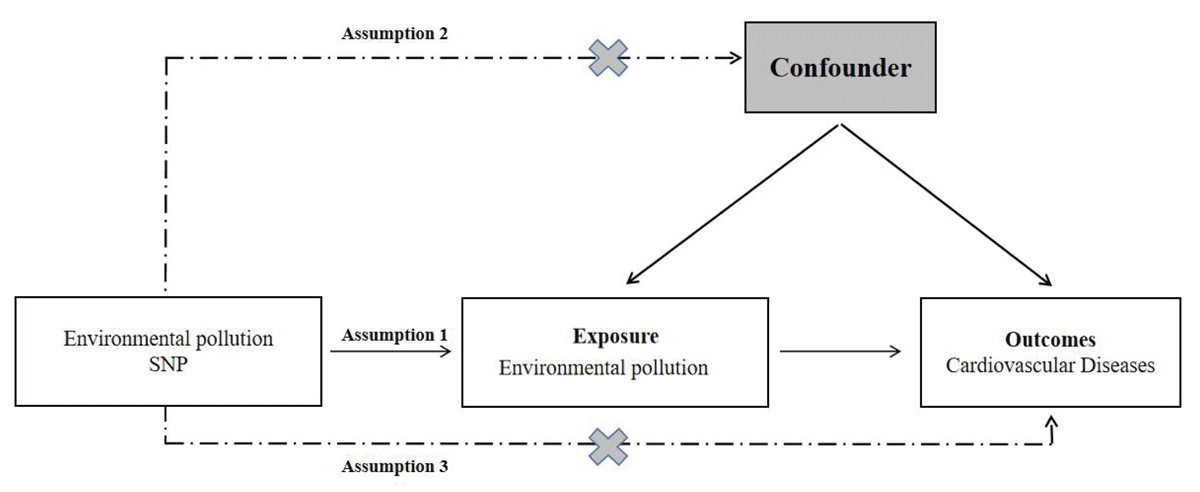
Figure 1
Study design flowchart of the Mendelian randomization study.
Table 1
Significant MR analysis results in the discovery samples.
| OUTCOME | EXPOSURE | METHOD | NO.SNP | OR | 95%CI | p | |
|---|---|---|---|---|---|---|---|
| LOWER | UPPER | ||||||
| Heart failure | Particulate matter air pollution (pm2.5) | IVW | 47 | 1.40 | 1.02 | 1.93 | 0.039 |
| Maximum likelihood | 47 | 1.42 | 1.14 | 1.76 | 0.002 | ||
| MR Egger | 47 | 1.20 | 0.50 | 2.88 | 0.689 | ||
| Weighted median | 47 | 1.17 | 0.85 | 1.62 | 0.344 | ||
| Weighted mode | 47 | 1.19 | 0.74 | 1.94 | 0.475 | ||
| Hypertension | Particulate matter air pollution (pm10) | IVW | 27 | 1.45 | 1.02 | 2.05 | 0.036 |
| Maximum likelihood | 27 | 1.47 | 1.03 | 2.11 | 0.033 | ||
| MR Egger | 27 | 1.26 | 0.61 | 2.58 | 0.542 | ||
| Weighted median | 27 | 1.45 | 0.88 | 2.38 | 0.142 | ||
| Weighted mode | 27 | 1.65 | 0.67 | 4.11 | 0.288 | ||
| Atrial fibrillation | Particulate matter air pollution (pm10) | IVW | 27 | 1.41 | 1.03 | 1.94 | 0.035 |
| Maximum likelihood | 27 | 1.44 | 1.10 | 1.89 | 0.008 | ||
| MR Egger | 27 | 1.53 | 0.75 | 3.13 | 0.252 | ||
| Weighted median | 27 | 1.29 | 0.87 | 1.91 | 0.209 | ||
| Weighted mode | 27 | 1.23 | 0.55 | 2.75 | 0.622 | ||
Table 2
Horizontal pleiotropy test and Heterogeneity test for significant MR analysis results.
| OUTCOMES | HORIZONTAL PLEIOTROPY | HETEROGENEITY | ||||||||
|---|---|---|---|---|---|---|---|---|---|---|
| MR-EGGER | MR-EGGER | IVW | ||||||||
| Intercept | SE | P-value | Q | Q_df | Q_P | Q | Q_df | Q_P | ||
| Heart failure | 0.0024 | 0.0063 | 0.706 | 108 | 45 | 4.246E-07 | 108.4 | 46 | 6.044E-07 | |
| Hypertension(PM10) | 0.003 | 0.0067 | 0.66 | 24.68 | 25 | 0.4807 | 24.87 | 26 | 0.5261 | |
| Atrial fibrillation | –0.0016 | 0.0064 | 0.802 | 39.41 | 25 | 0.0335 | 39.51 | 26 | 0.04353 | |
| Hypertension | 0.0021 | 0.0068 | 0.765 | 15.91 | 15 | 0.3883 | 16.01 | 16 | 0.4526 | |
| Coronary artery disease | –0.0037 | 0.0052 | 0.482 | 13.89 | 15 | 0.5338 | 14.41 | 16 | 0.5681 | |
| Coronary heart disease | –0.0096 | 0.0085 | 0.276 | 17.38 | 15 | 0.2969 | 18.86 | 16 | 0.2762 | |
| Myocardial infarction | –0.0021 | 0.0095 | 0.829 | 14.99 | 14 | 0.3788 | 15.04 | 15 | 0.4484 | |