
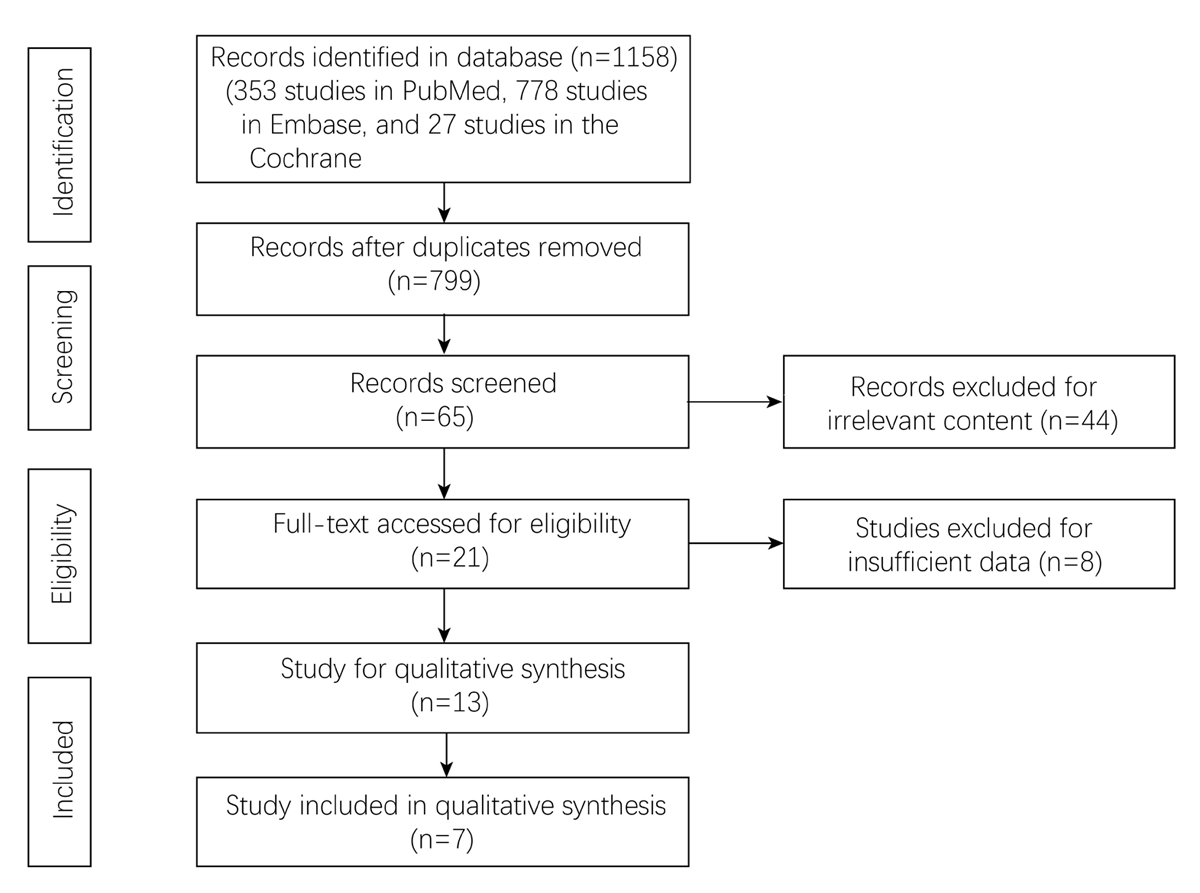
Figure 1
Flowchart of study selection.
Table 1
Characteristics of the studies included in the meta-analysis.
| AUTHOR | YEAR | COUNTRY | STUDY DATE | SURGERY TYPE | SAMPLE SIZE | FOLLOW-UP (MONTHS) | NOS | |
|---|---|---|---|---|---|---|---|---|
| LC | NON-LC | |||||||
| Shaheen AAM | 2009 | Canada | 1998–2004 | CABG | 711 | 402383 | 156 | 9 |
| MACARON C | 2012 | Florida | 1992–2009 | surgery with cardiopulmonary bypass | 54 | 216 | 3 | 7 |
| Ruiz-Morales J | 2015 | Spain | 1984–2008 | cardiac surgery | 308 | 2828 | 360 | 8 |
| Steffen RJ | 2017 | USA | 1998–2011 | AVR | 2769 | 421020 | 156 | 9 |
| Chou AH | 2017 | China | 1997–2011 | CABG | 1040 | 1040 | 32 | 8 |
| Singh V | 2018 | USA | 1998–2004 | CABG | 2231 | 696568 | 156 | 9 |
| Xavier S | 2019 | Canada | 2004–2014 | cardiac surgery | 60 | 310 | 120 | 8 |
[i] Abbreviations: LC, liver cirrhosis; CABG, coronary artery bypass graft; AVR, aortic valve replacement; NOS, Newcastle-Ottawa Scale.
Table 2
Summary of characteristics between LC group and Non-LC group.
| CHARACTERISTICS | STUDIES | PARTICIPANTS (LC/NON-LC) | MEAN DIFFERENCE/ODDS RATIO (95% CI) | MODEL | HETEROGENEITY |
|---|---|---|---|---|---|
| Baseline information | |||||
| Age, year | 4 | 4580/824753 | –8.47 [–22.71, 5.78]; P = 0.24 | RE | I2 = 100.00%; P = 0.00 |
| Gender, male | 6 | 4404/1103345 | 1.10 [0.94, 1.28]; P = 0.25 | RE | I2 = 64.11%; P = 0.02 |
| Race, white | 4 | 5765/1520187 | 0.57 [0.50, 0.65]; P = 0.00 | RE | I2 = 69.69%; P = 0.02 |
| Medical history | |||||
| Hypertension | 4 | 6100/1118938 | 0.70 [0.47, 1.06]; P = 0.09 | RE | I2 = 93.46%; P = 0.00 |
| Diabetes | 4 | 6100/1118938 | 1.37 [1.09, 1.71]; P = 0.01 | RE | I2 = 90.59%; P = 0.00 |
| COPD | 3 | 6040/1118628 | 1.44 [1.22, 1.70]; P = 0.00 | RE | I2 = 82.67%; P = 0.00 |
| Heart failure | 3 | 3869/422370 | 1.61 [0.63, 4.13]; P = 0.32 | RE | I2 = 97.59%; P = 0.00 |
| Prior MI | 2 | 1100/1350 | 0.94 [0.75, 1.18]; P = 0.60 | FE | I2 = 0.00%; P = 0.50 |
| Malignancy | 3 | 6040/1118628 | 1.22 [0.78, 1.91]; P = 0.37 | RE | I2 = 88.47%; P = 0.00 |
[i] Abbreviations: LC, liver cirrhosis; COPD, chronic obstructive pulmonary disease; MI, myocardial infarction; CI, confidence interval; RE, random-effects; FE, fixed-effects.
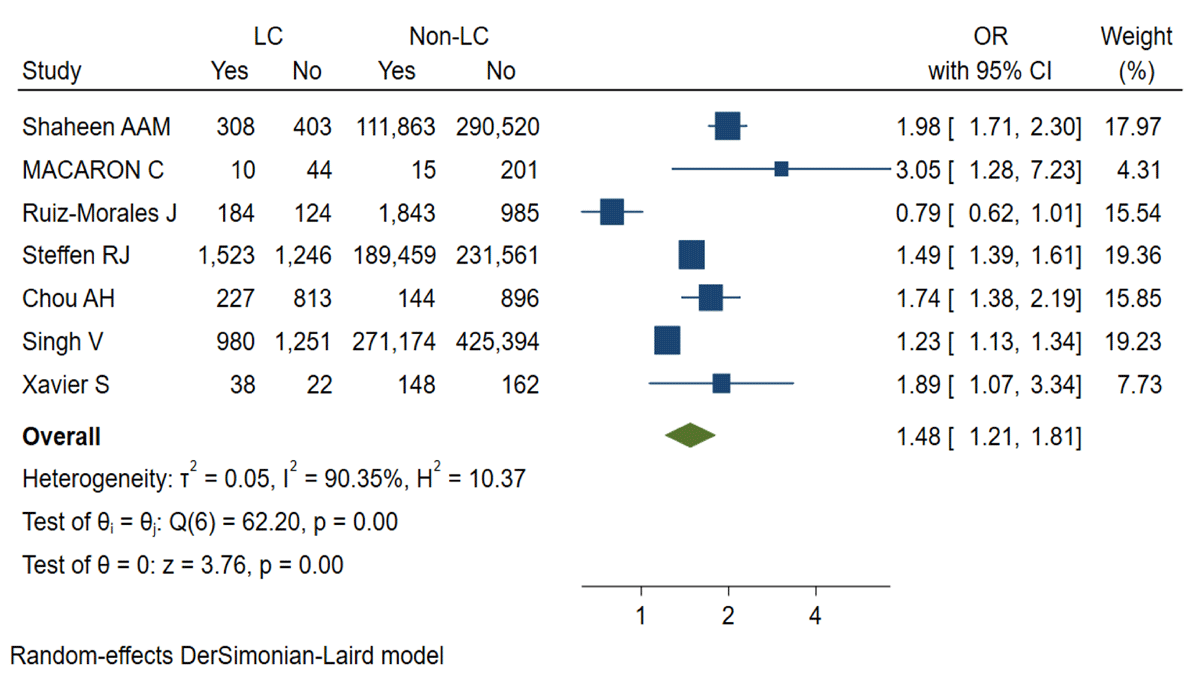
Figure 2
Overall complications of the LC group and the non-LC group.
Note: LC, liver cirrhosis.
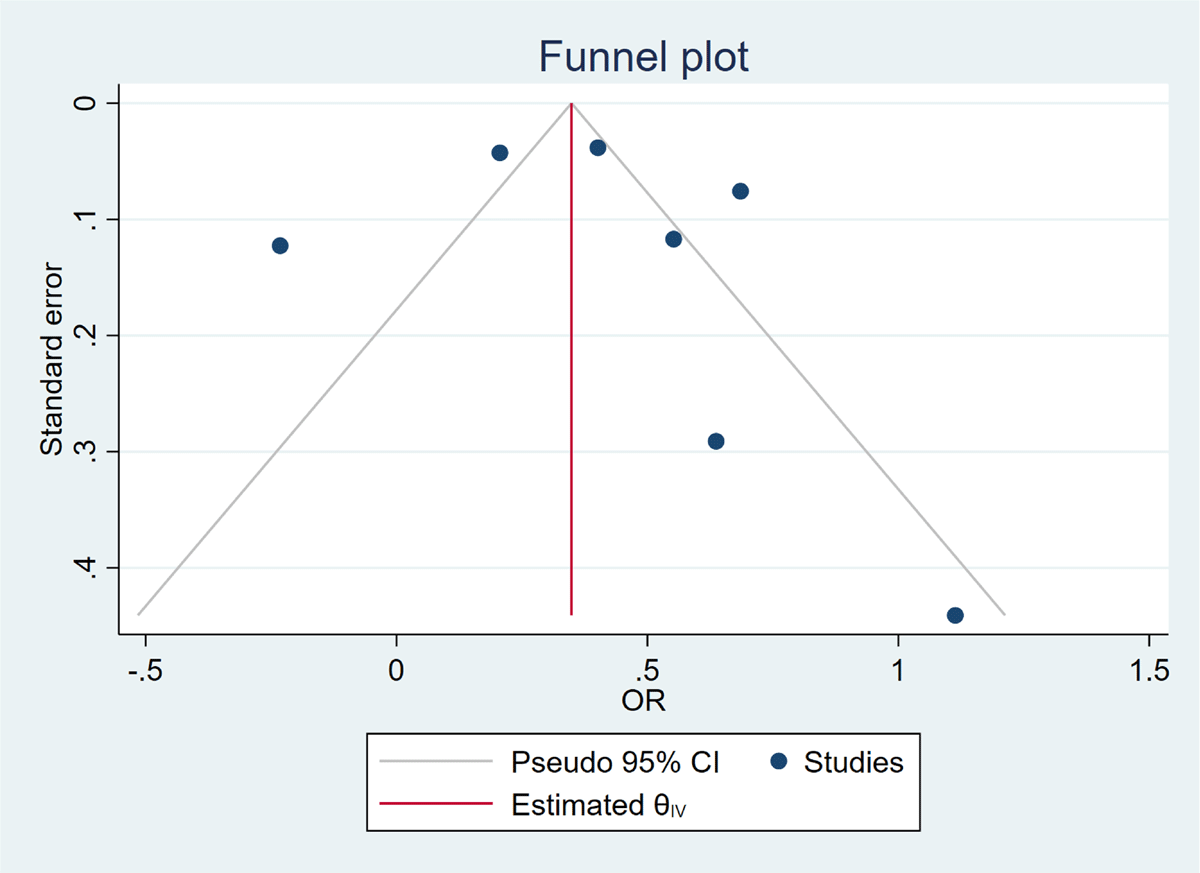
Figure 3
Funnel plot of overall complications.
Table 3
Summary of outcomes between LC group and Non-LC group.
| CHARACTERISTICS | STUDIES | PARTICIPANTS (LC/NON-LC) | HAZARD RATIO/ODDS RATIO (95% CI) | MODEL | HETEROGENEITY |
|---|---|---|---|---|---|
| Complications | |||||
| Any | 7 | 7173/1524365 | 1.48 [1.21, 1.81]; P = 0.00 | RE | I2 = 90.35%; P = 0.00 |
| Cardiovascular | 4 | 3310/1102089 | 1.07 [0.85, 1.35]; P = 0.58 | RE | I2 = 75.23%; P = 0.01 |
| Pulmonary | 3 | 3002/1099261 | 1.86 [1.21, 2.87]; P = 0.00 | RE | I2 = 90.79%; P = 0.00 |
| Gastrointestinal | 2 | 771/402693 | 2.03 [1.32, 3.11]; P = 0.00 | FE | I2 = 0.00%; P = 0.59 |
| Renal | 5 | 3364/1102305 | 2.20 [1.41, 3.45]; P = 0.00 | RE | I2 = 91.60%; P = 0.00 |
| Neurological | 3 | 2599/699706 | 1.14 [1.03, 1.26]; P = 0.01 | FE | I2 = 7.35%; P = 0.34 |
| Infectious | 4 | 4042/1100301 | 2.02 [1.17, 3.50]; P = 0.01 | RE | I2 = 92.37%; P = 0.00 |
| Long-term outcomes | |||||
| In-hospital death | 4 | NA | 2.53 [1.86, 3.20]; P = 0.00 | FE | I2 = 44.58%; P = 0.16 |
| Death | 4 | NA | 3.31 [1.54, 5.07]; P = 0.00 | RE | I2 = 93.81%; P = 0.00 |
[i] Abbreviations: LC, liver cirrhosis; ICU, intensive care unit; OS, overall survival; CI, confidence interval; RE, random-effects; FE, fixed-effects; NA, not apply.
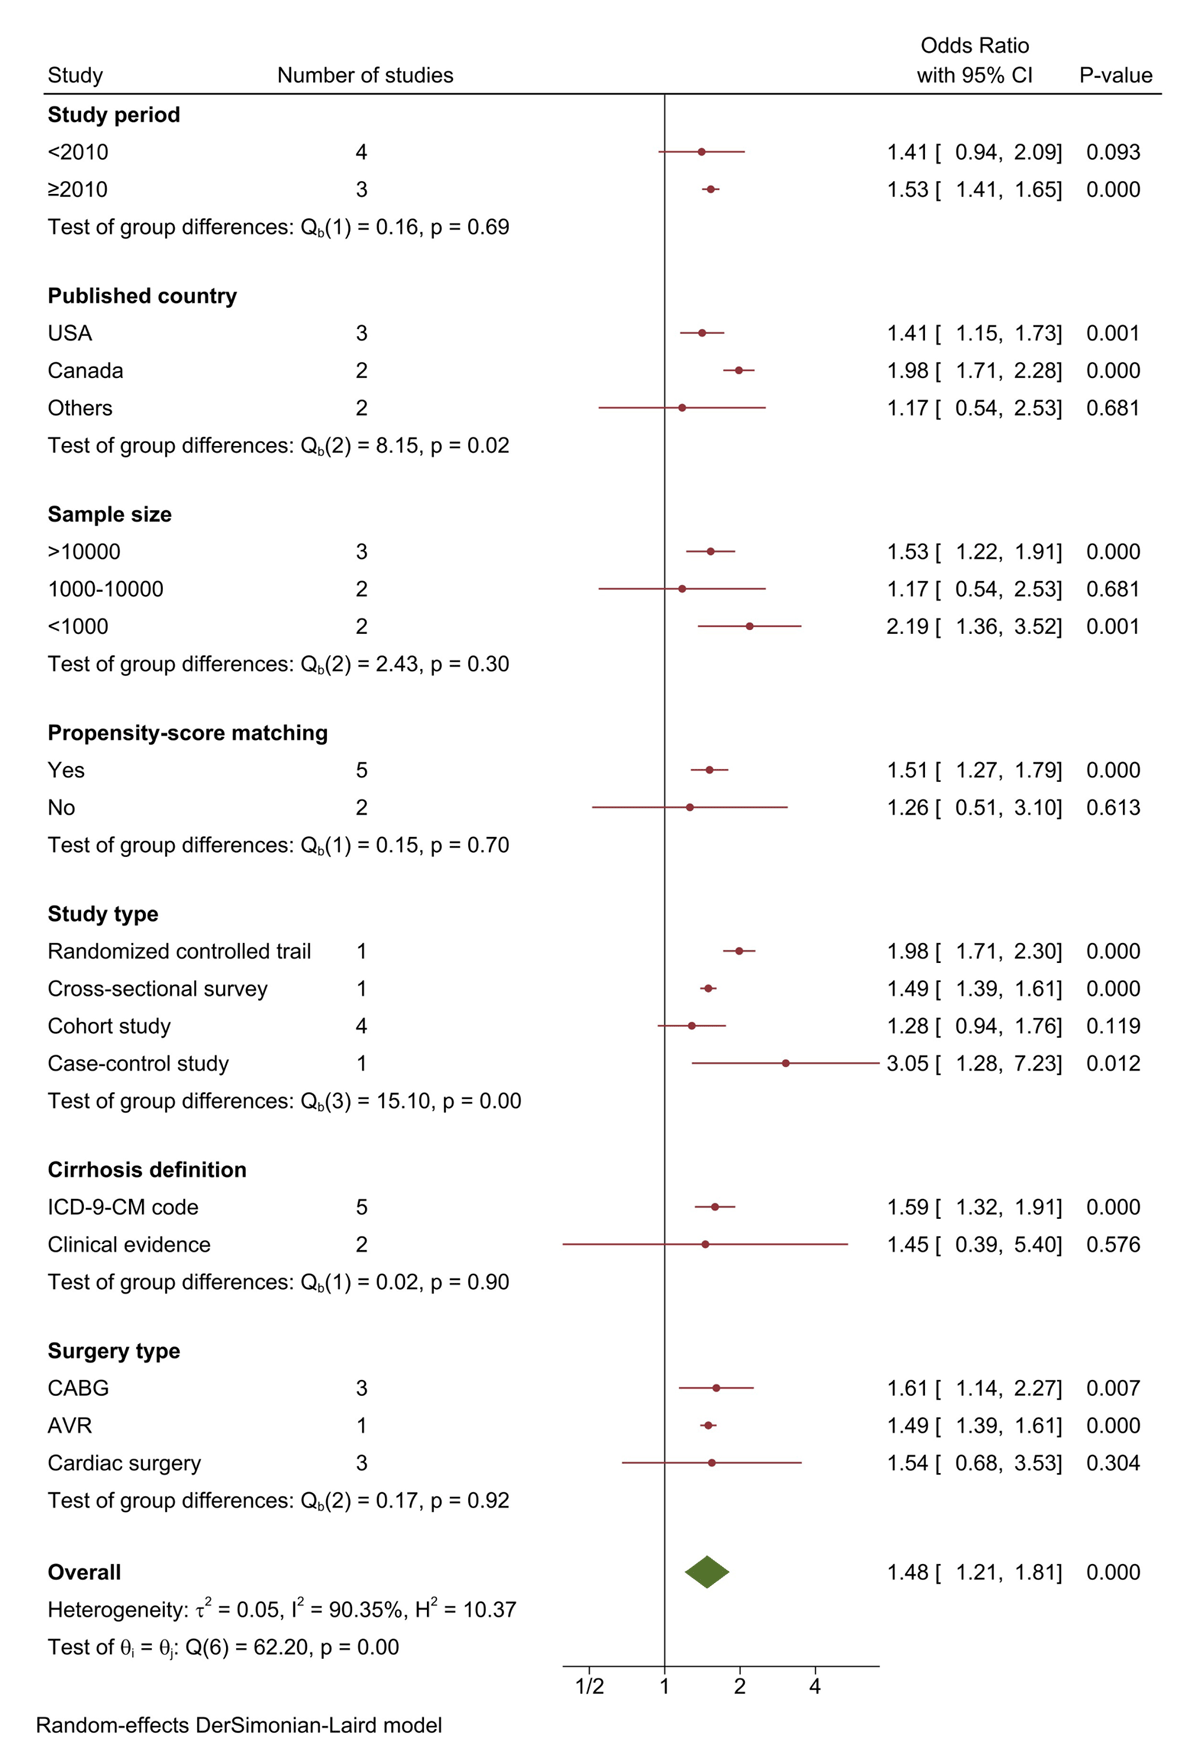
Figure 4
Meta regression analysis of covariates.