
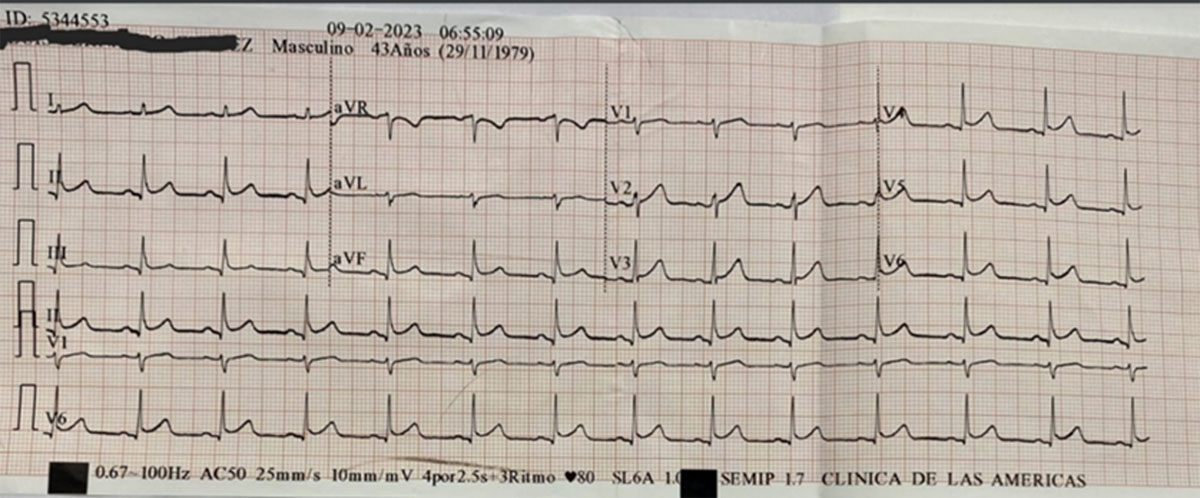
Figure 1
Electrocardiogram with ST segment elevation.
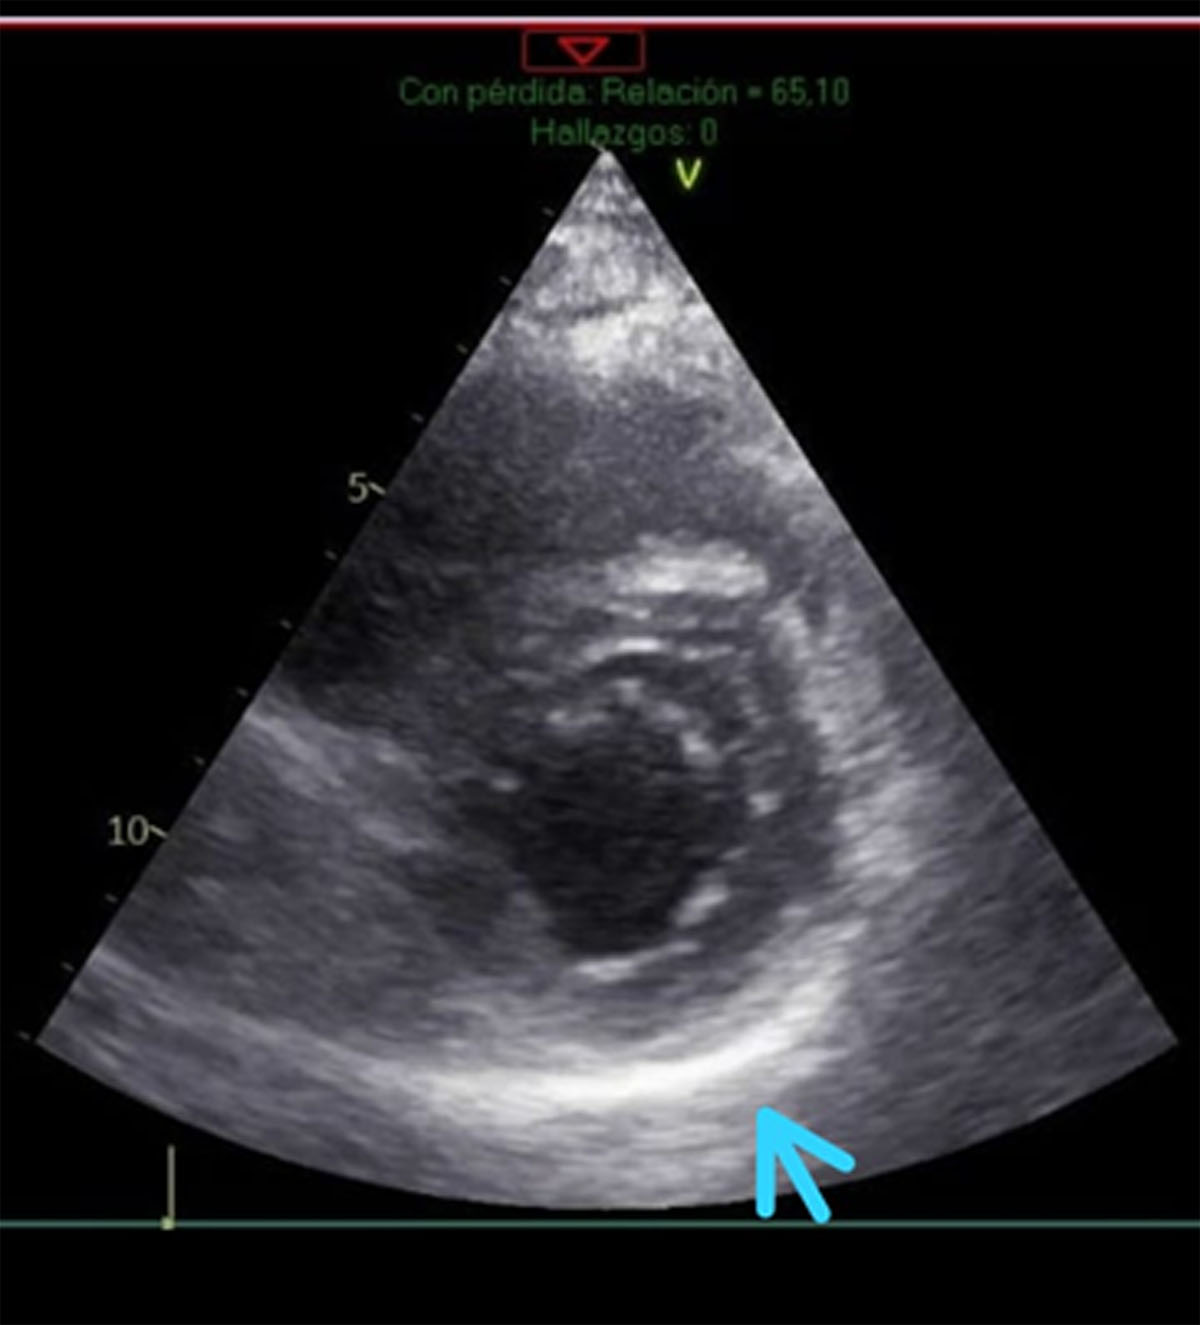
Figure 2
Echocardiogram of the short axis with thickening of the parietal pericardium.
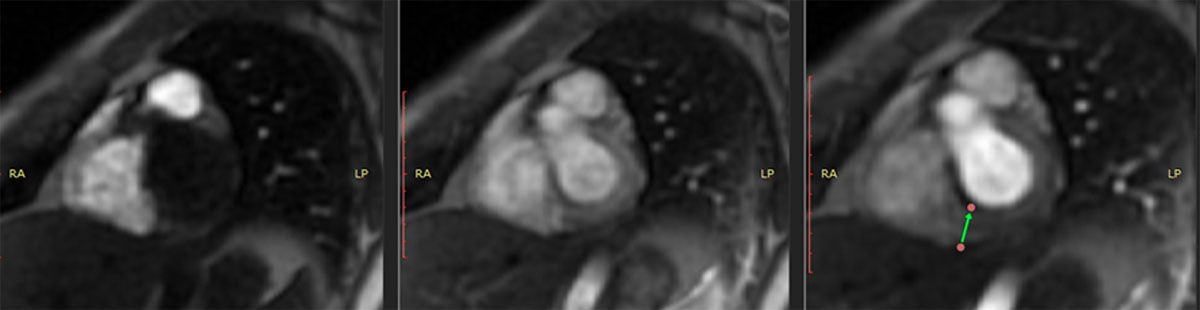
Figure 3
Cardiac MRI showing hyperemia in the basal portion.
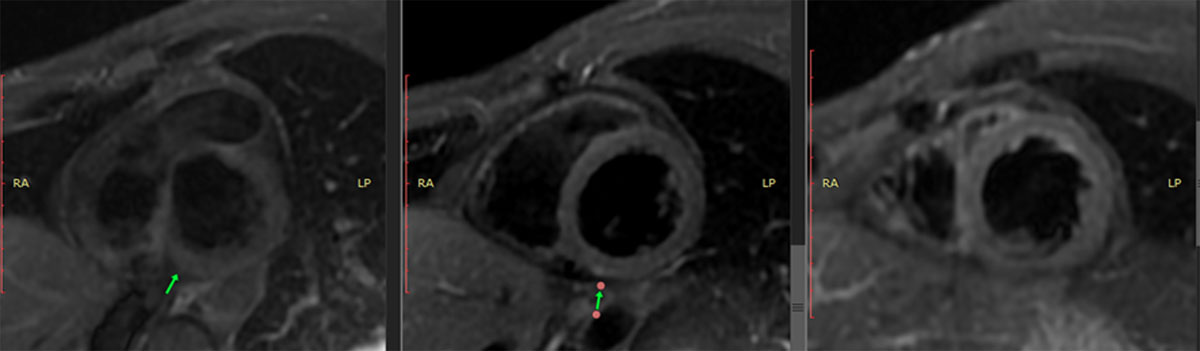
Figure 4
Cardiac MRI with triple IR sequencing showing hyperintense signal, compatible with myocardial edema.
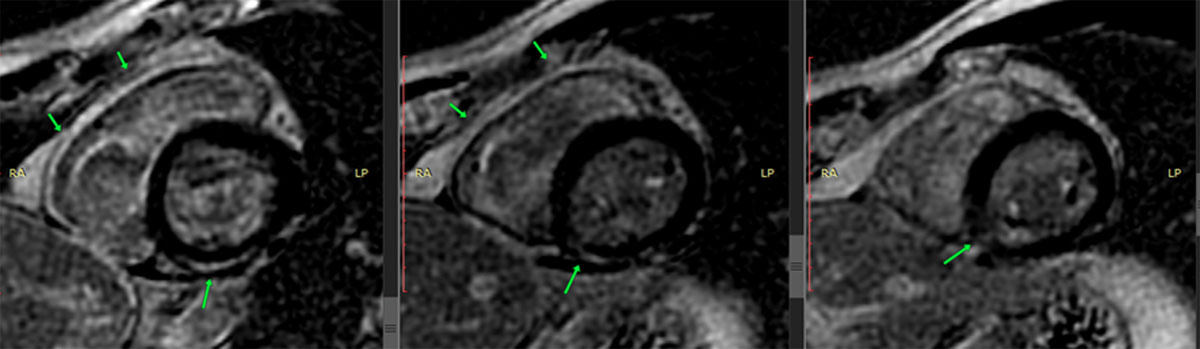
Figure 5
Cardiac MRI with late gadolinium enhancement in the inferoseptal, inferior, and inferomedial segments.
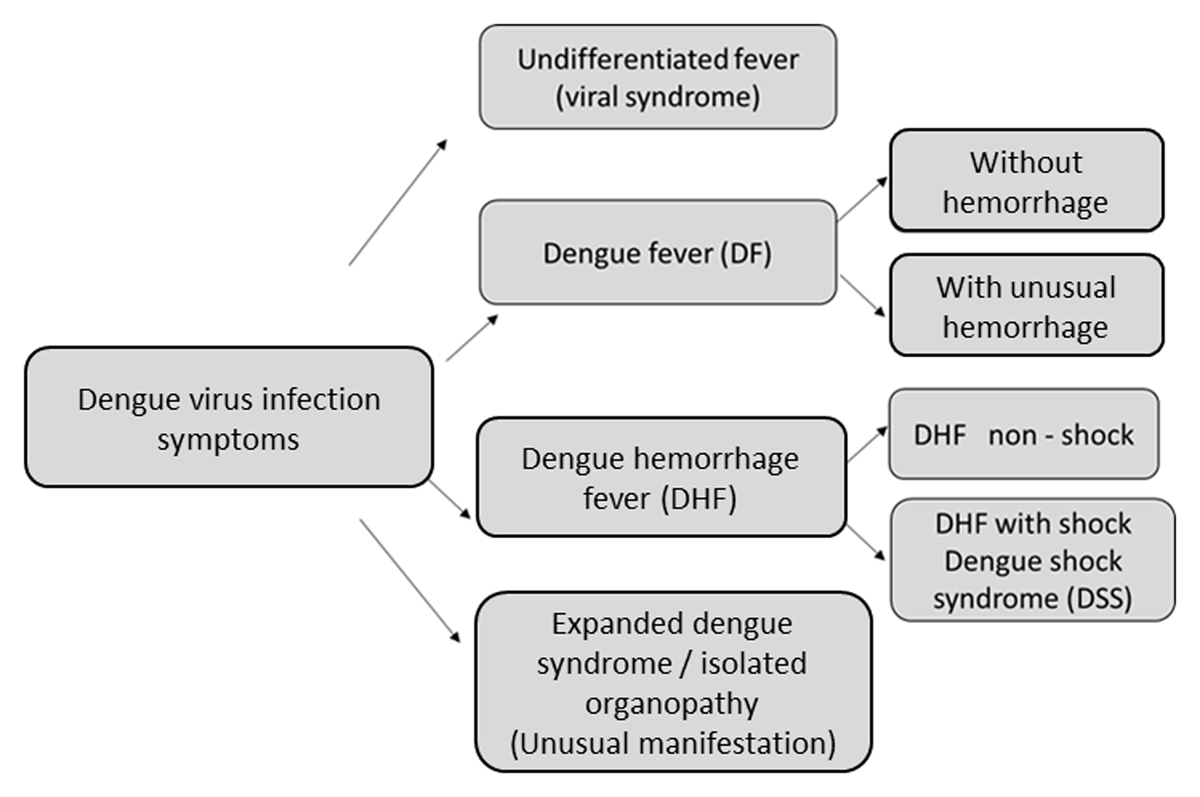
Figure 6
Dengue classification according to World Health Organization (WHO).
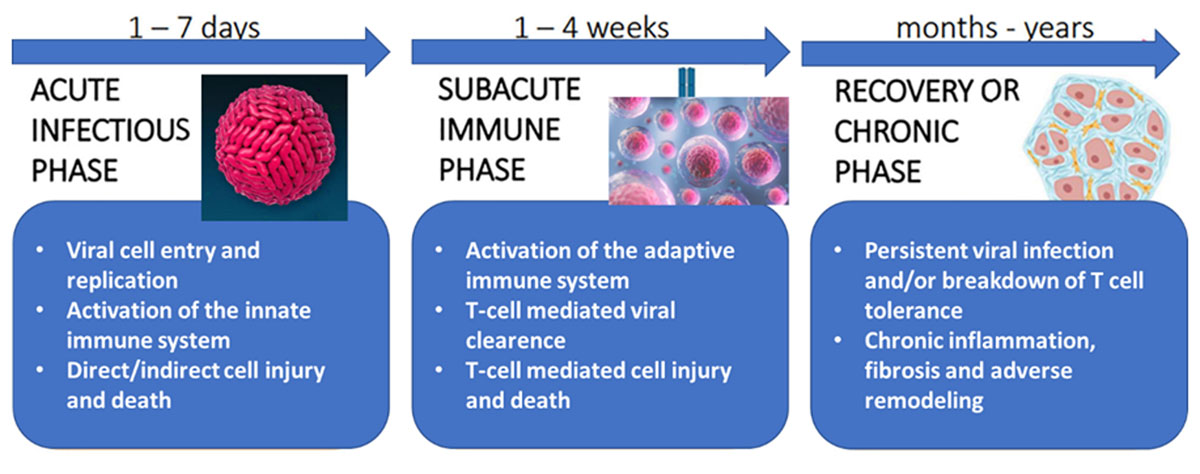
Figure 7
Summary of the cellular and molecular pathology of viral and autoimmune myocarditis.