
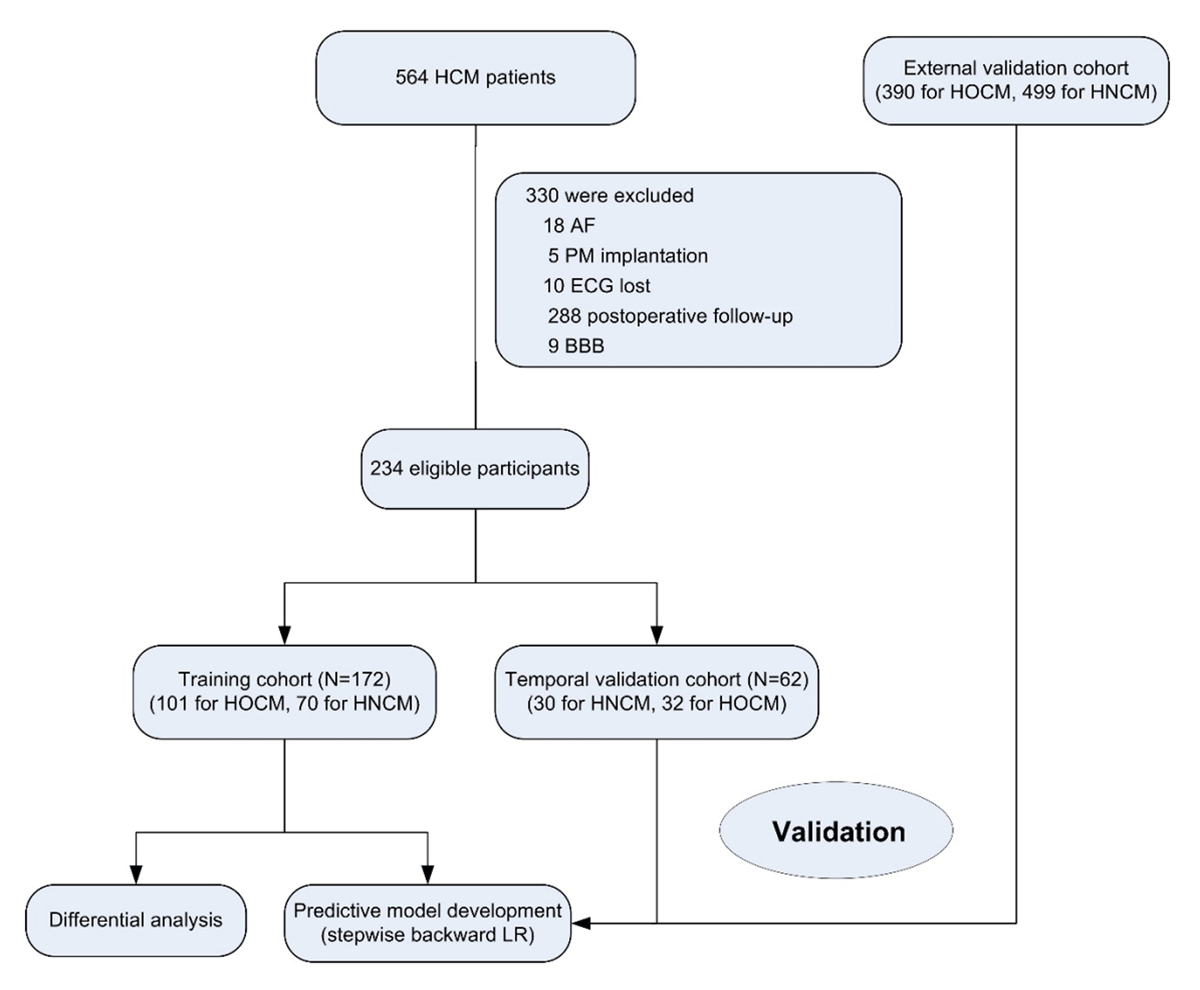
Figure 1
Study flow chart.
AF, atrial fibrillation; PM, pacemaker; BBB, bundle branch block; HCM, hypertrophic cardiomyopathy; HOCM, obstructive hypertrophic cardiomyopathy; HNCM, non-obstructive hypertrophic cardiomyopathy; LR, logistic regression.
Table 1
Baseline characteristics.
| ALL | TRAINING COHORT | TEMPORAL VALIDATION COHORT | |||||||
|---|---|---|---|---|---|---|---|---|---|
| HOCM N = 132 | HNCM N = 102 | P | HOCM N = 102 | HNCM N = 70 | P | HOCM N = 30 | HNCM N = 32 | P | |
| Age, y (mean, SD) | 47 (14) | 46 (15) | 0.635 | 47 (14) | 47 (15) | 0.962 | 48 (15) | 44 (15) | 0.372 |
| Male (n, %) | 97 (73.48) | 66 (64.71) | 0.147 | 74 (72.55) | 46 (65.71) | 0.338 | 23 (76.67) | 20 (62.50) | 0.227 |
| Echocardiography parameters | |||||||||
| MWT, mm | 23 [20, 27] | 20 [17, 23] | <0.001 | 23 [20, 27] | 19 [17, 24] | <0.001 | 24 [20, 27] | 20 [16, 22] | 0.003 |
| RAD, mm | 34 [32, 36] | 35 [32, 37] | 0.092 | 34 [31, 36] | 35 [31, 37] | 0.091 | 35 [33, 36] | 34 [32, 37] | 0.854 |
| LAD, mm | 44 [41, 48] | 40 [37, 45] | <0.001 | 44 [40, 48] | 41 [37, 45] | <0.001 | 45 [42, 48] | 40 [37, 45] | 0.001 |
| EDV, ml | 78 [65, 88] | 77 [67, 90] | 0.532 | 78 [65, 87] | 80 [69, 91] | 0.174 | 80 [71, 91] | 74 [62, 89] | 0.269 |
| ESV, ml | 31 [25, 37] | 32 [27, 39] | 0.186 | 31 [25, 36] | 33 [27, 39] | 0.126 | 32 [26, 38] | 31 [27, 39] | 0.972 |
| LVEF, % | 59 [57, 62] | 58 [56, 61] | 0.090 | 59 [57, 62] | 58 [56, 61] | 0.137 | 59 [57, 62] | 59 [57, 61] | 0.548 |
| E/E’ | 14.48 [11.15, 20.48] | 11.13 [9.31, 13.87] | <0.001 | 15.17 [11.69, 20.90] | 11.56 [9.31, 13.87] | <0.001 | 13.40 [10.92, 16.43] | 10.95 [9.63, 14.05] | 0.046 |
| E/A | 0.81 [0.66, 1.32] | 0.84 [0.73, 1.35] | 0.296 | 0.80 [0.66, 1.28] | 0.85 [0.75, 1.35] | 0.136 | 0.85 [0.66, 1.44] | 0.77 [0.65, 1.35] | 0.667 |
| LVOTGmax, mmHg | 58 [22, 96] | 5 [3, 7] | <0.001 | 64 [22, 99] | 5 [4, 7] | <0.001 | 71 [35, 102] | 6 [4, 10] | <0.001 |
| SAM sign [n, %] | 112 (84.85) | 10 (9.80) | <0.001 | 87 (85.29) | 9 (12.86) | <0.001 | 25 (83.33) | 1 (3.13) | <0.001 |
[i] Data are expressed as n (%), mean (SD), or median [25th and 75th percentiles], otherwise specified.
MWT, maximum wall thickness; RA, right atrium dimension; LA, left atrium dimension; EDV, end-diastolic volume; ESV, end-systolic volume; LVEF, left ventricular ejection fraction; E, early diastolic mitral inflow velocity; A, late diastolic mitral inflow velocity; E’, early diastolic mitral annular tissue velocity; A’, late diastolic mitral annular tissue velocity; E/A, ratio of peak velocities of the early diastolic peak and late peak in mitral inflow; E/E’, ratio of early diastolic peak velocity in mitral inflow to mitral annular; LVOTGmax, the maximum of left ventricular outflow tract gradient; SAM, systolic anterior motion.
Table 2
ECG parameters.
| ALL | TRAINING COHORT | TEMPORAL VALIDATION COHORT | |||||||
|---|---|---|---|---|---|---|---|---|---|
| HOCM N = 132 | HNCM N = 102 | P | HOCM N = 102 | HNCM N = 70 | P | HOCM N = 30 | HNCM N = 32 | P | |
| P, ms | 106 [100, 114] | 100 [92, 107] | <0.001 | 104 [100, 110] | 100 [90, 106] | <0.001 | 112 [104, 122] | 100 [93, 108] | <0.001 |
| QRS, ms | 104 [94, 112] | 100 [92, 111] | 0.408 | 104 [92, 112] | 104 [92, 114] | 0.951 | 104 [96, 107] | 96 [92, 108] | 0.094 |
| PR, ms | 154 [139, 172] | 148 [136, 164] | 0.117 | 151 [136, 172] | 152 [138, 164] | 0.720 | 160 [146, 176] | 146 [133, 163] | 0.009 |
| QTc, ms | 430 [411, 445] | 426 [413, 441] | 0.441 | 428 [410, 442] | 427[414, 441] | 0.965 | 433 [416, 454] | 422 [410, 443] | 0.102 |
| Abnormal Q | 37 (28.03) | 19 (18.63) | 0.095 | 26 (25.49) | 10 (14.29) | 0.088 | 11 (36.67) | 9 (28.13) | 0.589 |
| TWI, % | 80 (60.61) | 61 (59.80) | 0.901 | 62 (60.78) | 41 (58.57) | 0.874 | 18 (60.00) | 20 (62.50) | >0.999 |
| RI, mv | 1.20 [0.80, 1.68] | 0.80 [0.50, 1.23] | <0.001 | 1.29 [0.80, 1.70] | 0.90 [0.50, 1.20] | 0.001 | 1.05 [0.70, 1.40] | 0.80 [0.60, 1.38] | 0.133 |
| RV1, mv | 0.31 [0.10, 0.70] | 0.40 [0.20, 0.80] | 0.535 | 0.31 [0.10, 0.70] | 0.40 [0.20, 0.80] | 0.267 | 0.35 [0.10, 0.70] | 0.55 [0.26, 1.20] | 0.055 |
| RV2, mv | 0.80 [0.30, 1.50] | 1.03 [0.52, 1.90] | 0.047 | 0.80 [0.30, 1.50] | 0.80 [0.50, 1.55] | 0.450 | 0.74 [0.29, 1.76] | 1.35 [0.81, 2.30] | 0.036 |
| RV3, mv | 1.75 [0.90, 2.60] | 1.45 [0.95, 2.50] | 0.523 | 1.65 [0.79, 2.60] | 1.35 [0.80, 2.50] | 0.457 | 2.23 [1.07, 2.70] | 1.95 [1.10, 2.40] | 0.587 |
| RV4, mv | 2.60 [1.74, 3.68] | 2.35 [1.39, 3.50] | 0.154 | 2.60 [1.72, 3.70] | 2.45 [1.38, 3.33] | 0.294 | 2.70 [1.93, 3.50] | 1.95 [1.39, 3.78] | 0.310 |
| RV5, mv | 2.70 [1.70, 3.55] | 2.35 [1.30, 3.36] | 0.072 | 2.61 [1.60, 3.70] | 2.60 [1.30, 3.35] | 0.210 | 2.85 [1.95, 3.21] | 1.71 [1.29, 3.39] | 0.178 |
| RV6, mv | 2.03 [1.40, 2.80] | 1.80 [1.10, 2.70] | 0.070 | 2.00 [1.30, 3.00] | 1.85 [1.08, 2.63] | 0.159 | 2.30 [1.64, 2.80] | 1.68 [1.16, 2.78] | 0.215 |
| RaVL, mv | 0.60 [0.38, 1.12] | 0.50 [0.20, 1.23] | 0.019 | 0.64 [0.40, 1.13] | 0.50 [0.20, 1.00] | 0.032 | 0.45 [0.33, 1.12] | 0.50 [0.23, 0.78] | 0.521 |
| SIII, mv | 0.30 [0.00, 0.79] | 0.30 [0.00, 0.70] | 0.595 | 0.30 [0.00, 0.72] | 0.30 [0.00, 0.70] | 0.685 | 0.41 [0.00, 0.85] | 0.30 [0.00, 0.72] | 0.622 |
| SV1, mv | 2.10 [1.40, 2.76] | 1.30 [0.92, 1.73] | <0.001 | 2.10 [1.40, 2.80] | 1.30 [0.90, 1.80] | <0.001 | 2.00 [1.25, 2.72] | 1.39 [1.03, 1.69] | 0.007 |
| SV2, mv | 2.30 [1.50, 3.17] | 1.90 [1.30, 2.50] | 0.008 | 2.30 [1.50, 3.11] | 1.85 [1.20, 2.50] | 0.029 | 2.35 [1.54, 3.83] | 2.00 [1.40, 2.48] | 0.128 |
| SV3, mv | 1.50 [0.68, 2.38] | 1.50 [0.80, 2.40] | 0.634 | 1.50 [0.70, 2.30] | 1.50 [0.78, 2.40] | 0.576 | 1.73 [0.44, 2.50] | 1.49 [0.93, 2.38] | 0.966 |
| SV4, mv | 0.90 [0.40, 1.78] | 1.03 [0.58, 1.90] | 0.135 | 0.90 [0.38, 1.53] | 1.20 [0.58, 1.90] | 0.084 | 0.85 [0.43, 2.03] | 0.95 [0.53, 1.64] | 0.933 |
| SV5, mv | 0.40 [0.10, 0.90] | 0.68 [0.30, 1.10] | 0.005 | 0.35 [0.00, 0.90] | 0.70 [0.30, 1.13] | 0.004 | 0.42 [0.20, 1.26] | 0.50 [0.30, 1.08] | 0.708 |
| SV6, mv | 0.20 [0.00, 0.40] | 0.30 [0.00, 0.60] | 0.018 | 0.20 [0.00, 0.30] | 0.25 [0.00, 0.60] | 0.030 | 0.27 [0.08, 0.53] | 0.30 [0.15, 0.59] | 0.645 |
| RV5SV1, mv | 4.58 [3.44, 6.16] | 3.50 [2.50, 4.91] | <0.001 | 4.60 [3.20, 6.30] | 3.55 [2.40, 4.95] | 0.001 | 4.58 [3.90, 5.81] | 3.35 [2.50, 4.93] | 0.010 |
| RⅠSⅢ, mv | 1.50 [1.00, 2.28] | 1.25 [0.70, 1.93] | 0.005 | 1.53 [1.00, 2.25] | 1.25 [0.68, 2.00] | 0.014 | 1.40 [1.00, 2.34] | 1.20 [0.80, 1.90] | 0.231 |
| RaVLSV3, mv | 2.30 [1.38, 3.19] | 2.30 [1.30, 2.86] | 0.598 | 2.30 [1.40, 3.06] | 2.30 [1.22, 2.90] | 0.711 | 2.23 [1.13, 3.79] | 2.20 [1.30, 2.80] | 0.688 |
| RV2V3, mv | 2.60 [1.40, 4.22] | 2.55 [1.50, 4.23] | 0.573 | 2.53 [1.40, 4.19] | 2.30 [1.40, 4.07] | 0.821 | 3.00 [1.41, 4.73] | 2.95 [2.23, 5.05] | 0.375 |
| SV2V3, mv | 3.95 [2.21, 5.16] | 3.50 [2.28, 4.80] | 0.186 | 3.85 [2.22, 4.90] | 3.55 [2.25, 4.80] | 0.377 | 4.68 [1.99, 5.63] | 3.48 [2.25, 4.80] | 0.254 |
| RV1V2, mv | 1.25 [0.44, 2.15] | 1.43 [0.90, 2.62] | 0.042 | 1.30 [0.43, 2.12] | 1.30 [0.70, 2.33] | 0.388 | 1.08 [0.43, 2.53] | 2.03 [1.13, 3.51] | 0.029 |
| SV1V2, mv | 4.46 [3.13, 5.70] | 3.20 [2.37, 4.13] | <0.001 | 4.37 [2.98, 5.83] | 3.30 [2.00, 4.45] | <0.001 | 4.48 [3.30, 5.48] | 3.20 [2.41, 3.99] | 0.005 |
| RV3V4, mv | 4.35 [2.62, 6.08] | 3.90 [2.30, 6.00] | 0.292 | 4.15 [2.58, 6.10] | 3.95 [2.18, 5.93] | 0.382 | 5.15 [3.11, 5.93] | 3.85 [2.50, 6.25] | 0.517 |
| SV3SV4, mv | 2.50 [0.99, 4.21] | 2.60 [1.39, 4.30] | 0.358 | 2.45 [1.06, 3.92] | 2.80 [1.30, 4.30] | 0.235 | 2.58 [0.82, 4.81] | 2.40 [1.45, 4.09] | 0.816 |
[i] Data are expressed as n (%) or median [25th and 75th percentiles].
TWI, T wave inversion; RV5SV1, amplitude of the R wave in V5 plus the S wave amplitude in V1; RⅠSⅢ, amplitude of the R wave in lead Ⅰ plus the S wave amplitude in lead Ⅲ; RaVLSV3, amplitude of the R wave in lead aVL plus the S wave amplitude in precordial lead V3; RV2V3, amplitude of the R wave in precordial lead V2 plus V3; SV2V3, amplitude of the S wave in precordial lead V2 plus V3. The rest set as the analogy.
Table 3
Univariable and multivariable logistic regression analyses.
| VARIABLES | UNIVARIABLE ANALYSIS | MULTIVARIABLE ANALYSIS | ||||
|---|---|---|---|---|---|---|
| COEFFICIENT | OR (95% CI) | P | COEFFICIENT | OR (95% CI) | P | |
| RaVL | 0.36 | 1.43 (0.88, 2.31) | 0.150 | |||
| SV1V2 | 0.34 | 1.40 (1.17, 1.68) | <0.001 | |||
| RⅠSⅢ | 0.25 | 1.29 (0.97, 1.71) | 0.081 | |||
| SV6 | –0.48 | 0.62 (0.34, 1.13) | 0.116 | |||
| RⅠ | 0.73 | 2.07 (1.26, 3.41) | <0.001 | |||
| RV5SV1 | 0.31 | 1.37 (1.14, 1.65) | 0.001 | |||
| SV2 | 0.35 | 1.42 (1.06, 1.90) | 0.017 | |||
| SV5 | –0.47 | 0.63 (0.41, 0.96) | 0.032 | |||
| P | 0.07 | 1.07 (1.04, 1.11) | <0.001 | 0.068 | 1.07 (1.04, 1.11) | <0.001 |
| SV1 | 0.91 | 2.49 (1.67, 3.72) | <0.001 | 0.930 | 2.54 (1.65, 3.89) | <0.001 |
| Constant | –8.135 | |||||
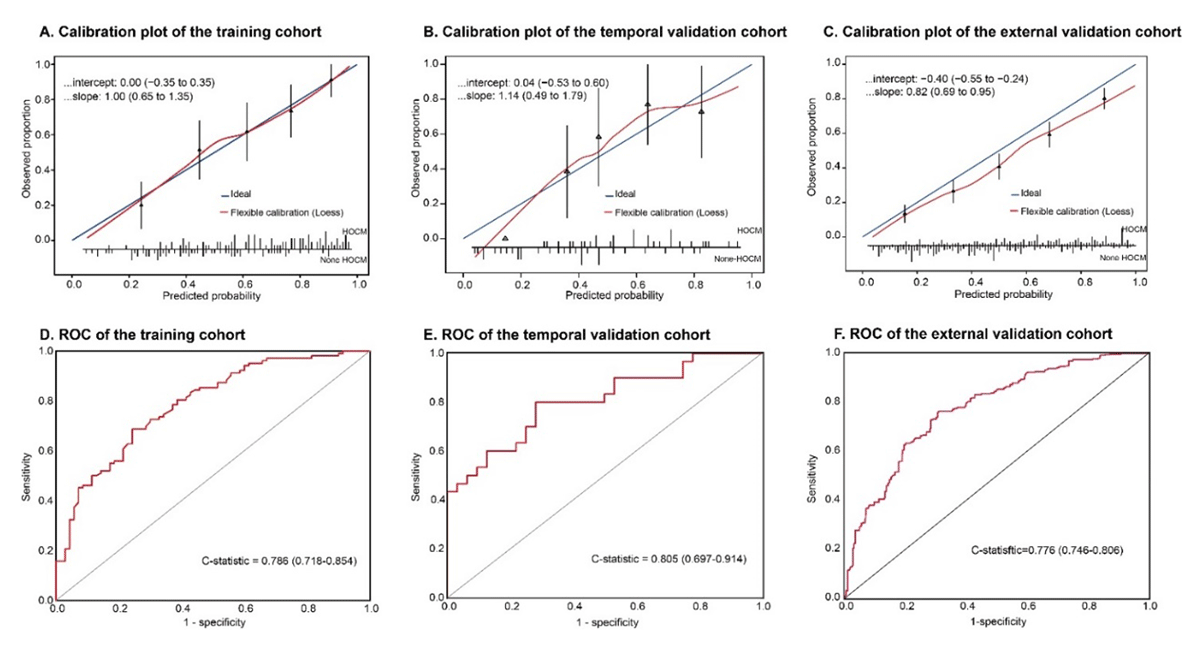
Figure 2
The calibration and ROC curve of the model in the training, temporal, and external validation cohorts.
Calibration plots between the predicted and observed HOCM patients in the training (A), temporal (B), and external validation (C) cohorts. The 45° blue line represents a perfect prediction, and the red line represents the predictive performance of the model. ROC curves of the training (D), temporal (E), and external (F) validation cohorts.
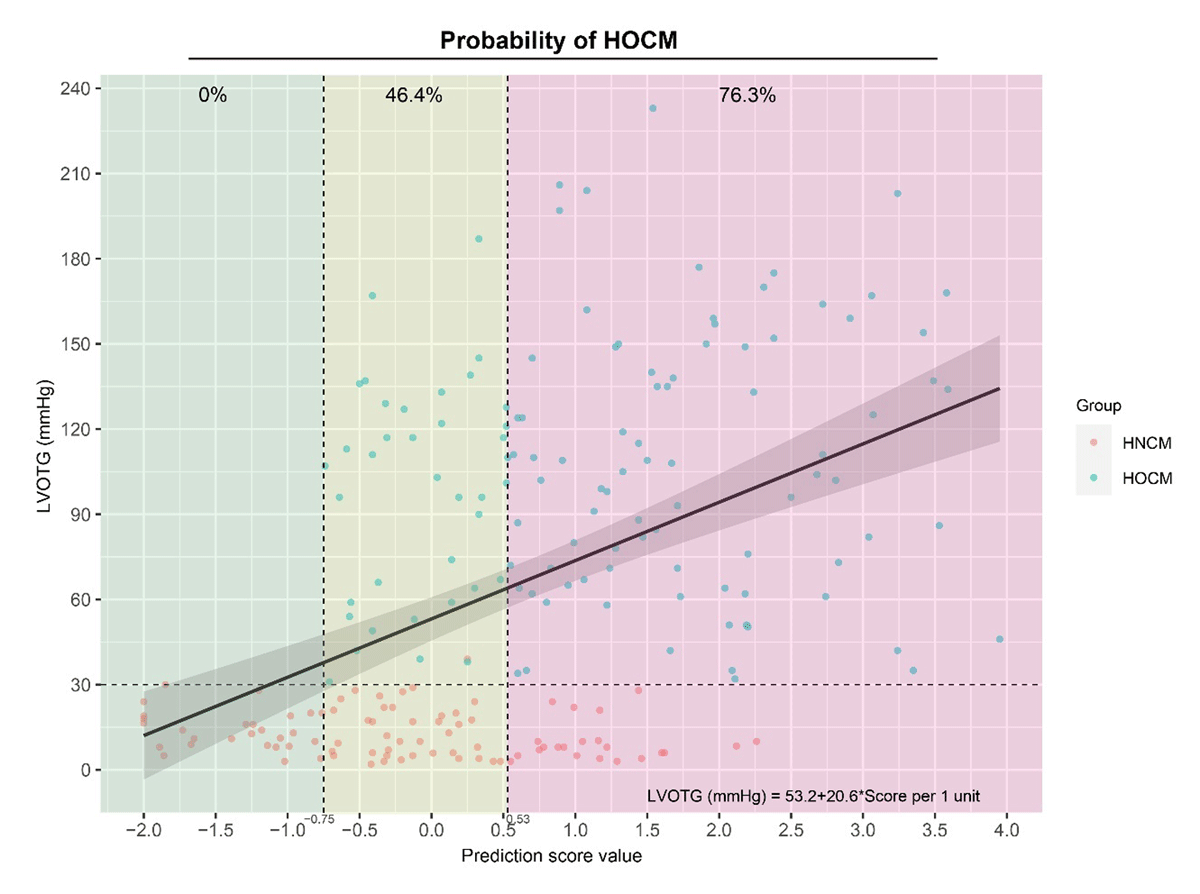
Figure 3
The relationship between LVOTG and the prediction score value.
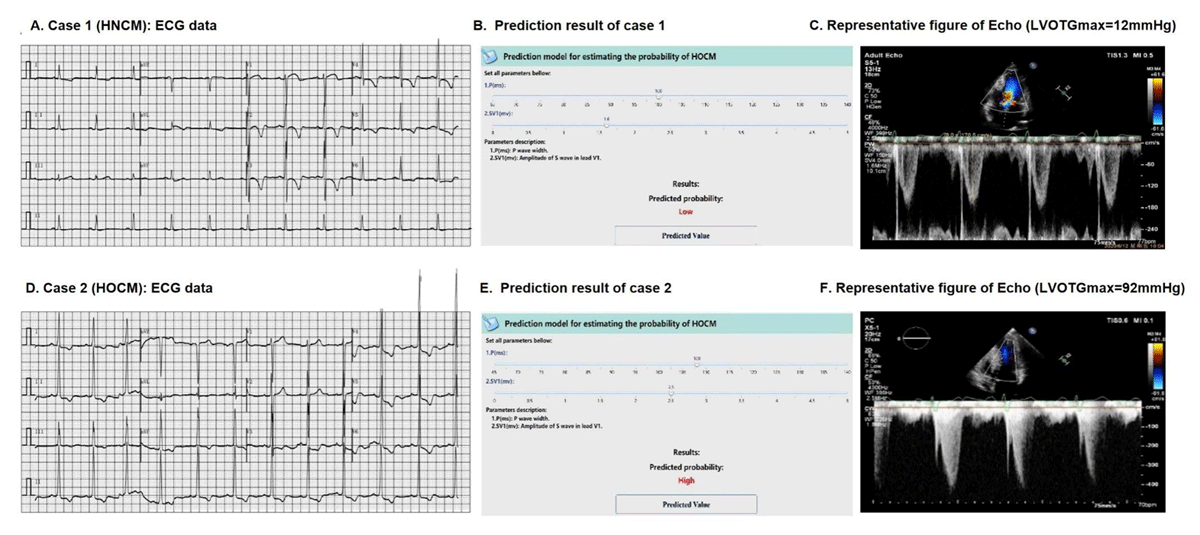
Figure 4
Examples illustration.
A, The ECG of the patient from case 1 (HNCM); B, the prediction result of case 1 with a low HOCM probability; C, Peak LVOTG (12 mmHg) of the patient from case 1; D, The ECG of the patient from case 2 (HOCM); E, the prediction result of case 2 with a high HOCM probability; F, Peak LVOTG (92 mmHg) of the patient from case 2.
| AF | Atrial fibrillation |
| BBB | Bundle branch block |
| CI | Confidence intervals |
| CIC | Clinical impact curve |
| DCA | Decision curve analysis |
| ECG | Electrocardiogram |
| Echo | Echocardiography |
| EDV | End-diastolic volume |
| ESV | End-systolic volume |
| HCM | Hypertrophic cardiomyopathy |
| HNCM | Nonobstructive HCM |
| HOCM | Obstructive HCM |
| LAD | Left atrium dimension |
| LR | Logistic regression |
| LV | Left ventricular |
| LVEF | Left ventricular ejection fraction |
| LVH | Left ventricular hypertrophy |
| LVOTG | Left ventricular outflow tract gradient |
| LVOTO | Left ventricular outflow obstruction |
| MWT | Maximum wall thickness |
| RA | Right atrium |
| ROC | Receiver operator characteristic |
| RV5SV1 | The sum amplitude of R wave in lead V5 And S wave in lead V1 |
| SAM | Systolic anterior motion |
| SRT | Septal reduction therapy |
| SV1 | The amplitude of S Wave in Lead V1 |