
Table 1
Criteria used to define disease state and diagnosis status of the chronic conditions of SLHAS participants for inclusion in modelling.
| CRITERIA BY CONDITION | HAS CONDITION | ALREADY DIAGNOSED |
|---|---|---|
| Hypertension | ||
| a) reported having been diagnosed with hypertension or their medical records showed this | ✓ | ✓ |
| b) reported taking antihypertensives in the past 14 days | ✓ | ✓ |
| c) had a systolic blood pressure of 140 mmHg or more, or a diastolic blood pressure of 90 mmHg or more | ✓ | |
| Diabetes | ||
| a) reported having been diagnosed with diabetes or their medical records showed this | ✓ | ✓ |
| b) reported taking oral hypoglycemics or insulin in the past 14 days | ✓ | ✓ |
| c) had a fasting blood glucose ≥ 126 mg/dL, a random glucose ≥ 200 mg/dL, or an oral glucose tolerance test result ≥ 200 mg/dL | ✓ | |
| Hypercholesterolemia or high CVD risk | ||
| a) reported having been diagnosed with hypercholesterolemia or their medical records showed this | ✓ | ✓ |
| b) reported taking a statin in the past 14 days | ✓ | ✓ |
| c) had a total cholesterol of 300 mg/dL or more | ✓ | |
| d) had a 10-year CVD risk based on the 2019 WHO risk charts (26) of 20% or more | ✓ |
[i] Notes: Only one applicable criteria under each condition needs to be fulfilled for a participant to be categorized as ‘has condition’ and ‘already diagnosed’. Criteria c) and d) are referred to as biomarker data in Calculations.
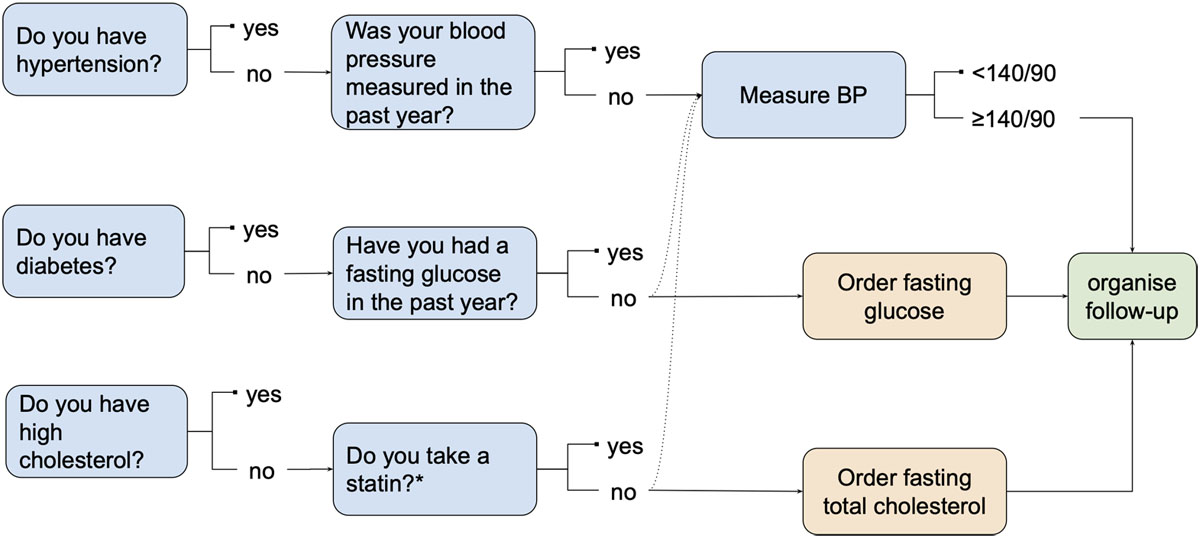
Figure 1
Processes of the screening program for people without preexisting CVD.
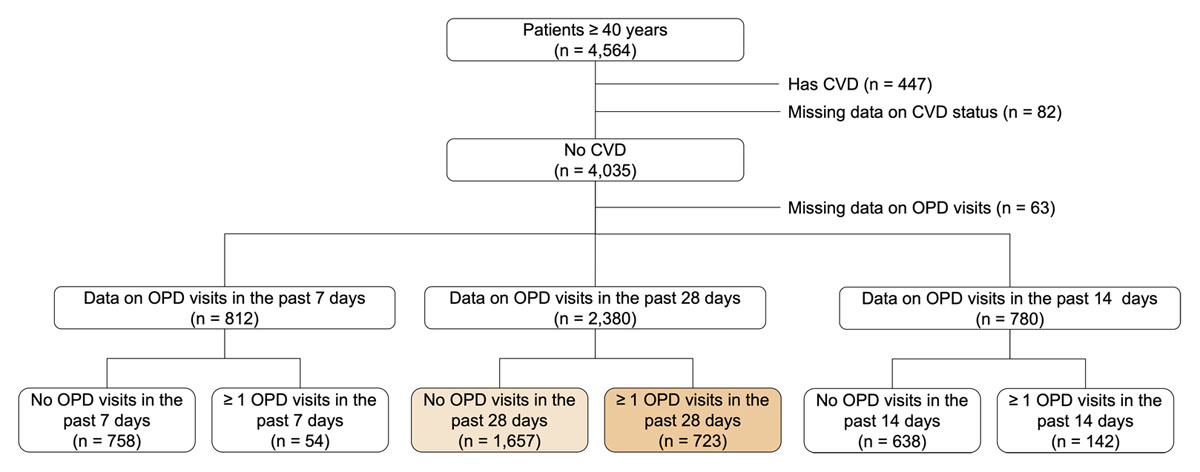
Figure 2
Participant flow.
Table 2
Sample participants ≥40 years with an undiagnosed chronic condition, and percent with outpatient (OP) visits by sector.
| UNDIAGNOSED CONDITION | NUMBER | PERCENT WITH ANY OP VISIT (%) | ||
|---|---|---|---|---|
| PUBLIC | PRIVATE | ANY | ||
| 28-day period | ||||
| Hypertension | 458 | 13.4 | 12.5 | 25.5 |
| Diabetes | 228 | 16.6 | 5.3 | 21.7 |
| Hypercholesterolemia or high CVD risk | 241 | 16.1 | 8.7 | 24.8 |
| Any | 730 | 15.0 | 10.7 | 25.4 |
| 1-year period | ||||
| Hypertension | 749 | 40.2 | 30.5 | 58.5 |
| Diabetes | 368 | 40.1 | 30.6 | 58.5 |
| Hypercholesterolemia or high CVD risk | 398 | 40.6 | 30.2 | 58.6 |
| Any | 1,220 | 40.3 | 30.5 | 58.5 |
[i] Notes: Percentages calculated from weighted sample.
Table 3
Population estimates of people aged ≥40 years without pre-existing CVD, who are assessed, followed-up and newly diagnosed in 28-day and 1-year opportunistic screening programs.
| ELIGIBLE FOR SCREENING WITH ≥1 OP VISIT† NO. (‘000S) (95% CI) | ASSESSED NO. (‘000S) (95% CI) | FOLLOWED-UP NO. (‘000S) (95% CI) | NEWLY DIAGNOSED | COST PER PERSON SCREENED (USD) (95% CI) | COST PER PERSON DIAGNOSED (USD) (95% CI) | TOTAL COST (USD ‘000) (95% CI) | ||
|---|---|---|---|---|---|---|---|---|
| NO. (‘000S)(95% CI) | AS % OF ASSESSED‡ NO. (‘000S) (95% CI) | |||||||
| 28-day program | ||||||||
| Public | 1,400 (1,398, 1,402) | 857 (776, 939) | 396 (350, 441) | 123 (98, 148) | 14.3 (11.0, 17.7) | 1.01 (0.90, 1.13) | 7.05 (6.24, 7.85) | 867 (768, 966) |
| Private | 976 (974, 978) | 555 (483, 627) | 271 (230, 311) | 69 (49, 89) | 12.4 (8.6, 16.2) | 2.64 (2.32, 2.97) | 21.27 (18.67, 23.88) | 1,467 (1,288, 1,647) |
| All | 2,320 (2,317, 2,322) | 1,412 (1,292, 1,532) | 666 (615, 718) | 192 (167, 217) | 13.6 (11.0, 16.2) | 1.65 (1.52, 1.79) | 12.16 (11.16, 13.16) | 2,334 (2,141, 2,527) |
| 1-year program | ||||||||
| Public | 3,084 (3,007, 3,162) | 2,191 (2,13, 2,248) | 1,147 (1,112, 1,182) | 375 (348, 401) | 17.1 (15.9, 18.3) | 1.17 (1.13, 1.20) | 6.82 (6.61, 7.03) | 2,555 (2,476, 2,634) |
| Private | 2,336 (2,276, 2,396) | 1,492 (1,450, 1,535) | 770 (745, 796) | 253 (235, 271) | 17.0 (15.7, 18.2) | 2.87 (2.78, 2.96) | 16.92 (16.37, 17.47) | 4,281 (4,143, 4,419) |
| All | 4,483 (4,371, 4,596) | 3,683 (3,587, 3,778) | 1,918 (1,859, 1,976) | 628 (584, 671) | 17.0 (15.8, 18.2) | 1.86 (1.80, 1.91) | 10.89 (10.56, 11.23) | 6,836 (6,625, 7,047) |
[i] Notes: † People aged 40 years and over without pre-existing CVD are eligible for screening, regardless of chronic condition status. ‡ Percentage of all people with an undiagnosed chronic condition, regardless of whether they reported an OP visit.
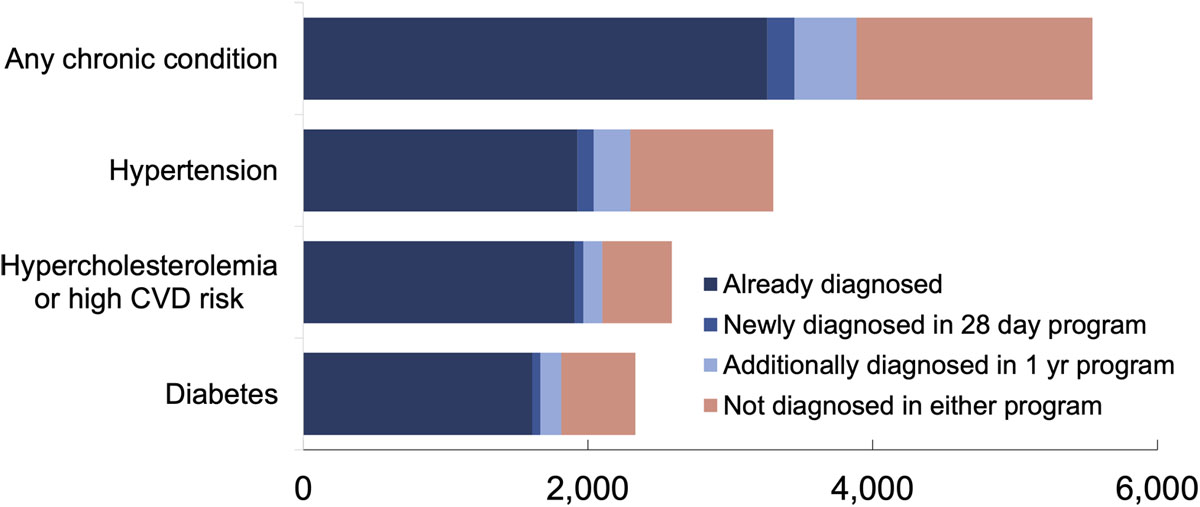
Figure 3
Population estimates of people with chronic conditions that are diagnosed before screening, diagnosed by screening and undiagnosed after screening in 28-day program and one-year program (’000s).
Table 4
Distributions of screening eligible, undiagnosed and newly diagnosed individuals by socioeconomic status with 28-day screening program.
| SES QUINTILE | ELIGIBLE FOR SCREENING† NO. (‘000S)(95% CI) | ELIGIBLE FOR SCREENING WITH ≥1 CHRONIC CONDITION % (95% CI) | UNDIAGNOSED | NEWLY DIAGNOSED | |||
|---|---|---|---|---|---|---|---|
| BEFORE SCREENING% (95% CI) | AFTER SCREENING% (95% CI) | PUBLIC% (95% CI) | PRIVATE% (95% CI) | BOTH% (95% CI) | |||
| 1 (poorest) | 1,536 (1,424, 1,647) | 58.7 (53.2, 64.2) | 32.5 (27.2, 37.8) | 29.2 (24.5, 34.0) | 2.5 (1.4, 3.7) | 0.7 (0.0, 1.4) | 3.3 (2.0, 4.5) |
| 2 | 1,533 (1,423, 1,642) | 58.8 (53.1, 64.4) | 29.1 (23.8, 34.3) | 26.9 (21.9, 32.0) | 1.6 (0.9, 2.3) | 0.5 (0.0, 1.0) | 2.1 (1.3, 3.0) |
| 3 | 1,528 (1,428, 1,628) | 62.9 (57.4, 68.4) | 31.3 (26.1, 36.5) | 29.0 (24.0, 33.9) | 1.6 (0.7, 2.6) | 0.7 (0.2, 1.2) | 2.3 (1.3, 3.4) |
| 4 | 1,531 (1,427, 1,636) | 65.4 (59.9, 70.9) | 29.9 (24.6, 35.2) | 27.1 (22.2, 32.0) | 1.6 (0.8, 2.5) | 1.2 (0.5, 1.9) | 2.8 (1.8, 3.9) |
| 5 (richest) | 1,532 (1,417, 1,647) | 70.1 (64.8, 75.5) | 29.5 (24.1, 34.8) | 27.5 (22.4, 32.5) | 0.6 (0.1, 1.2) | 1.4 (0.6, 2.1) | 2.0 (1.1, 2.9) |
| Total | 7,660 (7,418, 7,902) | 63.2 (60.7, 65.6) | 30.4 (28.1, 32.8) | 27.9 (25.7, 30.1) | 1.6 (1.2, 2.0) | 0.9 (0.6, 1.2) | 2.5 (2.0, 3.0) |
| Concentration index (95% CI) | |||||||
| Eligible with ≥ 1 chronic condition‡ | Not applicable | –0.106 (–0.164, –0.049)p < 0.001 | –0.089 (–0.143, –0.035)p = 0.001 | –0.027 (-0.038, –0.016)p < 0.001 | 0.010 (0.002, 0.018)p = 0.013 | –0.017 (–0.030, –0.004)p = 0.010 | |
| Eligible* | 0.100 (0.055–0.145)p < 0.001 | –0.019 (–0.062, 0.023)p = 0.375 | -0.012 (–0.052, 0.027)p = 0.541 | –0.014 (–0.021, –0.008)p < 0.001 | 0.008 (0.003, 0.013)p = 0.003 | –0.007 (–0.015, 0.002)p = 0.111 | |
[i] Notes: † People aged 40 years and over without pre-existing CVD. ‡ Concentration index calculated on all people aged 40 years and over without preexisting CVD, and with at least one chronic condition. *Concentration index calculated on all people aged 40 years and over without preexisting CVD. SES = socioeconomic status.
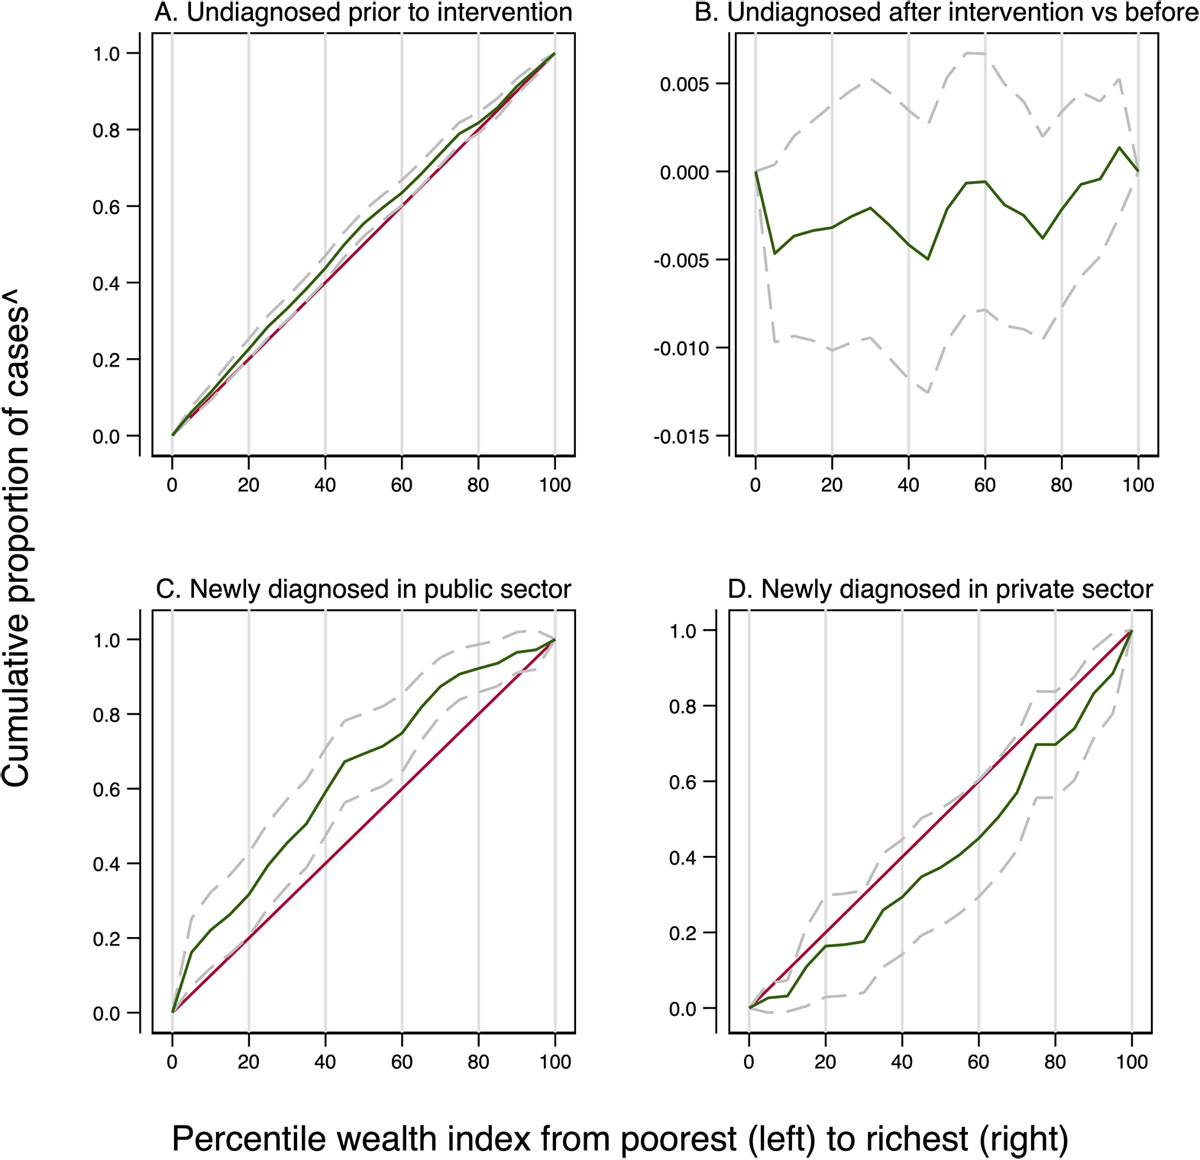
Figure 4
Concentration curves for undiagnosed cases before and after screening and for newly diagnosed cases.
Notes: Concentration curves drawn for people aged 40 years and over without preexisting CVD, with at least one chronic condition. ^ y-axis for Figure B is the difference of the proportion undiagnosed after intervention and proportion undiagnosed before intervention. Grey dashed lines show the 95% confidence intervals of the concentration curves.