
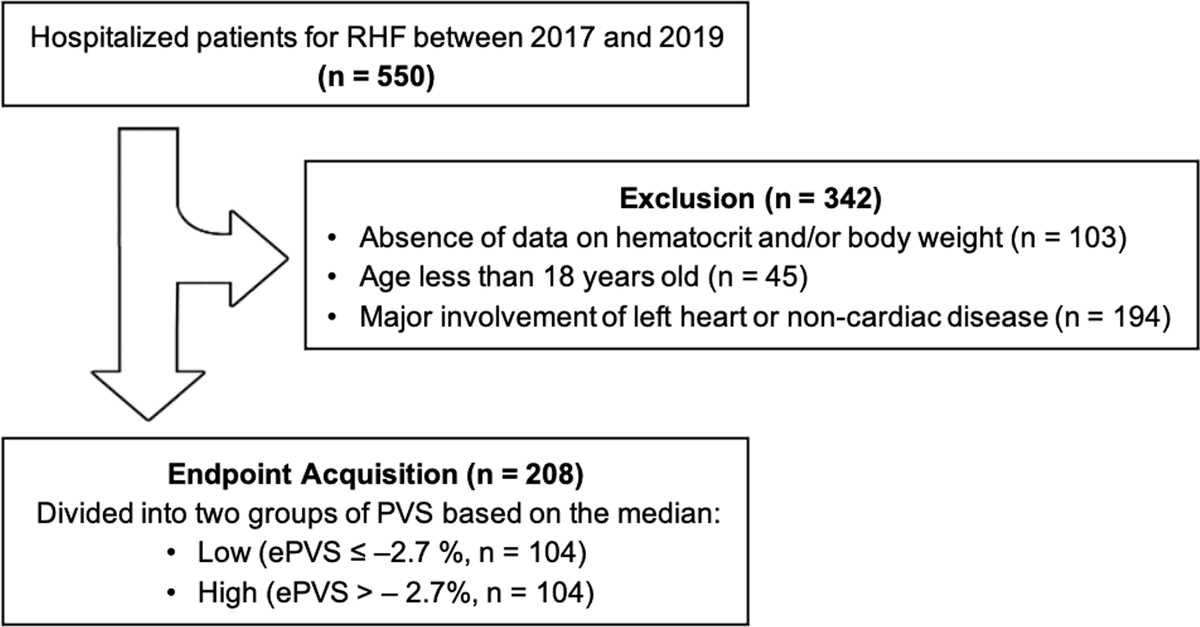
Figure 1
Algorithm Flow of Patient Selection.
Table 1
Baseline Characteristics of Right Heart Failure Patients according to ePVS.
| TOTAL (n = 208) | ESTIMATED PLASMA VOLUME STATUS | P-VALUE | ||
|---|---|---|---|---|
| LOW (n = 104) | HIGH (n = 104) | |||
| Demographic | ||||
| Age (years) | 38 (31–50) | 38 (31–45) | 42 (32–58) | 0.009 |
| Gender (female, %) | 160 (76.9%) | 80 (76.9%) | 80 (76.9%) | 1.00 |
| Weight (kg) | 50 (43–60) | 57 (48–69) | 45 (40–54) | <0.001 |
| Etiology | ||||
| PH | ||||
| WHO Group 1 (yes, %) | 117 (56.3%) | 58 (49.6%) | 59 (50.4%) | 0.89 |
| WHO Group 3 (yes, %) | 28 (13.5%) | 10 (9.6%) | 18 (17.3%) | 0.10 |
| WHO Group 4 (yes, %) | 58 (27.9%) | 33 (31.7%) | 25 (24.0%) | 0.22 |
| Non-PH (yes, %) | 5 (2.40%) | 3 (2.9%) | 2 (1.9%) | 0.65 |
| Vital Signs | ||||
| Systolic BP (mmHg) | 106 (92–122) | 108 (98–122) | 101 (89–119) | 0.025 |
| Diastolic BP (mmHg) | 64 (58–77) | 69 (60–78) | 62 (56–71) | 0.017 |
| Heart rate (beats/min) | 95 (83–108) | 96 (86–107) | 94 (82–109) | 0.68 |
| Clinical History | ||||
| Anemia (yes, %) | 60 (29.0%) | 8 (7.7%) | 52 (50.5%) | <0.001 |
| Atrial fibrillation (yes, %) Renal insufficiency (yes, %) | 56 (26.9%) 62 (30.1%) | 21 (20.2%) 27 (26.2%) | 35 (33.7%) 35 (34.0%) | 0.029 0.22 |
| Clinical Chemistry | ||||
| Hemoglobin (g/dL) | 13.9 ± 2.9 | 15.7 ± 2.5 | 12.1 ± 1.9 | <0.001 |
| Hematocrit (%) | 41.5 (37.1–47.9) | 47.9 (42.5–52.8) | 37.3 (33.5–40.5) | <0.001 |
| Sodium (mmol/L) | 135 (131–137) | 136 (132–137) | 135 (129–138) | 0.53 |
| Potassium (mmol/L) | 3.8 ± 0.7 | 3.9 ± 0.7 | 3.8 ± 0.7 | 0.14 |
| Creatinine (mg/dL) | 1.0 (0.8–1.3) | 1.0 (0.8–1.2) | 0.9 (0.7–1.4) | 0.76 |
| Urea (mg/dL) | 40.5 (25.8–70.0) | 40.3 (25.8–69.2) | 40.5 (26.8–73.0) | 0.70 |
| eGFR (mL/min.1.73 m2) | 81 (51–107) | 82 (59–106) | 81 (45–107) | 0.66 |
| Medication | ||||
| ACE-I/ARB (yes, %) | 144 (69.2%) | 64 (61.5%) | 80 (76.9%) | 0.016 |
| Beta-blocker (yes, %) | 74 (35.6%) | 37 (35.6%) | 37 (35.6%) | 1.00 |
| Spironolactone (yes, %) | 137 (65.9%) | 67 (64.4%) | 70 (67.3%) | 0.66 |
| Furosemide (yes, %) | 190 (91.3%) | 94 (90.4%) | 96 (92.3%) | 0.62 |
| Sildenafil (yes, %) | 132 (63.5%) | 70 (67.3%) | 62 (59.6%) | 0.25 |
| Digoxin (yes, %) | 45 (21.6%) | 20 (19.2%) | 25 (24.0%) | 0.40 |
| Inotrope (yes, %) | 51 (24.5%) | 23 (22.1%) | 28 (26.9%) | 0.74 |
| Vasopressor (yes, %) | 46 (22.1%) | 22 (21.2%) | 23 (23.1%) | 0.42 |
| Clinical Outcomes | ||||
| Length of stay (days) | 7 (4–11) | 8 (5–11) | 7 (4–11) | 0.53 |
| In-hospital mortality (yes, %) | 26 (12.5%) | 7 (6.7%) | 19 (18.3%) | 0.012 |
[i] All p-values were determined using chi-square test for categorical variables and independent t-test or Mann-Whitney U test for continuous variables.
Bold represent significant values (<0.05).
eGFR, estimated glomerular filtration rate; ACE, angiotensin converting enzyme inhibitor; ARB, angiotensin receptor blocker; BP, blood pressure; PH, pulmonary hypertension; WHO, World Health Organization.
Table 2
Association between ePVS and In-Hospital Mortality among Right Heart Failure Patients.
| BIVARIATE | MULTIVARIATE | |||
|---|---|---|---|---|
| OR (95% CI) | p-VALUE | OR (95% CI) | p-VALUE | |
| Estimated Plasma Volume Status | ||||
| High | 3.10 (1.24–7.73) | 0.015 | 5.83 (1.62–20.95) | 0.007 |
| Low | ||||
| Adjusting Factors | ||||
| Age (per 10-year increase) | 1.12 (0.85–1.47) | 0.460 | 0.91 (0.59–1.41) | 0.684 |
| Gender (male) | 1.27 (0.50–3.22) | 0.619 | 1.87 (0.50–6.97) | 0.351 |
| Systolic BP (per 10 mmHg increase) | 0.90 (0.74–1.09) | 0.293 | 1.16 (0.88–1.53) | 0.286 |
| Sodium (per 5 mmol/L increase) | 0.49 (0.33–0.74) | 0.001 | 0.59 (0.35–1.00) | 0.048 |
| eGFR (per 10 mL/min.1.73 m2 increase) | 0.86 (0.77–0.97) | 0.012 | 0.96 (0.84–1.10) | 0.597 |
| ACE-I/ARB (yes) | 0.47 (0.20–1.08) | 0.074 | 0.45 (0.13–1.53) | 0.203 |
| Sildenafil (yes) | 2.69 (0.97–7.45) | 0.058 | 2.87 (0.78–10.54) | 0.112 |
| Furosemide (yes) | 0.25 (0.08–0.70) | 0.009 | 0.15 (0.03–0.65) | 0.012 |
| Inotrope (yes) | 12.38 (4.91–31.21) | <0.001 | 11.63 (3.59–37.98) | <0.001 |
[i] Bold represent significant values (<0.05).
eGFR, estimated glomerular filtration rate; ACE, angiotensin converting enzyme inhibitor; ARB, angiotensin receptor blocker; BP, blood pressure.