
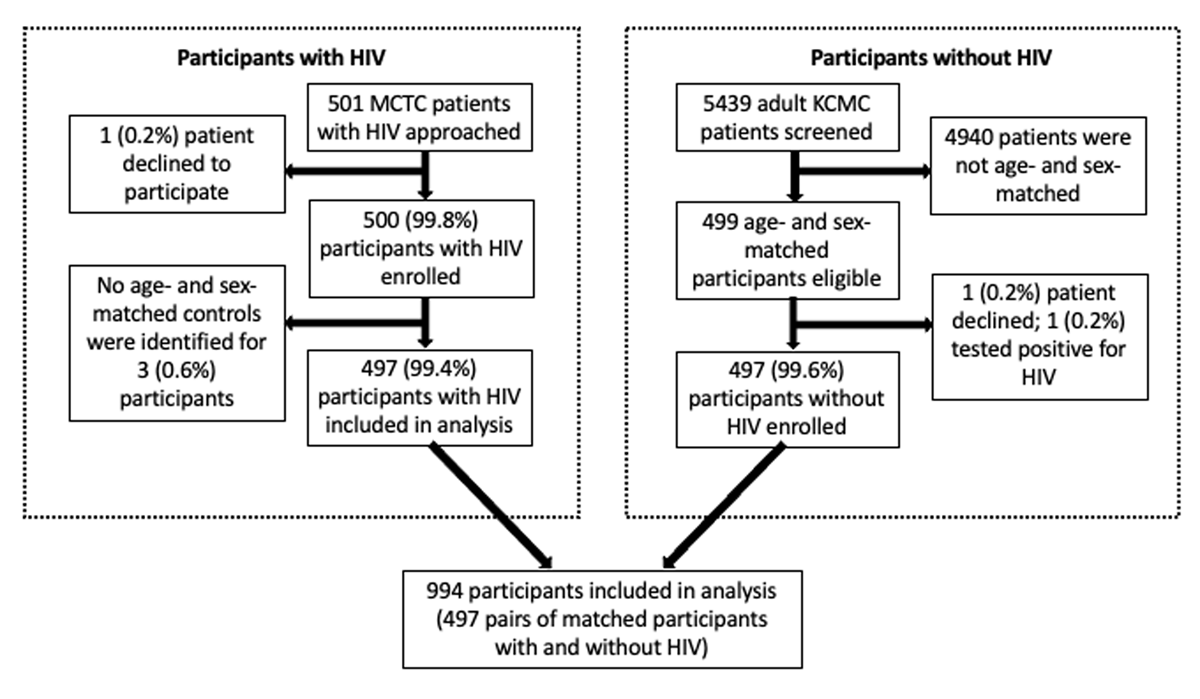
Figure 1
Recruitment of study participants with HIV and without HIV, northern Tanzania, 2020–2021.
Table 1
Characteristics of adults presenting for routine outpatient HIV care and HIV-uninfected controls matched for sex and age, northern Tanzania, 2020-2021 (N = 994).
| HIV-INFECTED PATIENTS (N = 497) | HIV-UNINFECTED CONTROLS (N = 497) | OR (95% CI) | Pa | |||
|---|---|---|---|---|---|---|
| N | (%) | N | (%) | |||
| Male sex | 136 | (27.4) | 136 | (27.4) | 1.00 (0.77–1.32) | 1.000 |
| Age, mean (sd), years | 45.4 (11.3) | 44.9 (12.7) | 0.492 | |||
| Secondary education | 116 | (23.3) | 262 | (52.7) | 0.27 (0.21–0.36) | <0.001* |
| HIV-related parameters | ||||||
| HIV virologic suppression (<200 copies/ml) | 473b | (95.6)b | ||||
| CD4, mean (sd), cells/mm3 | 487 (261.7)c | |||||
| Years since HIV diagnosis, mean (sd) | 5.6 (4.2) | |||||
| Current antiretroviral therapy | ||||||
| TDF/lamivudine/dolutegravir | 468 | (94.2) | ||||
| Other | 28 | (5.6) | ||||
| None | 1 | (0.2) | ||||
| History of protease inhibitor exposure | 13 | (2.6) | ||||
| History of abacavir exposure | 15 | (3.0) | ||||
| Duration of antiretroviral therapy, mean (sd), years | 5.1 (3.7) | |||||
| Comorbidities | ||||||
| Hypertension | 172 | (34.6) | 204 | (41.0) | 0.76 (0.59–0.98) | 0.037* |
| Diabetes | 21 | (4.2) | 52 | (10.5) | 0.38 (0.22–0.63) | <0.001* |
| Self-reported personal history of MI | 0 | (0) | 0 | (0) | ||
| Self-reported family history of MI or stroke | 96 | (19.4) | 80 | (16.1) | 1.25 (0.90–1.73) | 0.185 |
| Obese | 99 | (19.3) | 96 | (19.3) | 1.04 (0.76–1.42) | 0.811 |
| Lifestyle behaviors | ||||||
| Current alcohol use | 242 | (48.7) | 193 | (38.8) | 1.49 (1.16–1.92) | 0.002* |
| Current tobacco use | 49 | (9.9) | 18 | (3.6) | 2.89 (1.69–5.18) | <0.001* |
| Sedentary lifestyle | 161 | (32.4) | 196 | (39.4) | 0.74 (0.57–0.95) | 0.021* |
| Daily fruit and vegetable consumption | 62 | (12.5) | 39 | (7.8) | 1.67 (1.10–2.57) | 0.016* |
[i] HIV: Human immunodeficiency virus.
TDF: Tenofovir disoproxil fumarateMI: Myocardial infarction.
a p values generated from Pearson’s chi-squared for categorical variables and Welch’s t-test for continuous variables.
b Viral load data not available for 2 of 497 participants.
c CD4 data not available for 7 of 497 participants.
* p < 0.05.
Table 2
Electrocardiographic features of adults engaged in HIV care and HIV-uninfected controls, northern Tanzania, 2020–2021 (N = 994).
| HIV-INFECTED PATIENTS (N = 497) | HIV-UNINFECTED CONTROLS (N = 497) | OR (95% CI) | Pa | |||
|---|---|---|---|---|---|---|
| N | (%) | N | (%) | |||
| Rhythm | ||||||
| Sinus | 497 | (100) | 496 | (99.8) | ||
| Other | 0 | (0) | 1 | (0.2) | ||
| Ischemic findings | ||||||
| Prior MI | 55 | (11.1) | 12 | (2.4) | 4.97 (2.71–9.89) | <0.001* |
| Myocardial ischemia | 93 | (18.7) | 60 | (12.1) | 1.67 (1.18–2.39) | 0.004* |
| Either prior MI or myocardial ischemia | 136 | (27.4) | 70 | (14.1) | 2.29 (1.67–3.18) | <0.001* |
| QTc Interval | ||||||
| Automated QTc interval, mean (sd) | 419.9 (23.6) | 417.7 (21.5) | 0.132 | |||
| Prolonged automated QTc interval | 19 | (3.8) | 14 | (2.8) | 1.37 (0.68–2.83) | 0.384 |
[i] * p < 0.05.
a p values generated from Pearson’s chi-squared for categorical variables and Welch’s t-test for continuous variables.
Table 3
Sensitivity analyses comparing the prevalence of ECG findings suggestive of myocardial ischemia and prior myocardial infarction among adults with and without HIV in Tanzania.
| SENSITIVITY ANALYSIS | PARTICIPANTS WITH HIV, N (%) | PARTICIPANTS WITHOUT HIV, N (%) | ODDS RATIO (95% CI) | P |
|---|---|---|---|---|
| Excluding matched participants with discordant education levels | N = 354 | N = 354 | ||
| Myocardial ischemia | 65 (18.5) | 37 (10.5) | 1.92 (1.25, 3.00) | 0.003* |
| Prior MI | 36 (10.3) | 7 (2.0) | 5.51 (2.55, 13.80) | <0.001* |
| Excluding matched participants with discordant hypertension | N = 485 | N = 485 | ||
| Myocardial ischemia | 88 (18.1) | 58 (12.0) | 1.63 (1.14, 2.34) | 0.007* |
| Prior MI | 53 (10.9) | 12 (2.5) | 4.78 (2.60, 9.53) | <0.001* |
| Excluding matched participants with discordant diabetes | N = 467 | N = 467 | ||
| Myocardial ischemia | 89 (19.1) | 56 (12.0) | 1.73 (1.20, 2.49) | 0.003* |
| Prior MI | 51 (10.9) | 11 (2.4) | 5.02 (2.67, 10.3) | <0.001* |
| Excluding matched participants with discordant alcohol use | N = 446 | N = 446 | ||
| Myocardial ischemia | 84 (18.8) | 52 (11.7) | 1.76 (1.21, 2.57) | 0.003* |
| Prior MI | 49 (11.0) | 10 (2.2) | 5.31 (2.76, 11.30) | <0.001* |
| Excluding matched participants with discordant tobacco use | N = 464 | N = 464 | ||
| Myocardial ischemia | 86 (18.5) | 58 (12.5) | 1.59 (1.11, 2.29) | 0.011* |
| Prior MI | 47 (10.1) | 12 (2.6) | 4.20 (2.26, 8.42) | <0.001* |
| Excluding matched participants with discordant sedentary lifestyle | N = 457 | N = 457 | ||
| Myocardial ischemia | 81 (17.7) | 54(11.8) | 1.61 (1.11, 2.34) | 0.012* |
| Prior MI | 52 (11.4) | 12 (2.6) | 4.71 (2.56, 9.40) | <0.001* |
| Excluding matched participants with discordant daily fruit and vegetable consumption | N = 473 | N = 473 | ||
| Myocardial ischemia | 90 (19.0) | 59 (12.5) | 1.65 (1.16, 2.36) | 0.006* |
| Prior MI | 53 (11.2) | 11 (2.3) | 5.23 (2.80, 10.74) | <0.001* |
[i] * p < 0.05.
Table 4
Associations between participant characteristics and ECG evidence of prior myocardial infarction among Tanzanian adults with and without HIV, 2020–2021 (N = 994).
| CATEGORICAL VARIABLES | PARTICIPANTS WITH PRIOR MI (N = 67), N (%) | PARTICIPANTS WITHOUT PRIOR MI (N = 927), N (%) | UNADJUSTED UNIVARIATE OR (95% CI) | UNIVARIATE Pa | ADJUSTED MULTIVARIATE OR (95% CI) | MULTIVARIATE P |
|---|---|---|---|---|---|---|
| Male sex | 28 (41.8) | 244 (26.3) | 2.01 (1.20–3.33) | 0.009* | 1.56 (0.87–2.77) | 0.132 |
| Secondary education | 19 (28.4) | 359 (38.7) | 0.63 (0.36–1.07) | 0.09 | 1.02 (0.54–1.85) | 0.953 |
| HIV-infected | 55 (82.1) | 442 (47.7) | 4.97 (2.71–9.89) | <0.001* | 4.73 (2.51–9.63) | <0.001* |
| Hypertension | 25 (37.3) | 351 (37.9) | 0.98 (0.58–1.63) | 0.936 | ||
| Self-reported family history of MI or stroke | 19 (28.4) | 157 (16.9) | 1.95 (1.09–3.36) | 0.026* | 1.96 (1.08–3.46) | 0.023* |
| Obese | 7 (10.4) | 188 (20.2) | 0.47 (0.19–0.98) | 0.042* | 0.50 (0.20–1.08) | 0.104 |
| Current alcohol use | 30 (44.8) | 405 (43.7) | 1.05 (0.63–1.72) | 0.86 | ||
| Current tobacco use | 11 (16.4) | 56 (6.0) | 3.08 (1.45–6.03) | 0.005* | 1.64 (0.72–3.51) | 0.215 |
| Sedentary lifestyle | 15 (22.4) | 342 (36.9) | 0.50 (0.27–0.88) | 0.015* | 0.61 (0.32–1.10) | 0.112 |
| Daily fruit and vegetable consumption | 4 (6.3) | 97 (10.5) | 0.56 (0.16–1.41) | 0.241 | ||
| Continuous variables | Participants with prior MI (N=), mean (sd) | Participants without prior MI (N=), mean (sd) | p | |||
| Age, years | 46.4 (11.9) | 45.1 (12.0) | 0.372 | 1.01 (0.99–1.03) | 0.469 |
[i] a Univariate p values generated from Pearson’s chi-squared for categorical variables and Welch’s t-test for continuous variables.
Table 5
Associations between participant characteristics and ECG evidence of prior myocardial infarction among Tanzanian adults with HIV, 2020–2021 (N = 497).
| CATEGORICAL VARIABLES | PARTICIPANTS WITH PRIOR MI (N = 55), N (%) | PARTICIPANTS WITHOUT PRIOR MI (N = 442), N (%) | UNADJUSTED UNIVARIATE OR (95% CI) | UNIVARIATE Pa | ADJUSTED MULTIVARIATE OR (95% CI) | MULTIVARIATE P |
|---|---|---|---|---|---|---|
| Male sex | 25 (45.5%) | 111 (25.1%) | 2.48 (1.39–4.41) | 0.002* | 2.08 (1.09–3.92) | 0.025* |
| Secondary education | 13 (23.6%) | 103 (23.3%) | 1.03 (0.51–1.94) | 0.939 | ||
| HIV virologic suppression (<200 copies/ml)b | 50 (94.3%) | 423 (95.7%) | 0.72 (0.23–3.28) | 0.626 | ||
| History of protease inhibitor exposure | 2 (3.6%) | 11 (2.5%) | 1.57 (0.22–6.15) | 0.597 | ||
| History of abacavir exposure | 4 (7.3%) | 11 (2.5%) | 3.13 (0.82–9.70) | 0.090 | 3.03 (0.78–9.73) | 0.077 |
| Hypertension | 22 (40.0%) | 150 (33.9%) | 1.30 (0.72–2.30) | 0.377 | ||
| Self-reported family history of MI or stroke | 16 (29.1%) | 80 (18.1%) | 1.86 (0.97–3.45) | 0.063 | 2.03 (1.04–3.84) | 0.033* |
| Obese | 6 (10.9%) | 93 (21.0%) | 0.47 (0.17–1.06) | 0.069 | 0.54 (0.20–1.26) | 0.186 |
| Current alcohol use | 28 (50.9%) | 214 (48.4%) | 1.10 (0.63–1.95) | 0.730 | ||
| Current tobacco use | 10 (18.2%) | 39 (8.8%) | 2.31 (1.03–4.82) | 0.044* | 1.52 (0.63–3.44) | 0.325 |
| Sedentary lifestyle | 13 (23.6%) | 148 (33.5%) | 0.62 (0.31–1.16) | 0.141 | ||
| Daily fruit and vegetable consumption | 4 (7.3%) | 58 (13.1%) | 0.54 (0.15–1.38) | 0.217 | ||
| Continuous variables | Participants with prior MI (N = 55), mean (sd) | Participants without prior MI (N = 442), mean (sd) | p | |||
| Age, years | 46.3 (12.3) | 45.3 (11.2) | 0.581 | 1.00 (0.98–1.03) | 0.783 | |
| CD4, cells/mm3 c | 445.8 (284.7) | 491.9 (258.7) | 0.264 | |||
| Years since HIV diagnosis | 5.3 (4.2) | 5.7 (4.3) | 0.585 | |||
| Duration of antiretroviral therapy | 4.7 (3.6) | 5.1 (3.7) | 0.454 |
[i] a Univariate p values generated from Pearson’s chi-squared for categorical variables and Welch’s t-test for continuous variables.
b Viral load data not available for 2 of 497 participants.
c CD4 data not available for 7 of 497 participants.