
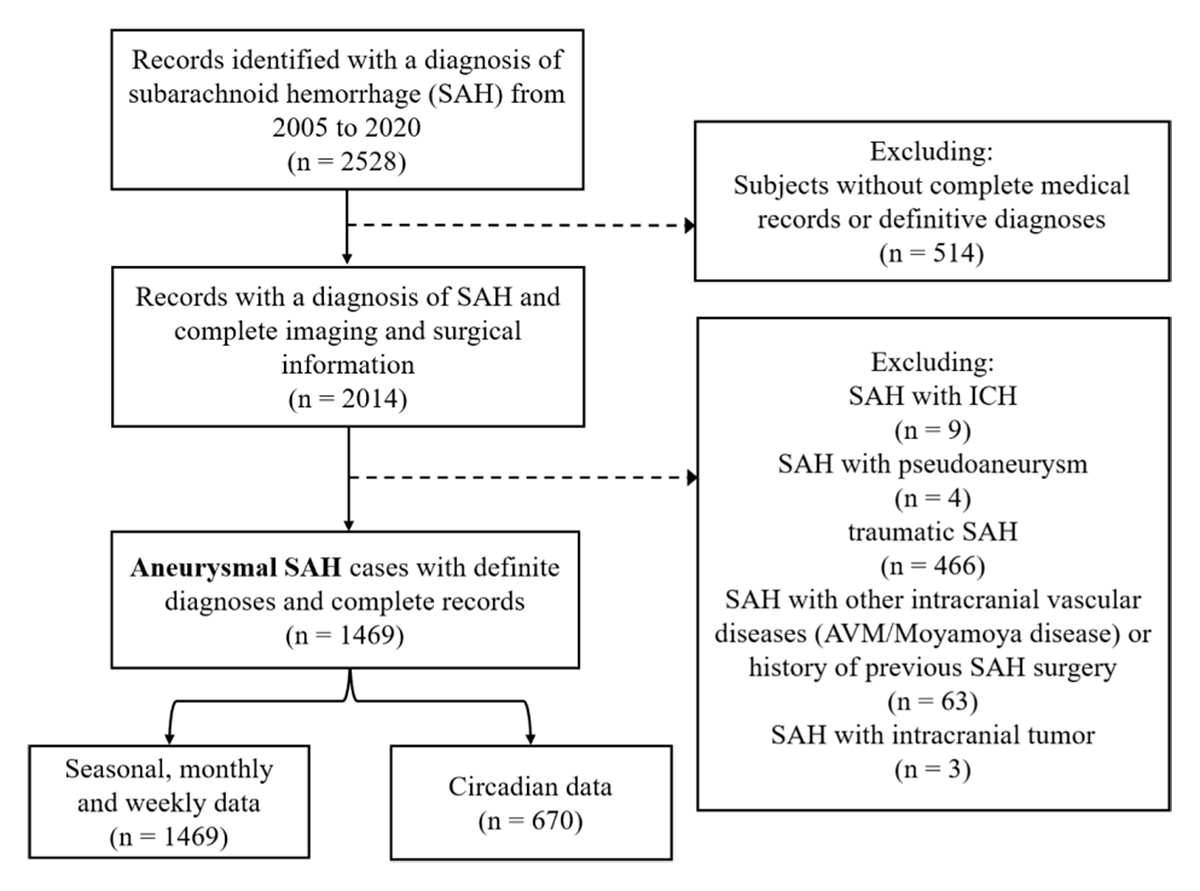
Figure 1
Flowchart of the study population selection. ICH, intracerebral hemorrhage; AVM, arteriovenous malformations.
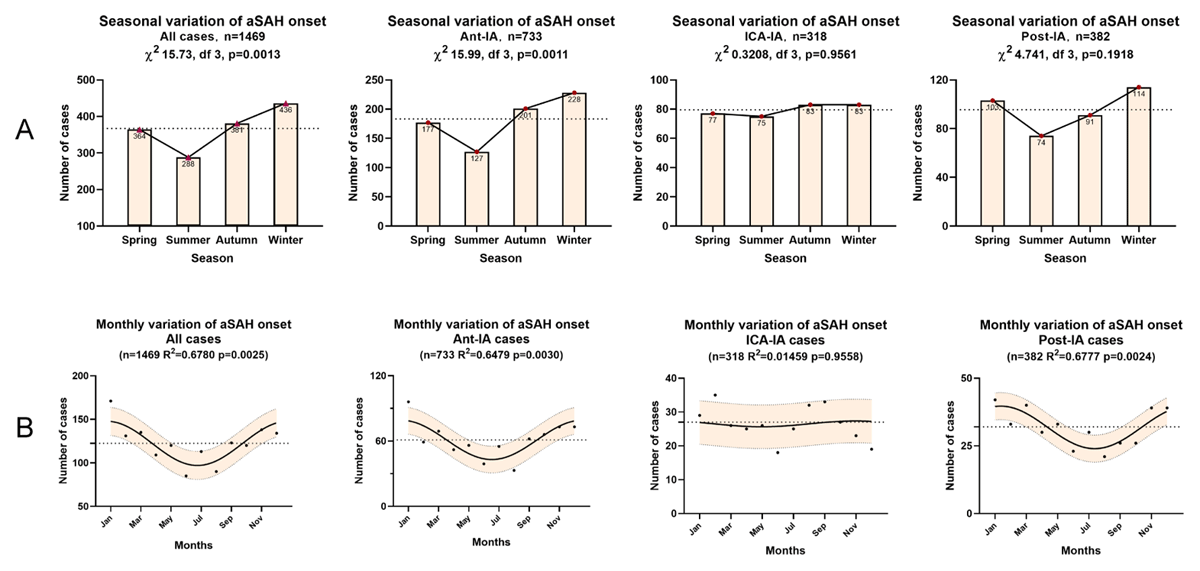
Figure 2
Circannual analyses of aSAH onset. A) Seasonal distributions of aSAH onset, tested by the χ2 goodness-of-fit test. B) Monthly variations of aSAH onset, fitted by the one harmonic Fourier model with a period of 12 months. The solid line is the calculated best-fitting curve. The filled area represents 95% CI. The dotted line represents the midline estimated statistic of rhythm. aSAH, aneurysmal subarachnoid hemorrhage; Ant-IA, aneurysm in anterior circulation arteries after bifurcation of the internal carotid artery; ICA-IA, aneurysm in internal carotid artery and branches except for Ant-IA; Post-IA, aneurysm in posterior circulation artery.
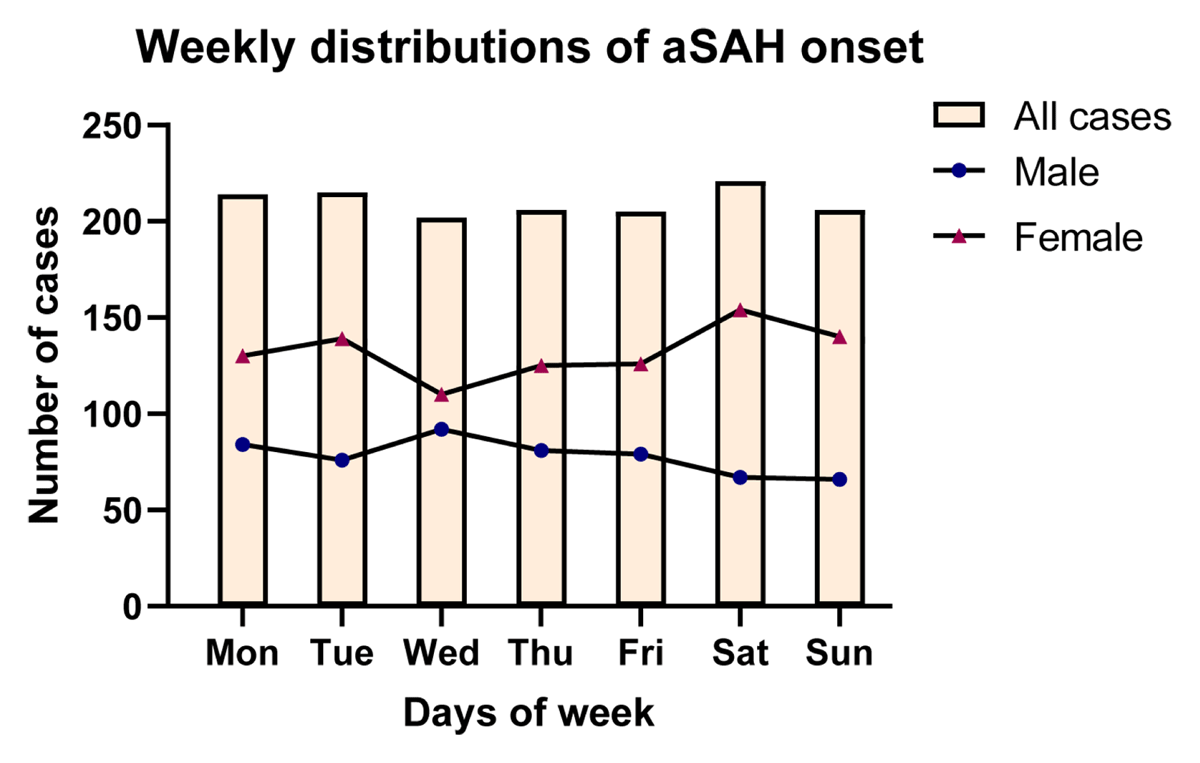
Figure 3
Weekly distributions of aSAH onset of all cases, male cases, and female cases. aSAH, aneurysmal subarachnoid hemorrhage.
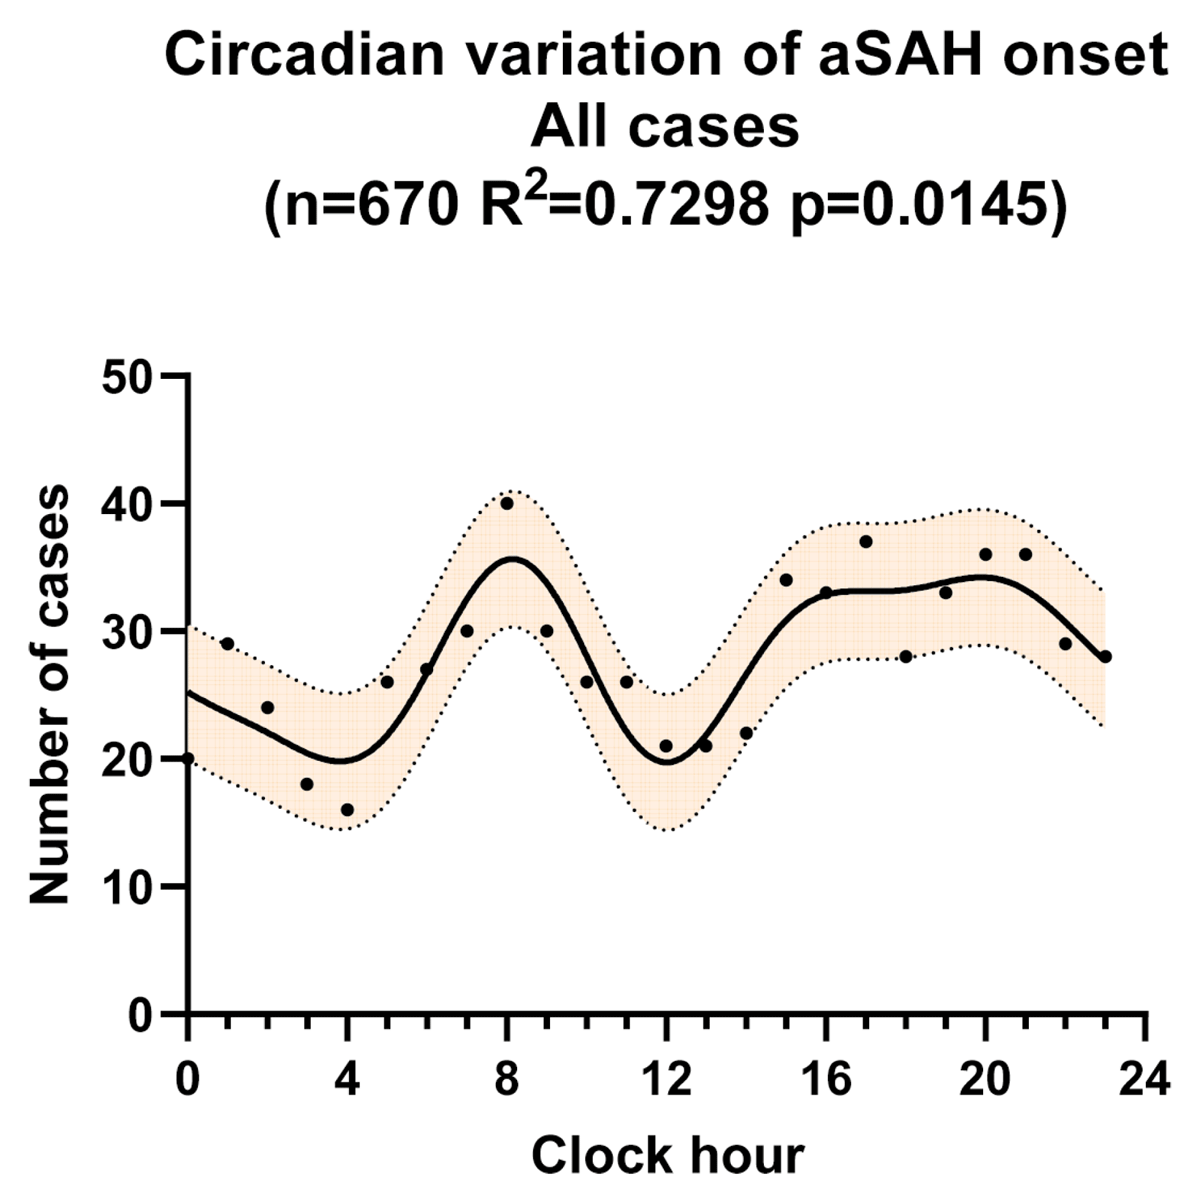
Figure 4
Circadian variation of aSAH onset for all cases, fitted by a four-harmonic Fourier model with periods of 24, 12, 8, and 6 hours. The solid line is the calculated best-fitting curve. The filled area represents 95% CI. aSAH, aneurysmal subarachnoid hemorrhage.
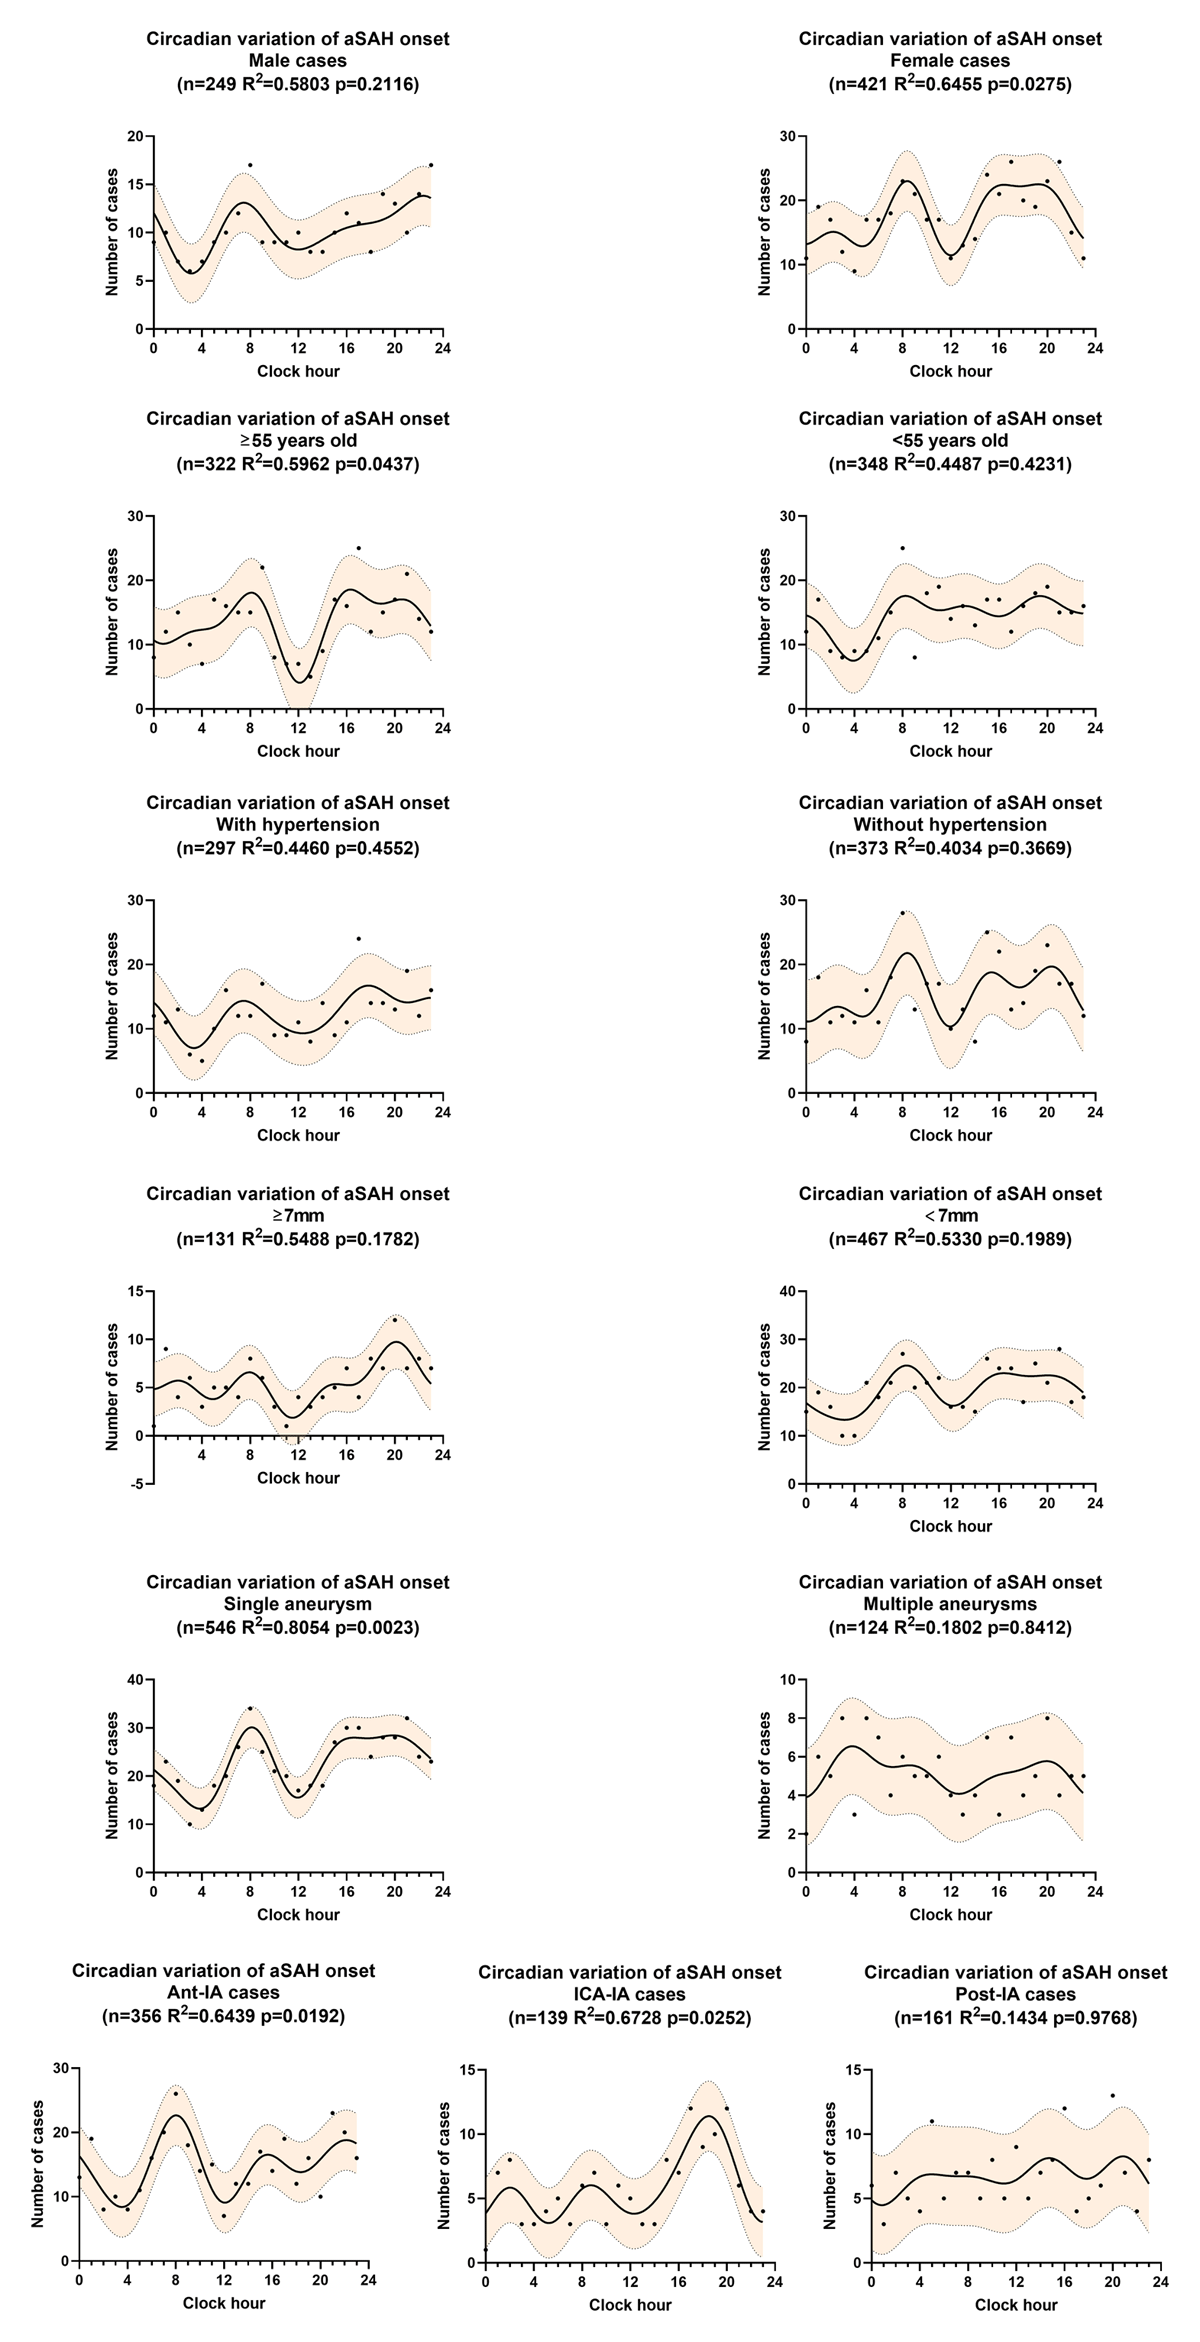
Figure 5
Subgroup analyses for circadian variation of aSAH onset, fitted by a four-harmonic Fourier model with periods of 24, 12, 8, and 6 hours. The solid line is the calculated best-fitting curve. The filled area represents 95% CI. aSAH, aneurysmal subarachnoid hemorrhage. Ant-IA, aneurysm in anterior circulation arteries after bifurcation of the internal carotid artery; ICA-IA, aneurysm in internal carotid artery and branches except for Ant-IA; Post-IA, aneurysm in posterior circulation artery.