
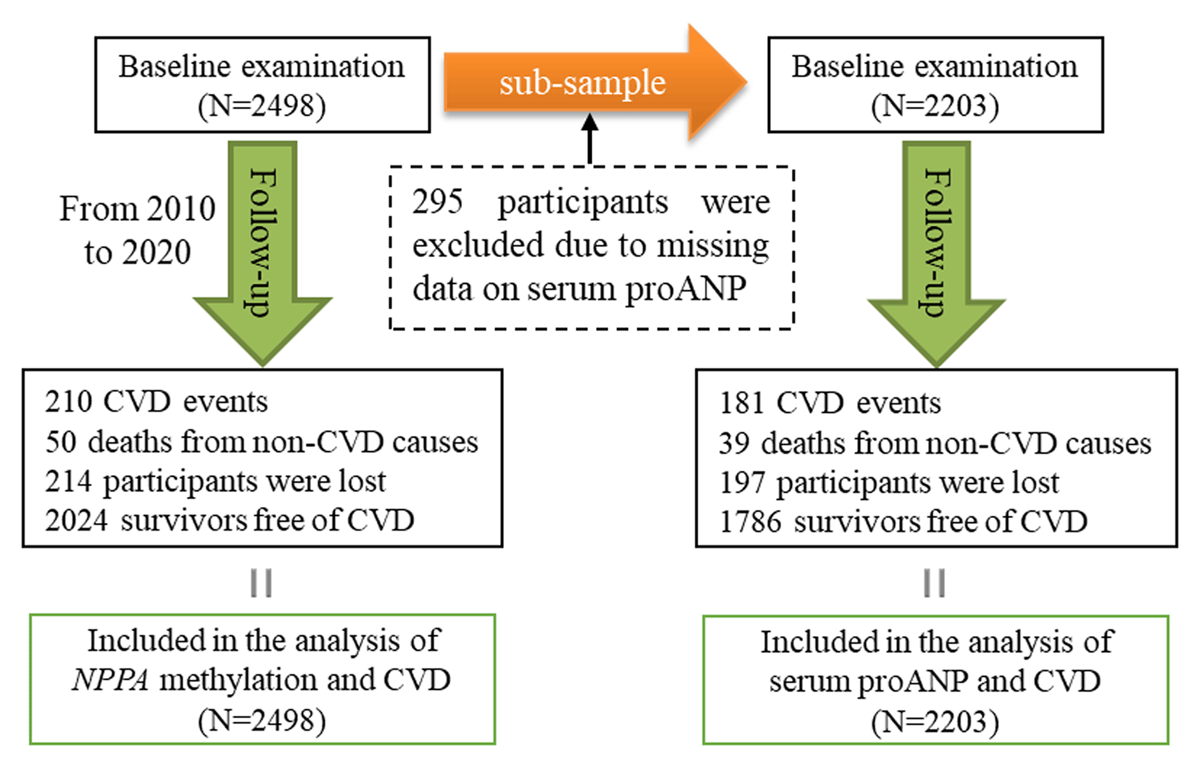
Figure 1
A flowchart illustrating the selection of study participants and statistical plan in the current study. A total of 2498 participants completed the baseline examination in 2010 were followed up for 10 years. During follow-up, 210 participants developed CVD events, 50 participants died from non-cardiovascular causes, and 214 participants were lost. All participants had available data on NPPA promoter methylation at baseline and were included in the analysis of the association between NPPA promoter methylation and CVD. Of them, 295 participants were not included in the analysis of the association between proANP and CVD due to missing data on serum proANP at baseline.
Table 1
Baseline characteristics of study participants in the Gusu cohort study.
| CHARACTERISTICS | MEAN ± SD/n (%) | |||
|---|---|---|---|---|
| TOTAL | WITH proANP | WITHOUT proANP | P* | |
| No. of participants | 2498 | 2203 | 295 | |
| Age, years | 52.7 ± 9.5 | 52.7 ± 9.4 | 53.0 ± 10.7 | 0.566 |
| Sex, male (%) | 962(38.51) | 842(38.22) | 120(40.68) | 0.453 |
| Education, high school or above (%) | 507(20.30) | 468(21.24) | 39(13.22) | 0.002 |
| Current smoking, n(%) | 582(23.30) | 500(22.70) | 82(27.80) | 0.061 |
| Current drinking, n(%) | 465(18.62) | 417(18.93) | 48(16.27) | 0.307 |
| Anti-hypertensive medication, n(%) | 623(24.94) | 554(25.15) | 69(23.39) | 0.560 |
| Body mass index, kg/m2 | 24.78 ± 3.63 | 24.80 ± 3.68 | 24.65 ± 3.26 | 0.464 |
| Fasting glucose, mmol/L | 5.40 ± 1.34 | 5.42 ± 1.36 | 5.25 ± 1.17 | 0.004 |
| Total cholesterol, mmol/L | 5.22 ± 1.75 | 5.21 ± 1.57 | 5.22 ± 2.75 | 0.118 |
| Triglycerides, mmol/L | 1.46 ± 1.59 | 1.48 ± 1.63 | 1.35 ± 1.21 | 0.057 |
| LDL cholesterol, mmol/L | 3.00 ± 0.76 | 2.99 ± 0.75 | 3.04 ± 0.86 | 0.393 |
| HDL cholesterol, mmol/L | 1.51 ± 0.44 | 1.51 ± 0.45 | 1.49 ± 0.41 | 0.370 |
| proANP, nmol/L | – | 1.20 ± 0.80 | – | – |
[i] All results are expressed with mean ± SD unless otherwise noted.
LDL: low-density lipoprotein; HDL: high-density lipoprotein; ANP: atrial natriuretic peptide.
* Comparison between participants with and without proANP at baseline.
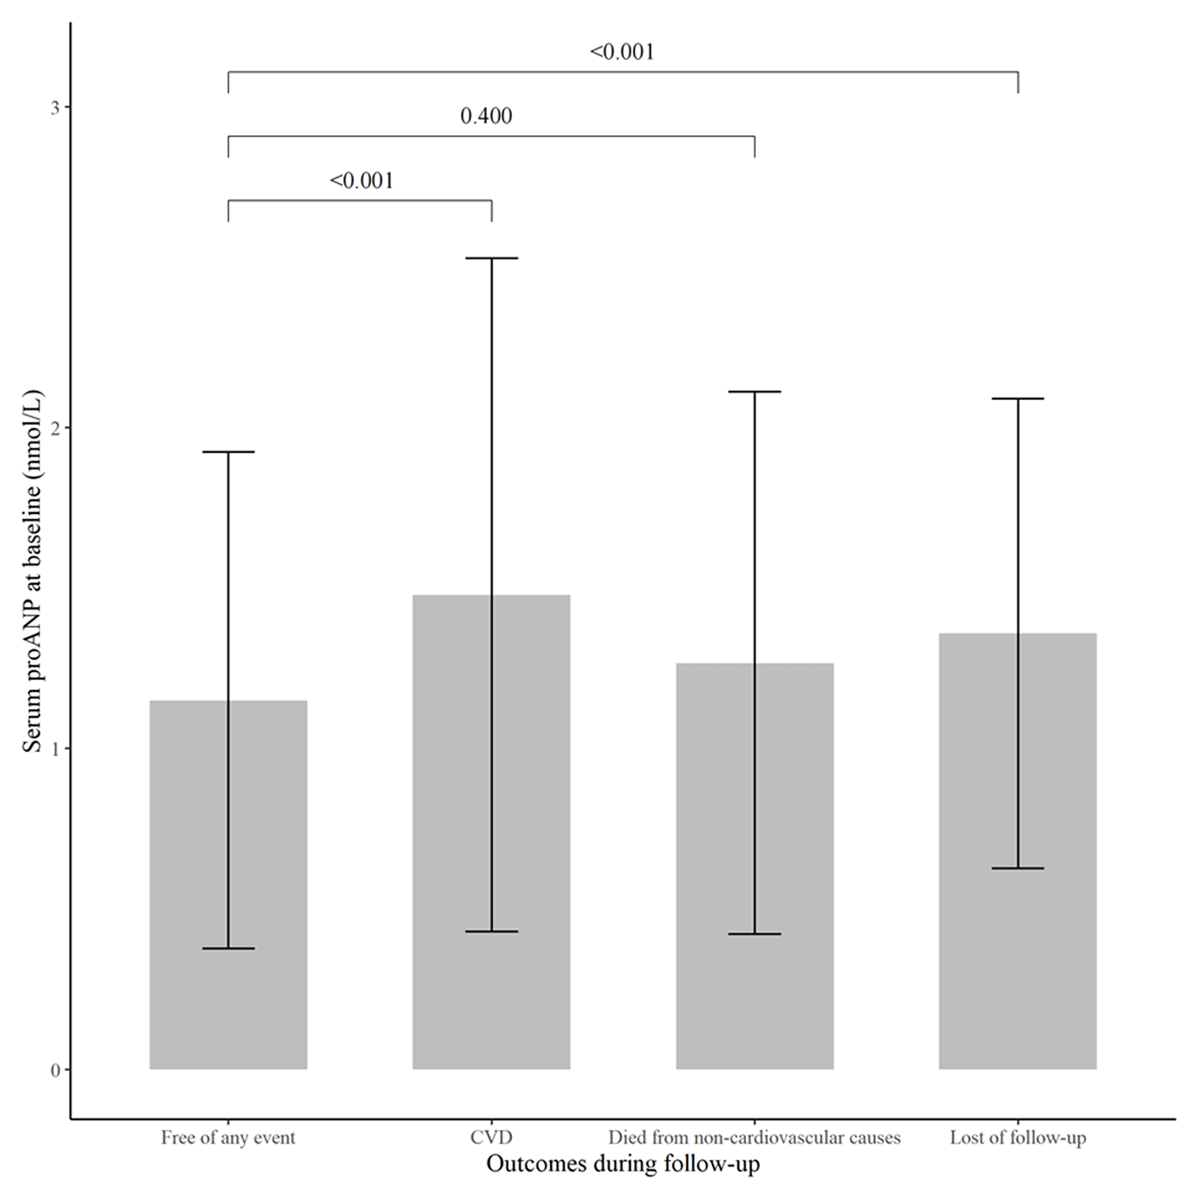
Figure 2
Serum proANP levels for participants with different outcomes during follow-up. Compared to participants who remained free of CVD (mean ± SD: 1.15 ± 0.77 nmol/L), those who died from non-cardiovascular causes (mean ± SD: 1.27 ± 0.84 nmol/L, P = 0.400) had a similar level of serum proANP, whereas those who developed CVD (mean ± SD: 1.48 ± 1.05 nmol/L, P < 0.001) or were lost during follow-up (mean ± SD: 1.36 ± 0.73 nmol/L, P < 0.001) had a significantly increased level of serum proANP at baseline. CVD: cardiovascular disease.
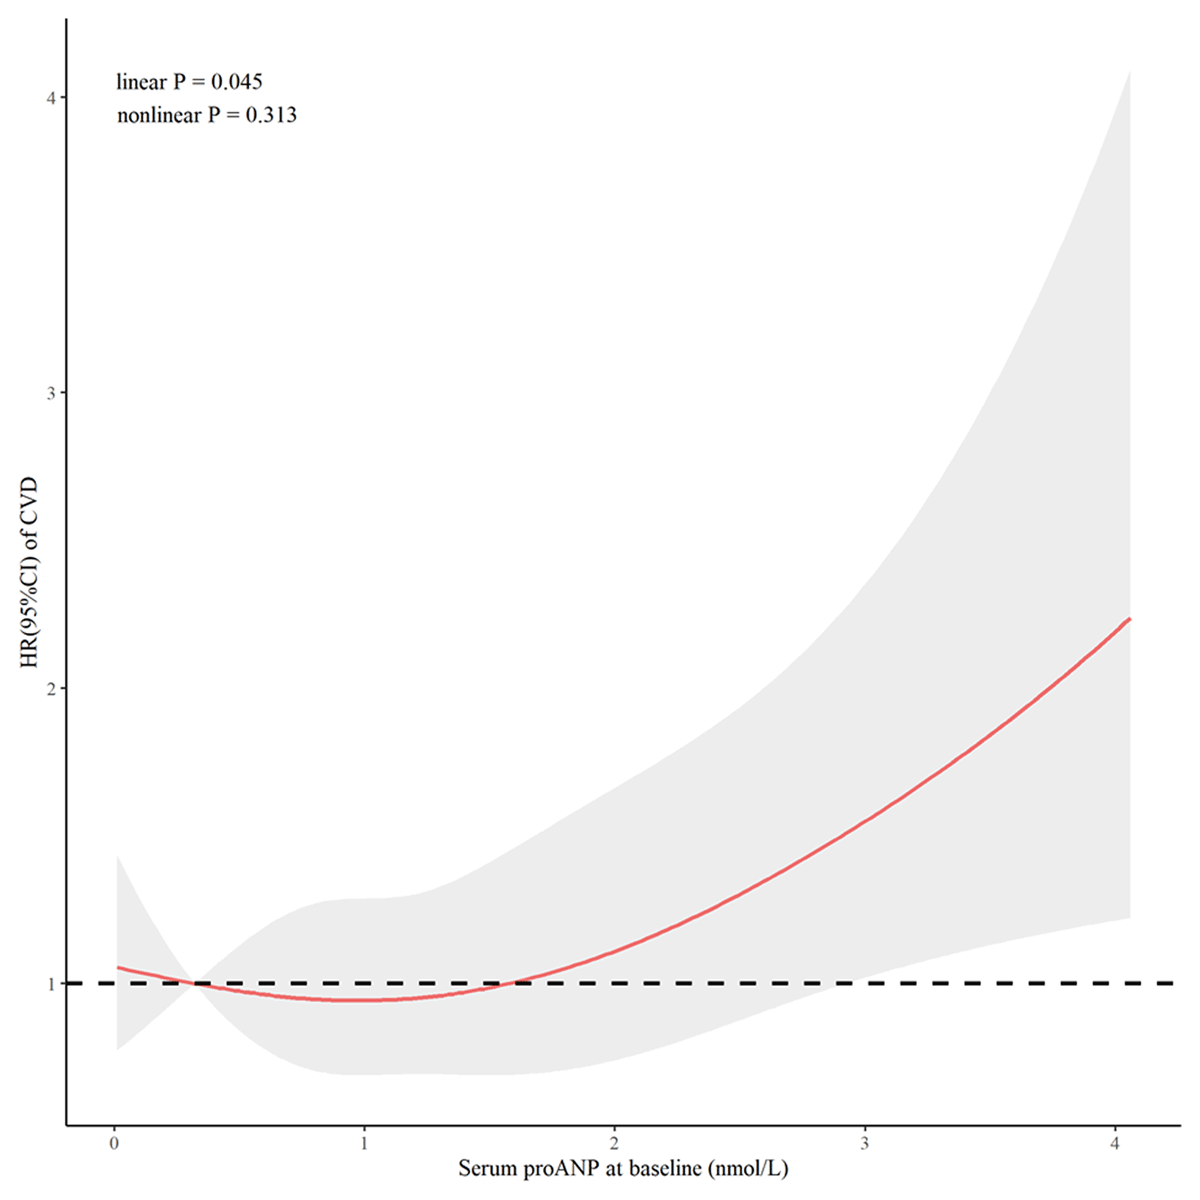
Figure 3
Cubic spline curves visualizing the impact of serum proANP on CVD. Hazard ratios (red line) and their 95% confidence intervals (gray shadow) of CVD associated with baseline serum proANP levels were calculated by constructing a restricted cubic spline regression model with knots placed at the 5th, 35th, 65th, and 95th percentiles of serum proANP levels, after adjusting for age, sex, education level, current smoking, current drinking, systolic blood pressure, body mass index, low-density lipoprotein cholesterol, high-density lipoprotein cholesterol, fasting glucose, and antihypertension medications at baseline. HR: Hazard ratios.
Table 2
The prospective association between baseline proANP and CVD events during follow-up.
| SUBGROUPS | UN-ADJUSTED | ADJUSTED* | ||
|---|---|---|---|---|
| HR (95% CI) | P | HR (95% CI) | P | |
| Continuous | ||||
| proANP (per 1 nmol/L) | 1.49 (1.26–1.75) | <0.001 | 1.22 (1.03–1.44) | 0.025 |
| Categorical | ||||
| Lower (<1.61 nmol/L) | 1.00 (ref) | – | 1.00 (ref) | – |
| Higher (≥1.61 nmol/L) | 1.84 (1.36–2.48) | <0.001 | 1.34 (0.99–1.81) | 0.059 |
[i] * Adjusted for age, sex, education level, cigarette smoking, alcohol consumption, body mass index, fasting glucose, and low- and high-density lipoprotein cholesterol, systolic blood pressure, and antihypertensive medication at baseline.
CVD: cardiovascular disease; HR: Hazard ratio; CI: Confidence interval.
Table 3
The prospective association between baseline NPPA promoter methylation and incident CVD.
| CpG loci | GENOMIC POSITION, GRCh37 | RELATIVE TO TSS, bp | AVERAGE METHYLATION % | INCIDENT CVD | ||
|---|---|---|---|---|---|---|
| HR (95%CI)* | P | q | ||||
| Single CpG association | ||||||
| CpG1 | Chr1:11908353 | –513 | 28.55 ± 5.22 | 0.67 (0.40–1.12) | 0.129 | 0.340 |
| CpG2 | Chr1:11908348 | –508 | 93.17 ± 2.52 | 0.89 (0.02–32.47) | 0.950 | 0.950 |
| CpG3 | Chr1:11908299 | –459 | 22.84 ± 3.84 | 0.50 (0.30–0.82) | 0.006 | 0.050 |
| CpG4 | Chr1:11908200 | –360 | 68.28 ± 6.49 | 0.60 (0.23–1.57) | 0.294 | 0.529 |
| CpG5 | Chr1:11908182 | –342 | 81.68 ± 4.89 | 0.49 (0.10–2.36) | 0.378 | 0.566 |
| CpG6 | Chr1:11908178 | –338 | 40.06 ± 6.12 | 0.66 (0.37–1.17) | 0.151 | 0.340 |
| CpG7 | Chr1:11908168 | –328 | 50.29 ± 6.44 | 0.53 (0.26–1.07) | 0.077 | 0.340 |
| CpG8 | Chr1:11908165 | –325 | 30.68 ± 6.41 | 0.89 (0.59–1.32) | 0.552 | 0.710 |
| CpG9 | Chr1:11908142 | –302 | 36.53 ± 7.74 | 0.91 (0.62–1.34) | 0.633 | 0.712 |
| Gene-based association | ||||||
| wTPM | 0.008 | |||||
[i] Risks of incident CVD associated with every twofold increase in DNA methylation levels during follow-up, after adjusting for age, sex, education level, cigarette smoking, alcohol consumption, body mass index, fasting glucose, and low- and high-density lipoprotein cholesterol, systolic blood pressure, antihypertension medication.
CVD: cardiovascular disease; GRCh37: Genome Reference Consortium Human Build 37; TSS: Transcription start site; HR: Hazard ratio; CI: Confidence interval; wTPM: Weighted truncated product method.
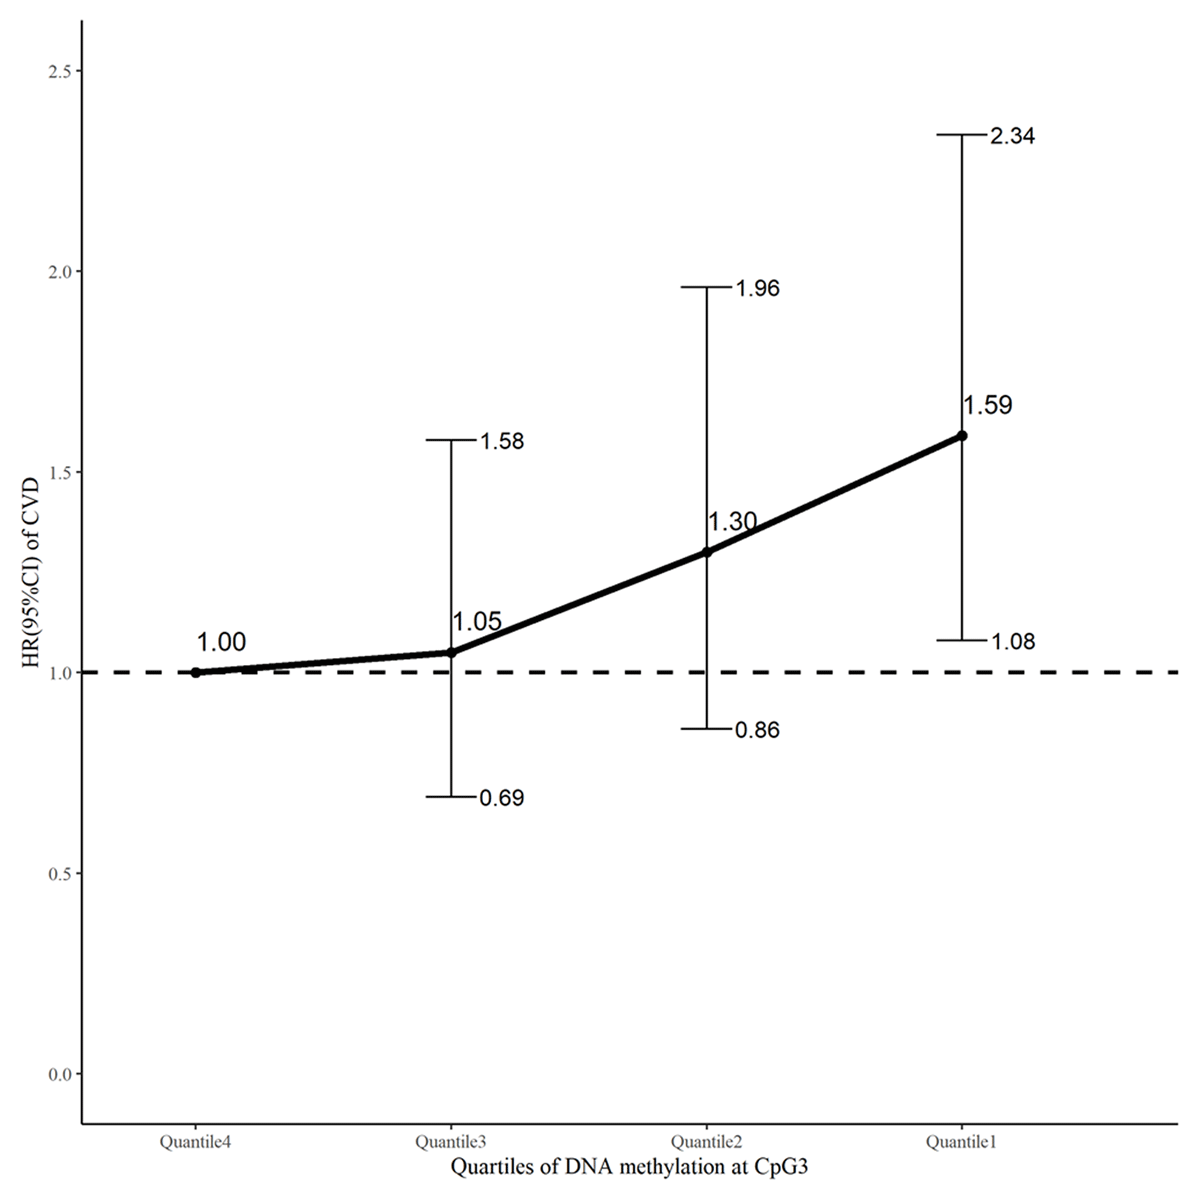
Figure 4
An illustration of the association between quartiles of DNA methylation level at CpG3 (with the highest quartile as a reference) and incident CVD. Hazard ratios (black dot) and their 95% confidence intervals (error bar) of CVD for participants with the 1st, 2nd, and 3rd quartiles, in comparison to those with the highest quartile of CpG3 methylation, were calculated by a competing-risks survival regression model, adjusting for age, sex, education level, current smoking, current drinking, systolic blood pressure, body mass index, low- and high-density lipoprotein cholesterol, fasting glucose, and antihypertension medications at baseline.
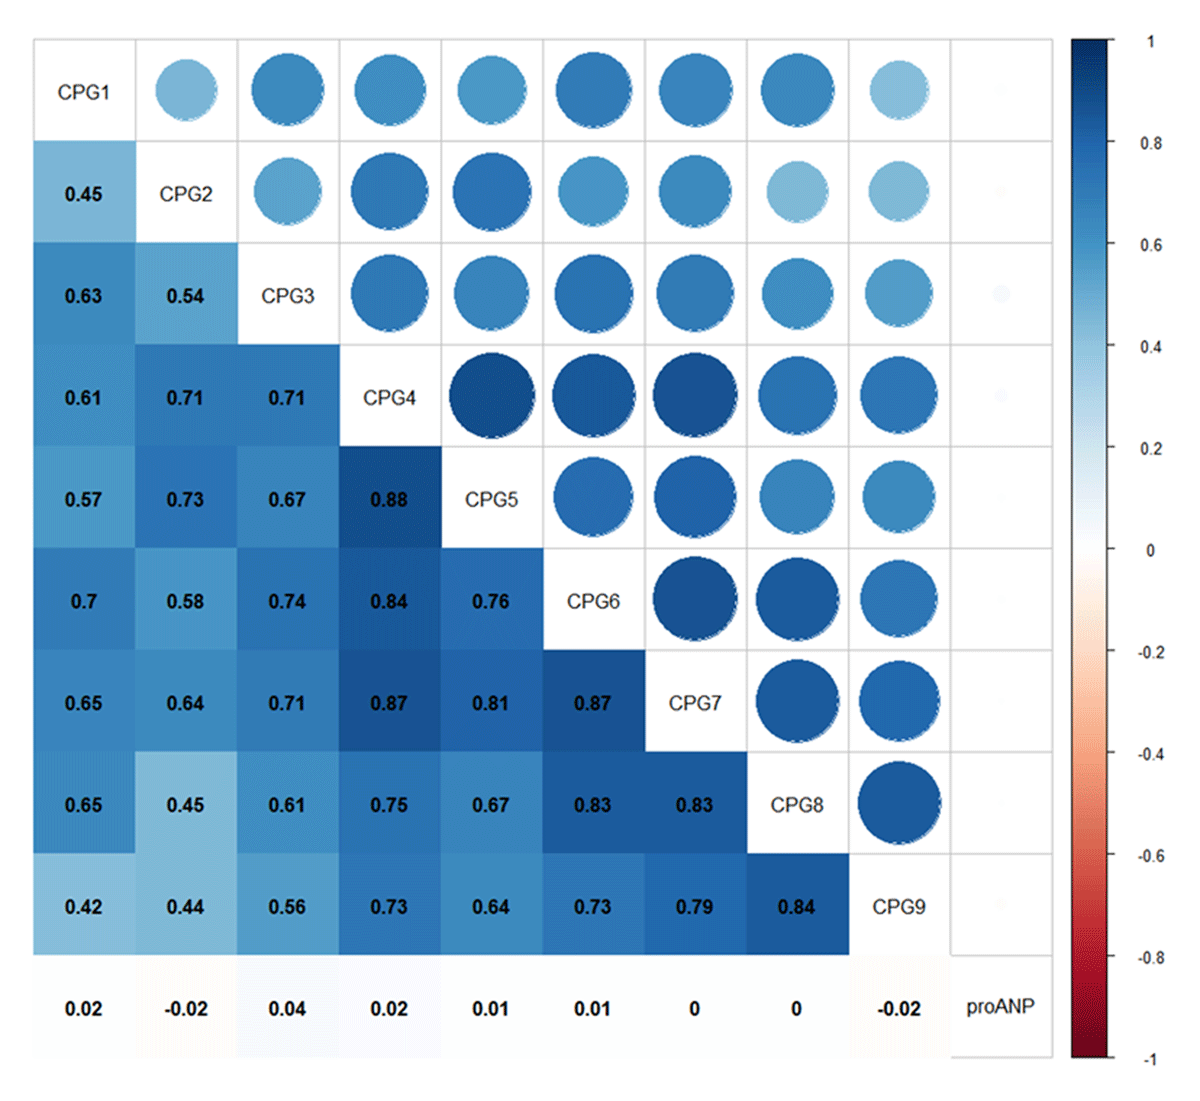
Figure 5
The spearman correlation matrix among DNA methylation levels at all CpG loci assayed in NPPA promoter and proANP. The spearman correlation coefficient is shown in the lower left part of the picture. The color depth of the square represents the strength of the correlation. The size and color of the circle in the upper left part of the picture also represent the strength of correlation. Large circle area and color represent strong correlation.
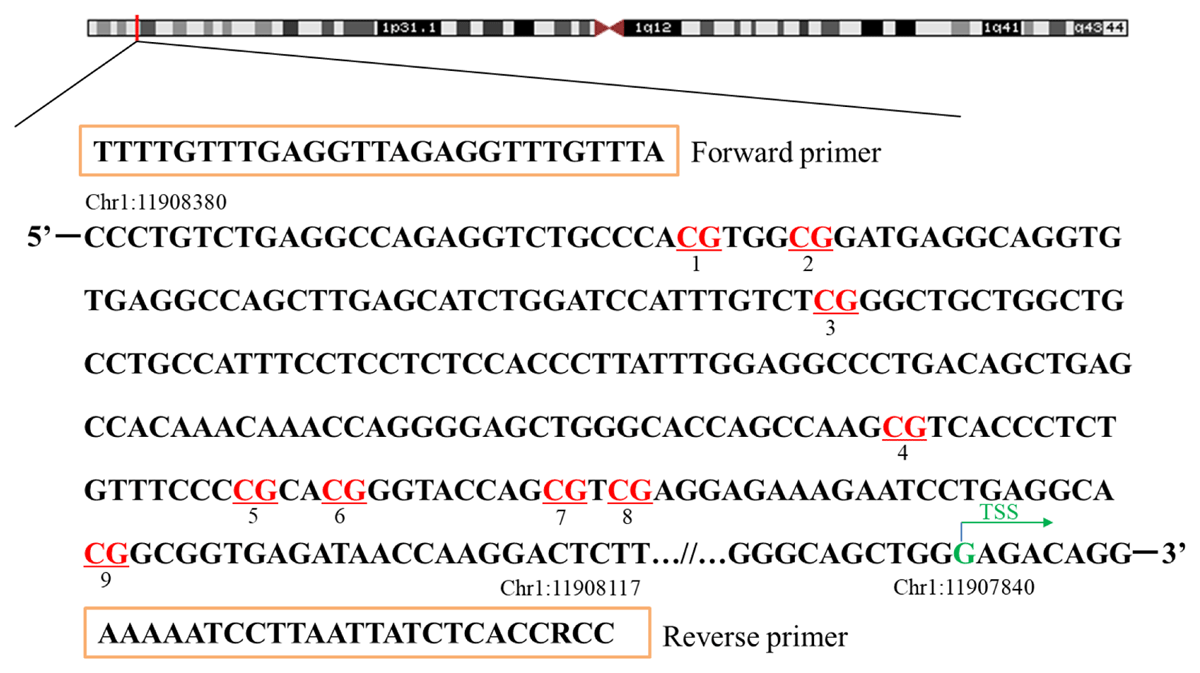
Supplementary Figure S1
A schematic illustration of the targeted sequence and primers for targeted bisulfite sequencing. Red represents the CpG loci assayed in the NPPA gene promoter (–540 ~ –277 bp from TSS). TSS: transcriptional start site.