
Table 1
Demographic and baseline clinical characteristics of all patients in the two groups.
| GROUP I (TIMI 3 FLOW) (N = 415) (86.5%) | GROUP II (NO-REFLOW) (N = 65) (13.5%) | P VALUE | |
|---|---|---|---|
| Age, years | 54.99 ± 9.06 | 57.52 ± 9.40 | 0.037* |
| Male gender, n (%) | 212 (51.1%) | 35 (53.8%) | 0.679 |
| Hypertension, n (%) | 154 (37.1%) | 25 (38.5%) | 0.834 |
| Diabetes mellitus, n (%) | 115 (27.7%) | 20 (30.8%) | 0.610 |
| Smoking, n (%) | 112 (27.0%) | 24 (36.9%) | 0.098 |
| Dyslipidemia, n (%) | 154 (37.1%) | 26 (40.0%) | 0.654 |
| Prior myocardial infarction, n (%) | 32 (7.7%) | 4 (6.2%) | 0.658 |
| Chronic kidney disease, n (%) | 51 (12.3%) | 11 (16.9%) | 0.300 |
| BMI, (kg/m2) | 25.03 ± 3.22 | 25.37 ± 3.08 | 0.435 |
| Systolic BP, mmHg | 119.6 ± 19.5 | 108.5 ± 24.3 | 0.001* |
| Diastolic BP, mmHg | 77.45 ± 12.7 | 74.26 ± 13.4 | 0.064 |
| Heart rate, (bpm) | 72.24 ± 13.3 | 74.78 ± 13.9 | 0.156 |
| Atrial fibrillation, n (%) | 47 (11.3%) | 13 (20.0%) | 0.049* |
| Killip class > 1 | 75 (18.1%) | 19 (29.2%) | 0.035* |
| LVEF, (%) | 45.36 ± 4.92 | 45.12 ± 5.75 | 0.725 |
| Non-diabetic patients with SH, n (%) | 34 (11.3%) | 17 (37.8%) | 0.001* |
| Non-diabetic patients with euglycemia, n (%) | 266 (88.7%) | 28 (62.2%) | |
| Diabetic patients with SH, n (%) | 21 (18.3%) | 9 (45.0%) | 0.008* |
| Diabetic patients with euglycemia, n (%) | 94 (81.7%) | 11 (55.0%) |
[i] BMI: body mass index; BP: blood pressure; LVEF: left ventricular ejection fraction; SH: stress hyperglycemia; *: significant P value.
Table 2
Laboratory results of all patients in the two groups.
| GROUP I (TIMI 3 FLOW) (N = 415) (86.5%) | GROUP II (NO-REFLOW) (N = 65) (13.5%) | P VALUE | |
|---|---|---|---|
| RBS in non-diabetic patients with euglycemia, mg/dl | 114.9 ± 16.5 | 118.0 ± 20.2 | 0.348 |
| RBS in non-diabetic patients with SH, mg/dl | 174.7 ± 23.9 | 201.4 ± 29.6 | 0.001* |
| RBS in diabetic patients with euglycemia, mg/dl | 168.8 ± 22.4 | 178.7 ± 16.7 | 0.163 |
| RBS in diabetic patients with SH, mg/dl | 246.9 ± 50.4 | 302.2 ± 8.33 | 0.003* |
| Hemoglobin level, g/dL | 12.32 ± 1.34 | 12.09 ± 1.42 | 0.221 |
| Creatinine pre-procedure, mg/dl | 1.029 ± 0.24 | 1.055 ± 0.28 | 0.427 |
| Creatinine post-procedure, mg/dl | 1.190 ± 0.47 | 1.220 ± 0.49 | 0.633 |
| CK-MB, U/L | 89.25 ± 43.4 | 85.08 ± 43.5 | 0.472 |
| HbA1c in non-diabetic patients with euglycemia, % | 5.18 ± 0.390 | 5.13 ± 0.394 | 0.577 |
| HbA1c in non-diabetic patients with SH, % | 5.16 ± 0.452 | 5.20 ± 0.466 | 0.764 |
| HbA1c in diabetic patients with euglycemia, % | 6.35 ± 0.161 | 6.35 ± 0.129 | 0.929 |
| HbA1c in diabetic patients with SH, % | 6.40 ± 0.122 | 6.44 ± 0.072 | 0.433 |
| Total cholesterol, mg/dl | 219.9 ± 54.4 | 229.4 ± 56.9 | 0.194 |
| HDL, mg/dl | 39.13 ± 8.18 | 39.84 ± 8.88 | 0.517 |
| LDL, mg/dl | 131.9 ± 24.8 | 130.5 ± 22.0 | 0.660 |
| Triglycerides, mg/dl | 180.8 ± 39.5 | 182.8 ± 37.4 | 0.697 |
[i] RBS: random blood sugar; SH: stress hyperglycemia; CK-MB: Creatine kinase myocardial band; HDL: high density lipoprotein; LDL: low-density lipoprotein; *: significant P value.
Table 3
Angiographic results of all patients in the two groups.
| GROUP I (TIMI 3 FLOW) (N = 415) (86.5%) | GROUP II (NO-REFLOW) (N = 65) (13.5%) | P VALUE | |
|---|---|---|---|
| The total ischemia time, h | 5.20 ± 2.94 | 5.11 ± 2.86 | 0.813 |
| Initial TIMI flow | |||
| 0 | 331 (79.8%) | 53 (81.5%) | 0.956 |
| 1 | 34 (8.2%) | 4 (6.2%) | |
| 2 | 19 (4.6%) | 3 (4.6%) | |
| 3 | 31 (7.5%) | 5 (7.7%) | |
| Thrombus burden | |||
| Low | 141 (34.0%) | 23 (35.4%) | 0.748 |
| Moderate | 160 (38.6%) | 22 (33.8%) | |
| High | 114 (27.5%) | 20 (30.8%) | |
| Aspiration catheter | 31 (7.5%) | 13 (20%) | 0.001* |
| Glycoprotein IIb/IIIa inhibitors | 47 (11.3%) | 55 (84.6%) | 0.001* |
| Reperfusion type | |||
| Balloon angioplasty | 24 (5.8%) | 35 (53.8%) | 0.001* |
| Direct stenting | 116 (28.0%) | 12 (18.5%) | |
| Stenting after pre-dilatation | 275 (66.3%) | 18 (27.7%) | |
| Length of the lesion, mm | 20.68 ± 5.11 | 21.29 ± 6.15 | 0.385 |
| Volume of contrast agent, (ml) | 182.5 ± 65.1 | 170.3 ± 76.3 | 0.170 |
| Culprit vessel | |||
| LM coronary artery, n (%) | 3 (0.7%) | 2 (3.1%) | 0.082 |
| LAD coronary artery, n (%) | 168 (40.5%) | 24 (36.9%) | 0.586 |
| CX coronary artery, n (%) | 124 (29.9%) | 23 (35.4%) | 0.371 |
| Right coronary artery, n (%) | 120 (28.9%) | 16 (24.6%) | 0.474 |
| Post-procedural TIMI flow | |||
| 0 | 0 (0.0%) | 22 (33.8%) | 0.001* |
| 1 | 0 (0.0%) | 28 (43.1%) | |
| 2 | 0 (0.0%) | 15 (23.1%) | |
| 3 | 415 (100%) | 0 (0.0%) | |
[i] TIMI: thrombolysis in myocardial infarction; LM: left main; LAD: left anterior descending; CX: circumflex; *: significant P value.
Table 4
Multivariate regression analysis for the independent predictors of no-reflow phenomenon.
| MULTIVARIATE ANALYSIS | P VALUE | ||
|---|---|---|---|
| OR | (95% CI) | ||
| Age > 60 years | 1.019 | 0.550–1.886 | 0.953 |
| Stress hyperglycemia | 3.247 | 1.656–6.368 | 0.001* |
| Killip class >1 | 1.893 | 1.004–3.570 | 0.049* |
| Atrial fibrillation | 1.161 | 0.504–2.677 | 0.726 |
| Cardiogenic shock | 3.778 | 1.458–9.790 | 0.006* |
| Cardiac arrest | 2.595 | 0.758–8.876 | 0.129 |
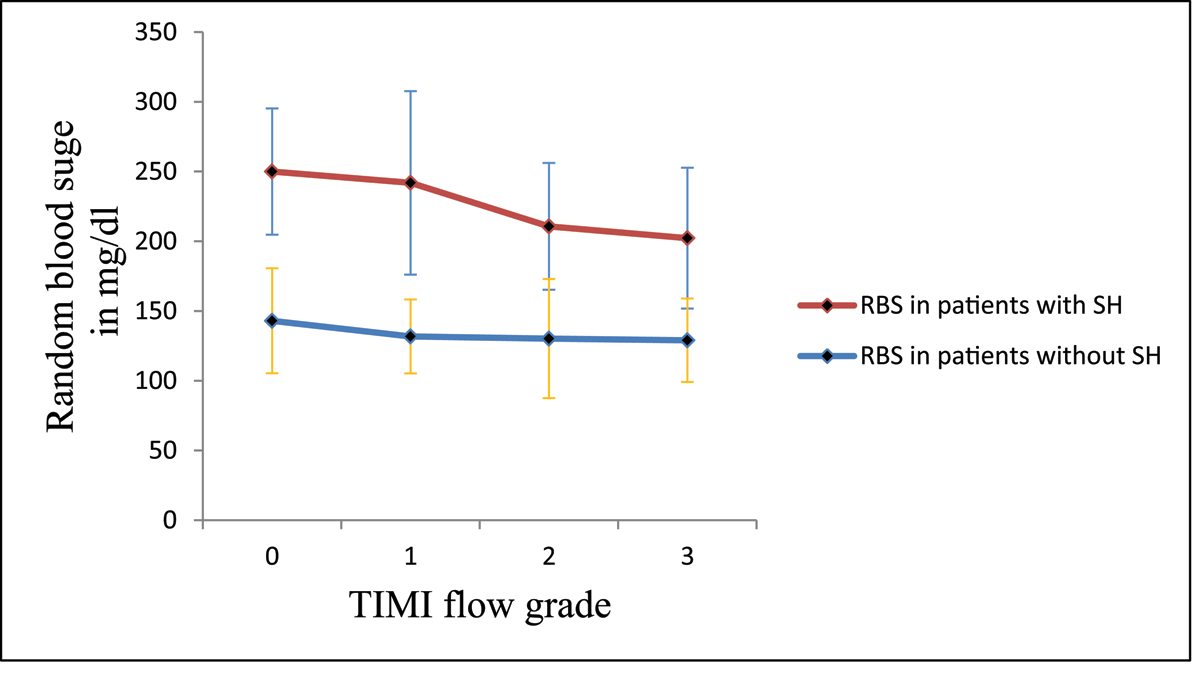
Figure 1
Relationship between random blood sugar in patients with and without stress hyperglycemia and TIMI flow grade.
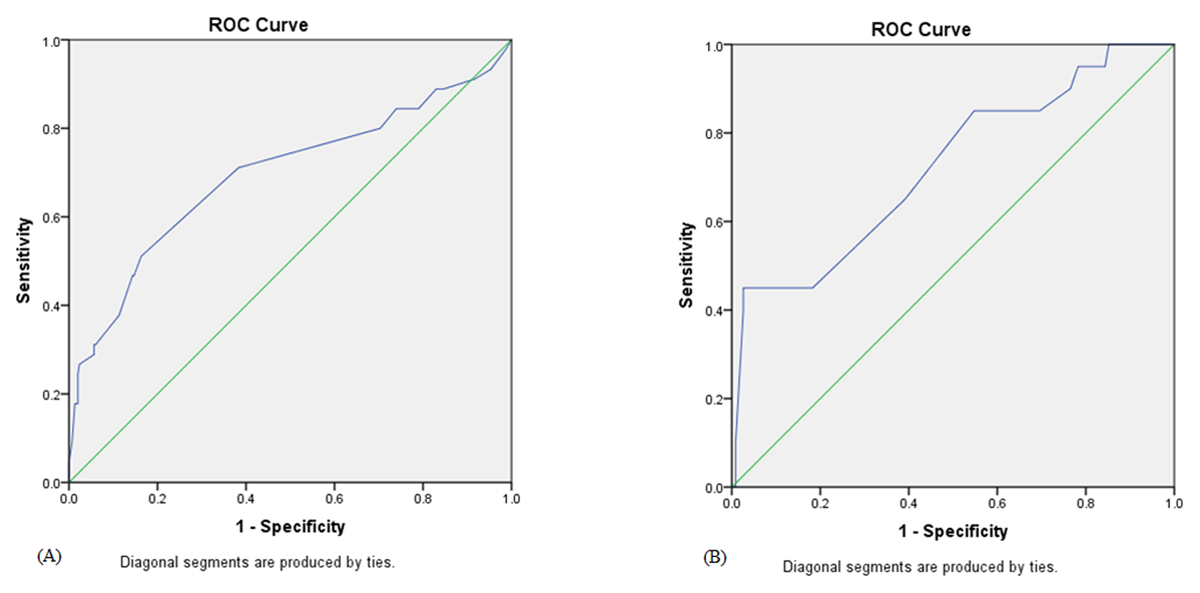
Figure 2
ROC curve analysis for random blood sugar in non-diabetic (A) and diabetic patients (B) for prediction of no-reflow phenomenon after primary percutaneous coronary intervention.
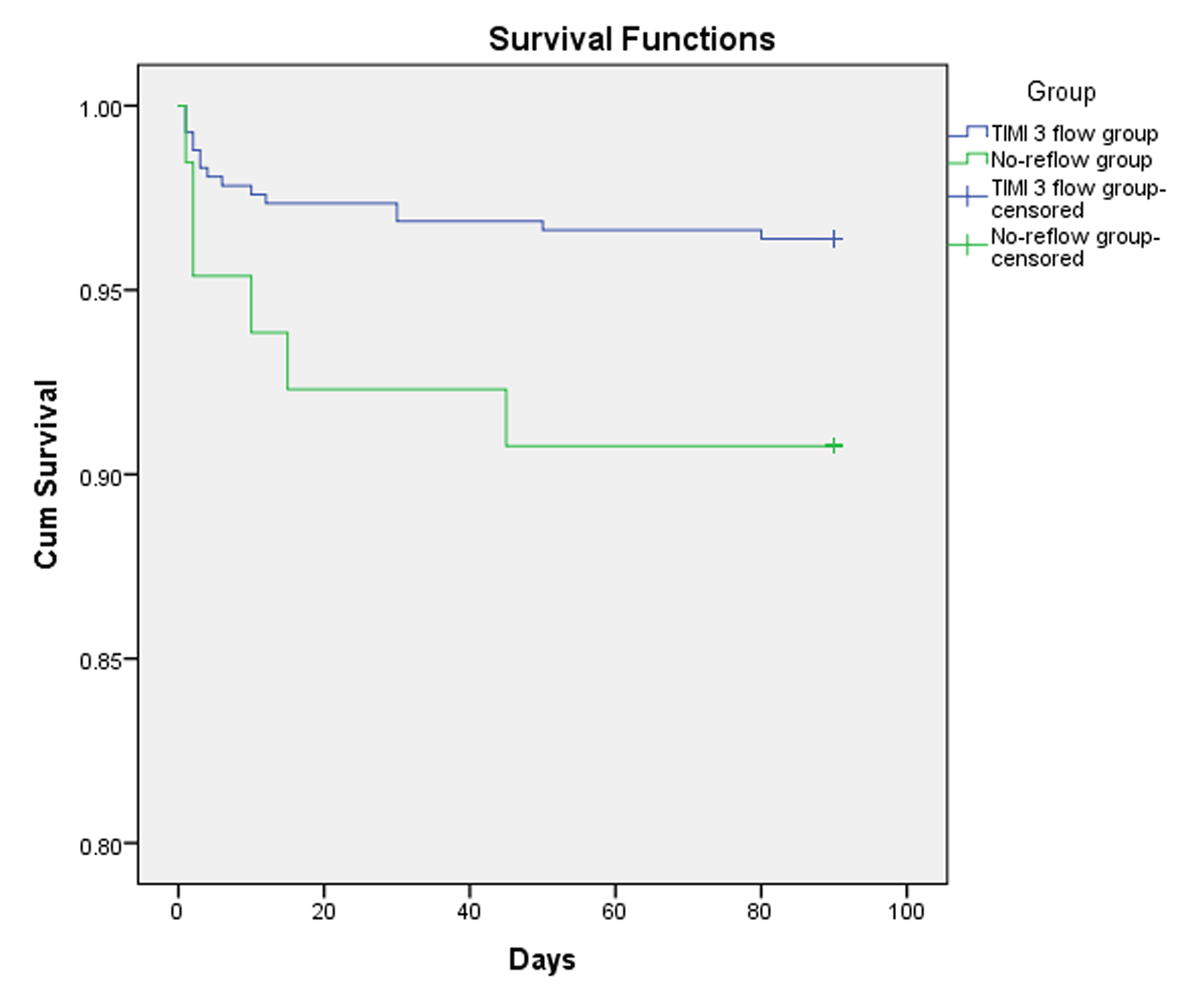
Figure 3
Kaplan-Meier curve showing survival functions of the patients in Group I (TIMI 3 flow) and Group II (no-reflow group).
Table 5
Clinical outcomes of all patients in the two groups.
| GROUP I (TIMI 3 FLOW) (N = 415) (86.5%) | GROUP II (NO-REFLOW) (N = 65) (13.5%) | P VALUE | |
|---|---|---|---|
| Mortality, n (%) | 15 (3.6%) | 6 (9.2%) | 0.040* |
| Major bleeding, n (%) | 5 (1.2%) | 1 (1.5%) | 0.822 |
| Cardiogenic shock, n (%) | 14 (3.4%) | 12 (18.5%) | 0.001* |
| Cardiac arrest, n (%) | 9 (2.2%) | 5 (7.5%) | 0.014* |
| Heart failure, n (%) | 48 (11.6%) | 13 (20.0%) | 0.058 |
| Contrast-induced nephropathy, n (%) | 42 (10.1%) | 12 (18.5%) | 0.048* |
| Re-infarction, n (%) | 11 (2.7%) | 4 (6.2%) | 0.131 |