
Table 1
Patient characteristics and clinical outcomes for incident hospitalisations for heart failure.
| YEAR | 2007–2008 | 2009–2010 | 2011–2012 | 2013–2014 | 2015–2016 | |||||||
|---|---|---|---|---|---|---|---|---|---|---|---|---|
| n | % | n | % | n | % | n | % | n | % | |||
| Age | ||||||||||||
| Mean (SD) | 64.6 | 13.1 | 64.3 | 13.1 | 64.0 | 13.3 | 63.9 | 13.4 | 63.7 | 13.4 | ||
| Age group | ||||||||||||
| 20–<25 | 99 | 0.5 | 113 | 0.5 | 92 | 0.5 | 108 | 0.5 | 118 | 0.5 | ||
| 25–<30 | 147 | 0.8 | 171 | 0.8 | 184 | 0.9 | 186 | 0.9 | 214 | 0.9 | ||
| 30–<35 | 219 | 1.2 | 266 | 1.3 | 235 | 1.2 | 299 | 1.4 | 367 | 1.5 | ||
| 35–<40 | 328 | 1.7 | 358 | 1.7 | 384 | 2.0 | 428 | 2.0 | 603 | 2.4 | ||
| 40–<45 | 575 | 3.0 | 707 | 3.4 | 641 | 3.3 | 740 | 3.5 | 920 | 3.7 | ||
| 45–<50 | 1123 | 5.9 | 1252 | 5.9 | 1211 | 6.2 | 1244 | 5.9 | 1530 | 6.2 | ||
| 50–<55 | 1815 | 9.6 | 1948 | 9.2 | 1898 | 9.7 | 1956 | 9.3 | 2264 | 9.1 | ||
| 55–<60 | 2228 | 11.8 | 2599 | 12.3 | 2516 | 12.9 | 2762 | 13.1 | 3177 | 12.8 | ||
| 60–<65 | 2603 | 13.7 | 3036 | 14.4 | 2803 | 14.4 | 3190 | 15.2 | 3744 | 15.1 | ||
| 65–<70 | 2733 | 14.4 | 2931 | 13.9 | 2666 | 13.7 | 2925 | 13.9 | 3657 | 14.7 | ||
| 70–<75 | 2869 | 15.2 | 3184 | 15.1 | 2654 | 13.6 | 2615 | 12.4 | 3046 | 12.3 | ||
| 75–<80 | 2106 | 11.1 | 2211 | 10.5 | 2144 | 11.0 | 2391 | 11.4 | 2612 | 10.5 | ||
| 80–<85 | 1284 | 6.8 | 1420 | 6.7 | 1276 | 6.5 | 1332 | 6.3 | 1628 | 6.6 | ||
| 85+ | 803 | 4.2 | 868 | 4.1 | 799 | 4.1 | 879 | 4.2 | 965 | 3.9 | ||
| Sex | ||||||||||||
| Male | 10459 | 55.2 | 11743 | 55.7 | 10808 | 55.4 | 11774 | 55.9 | 14082 | 56.7 | ||
| Female | 8473 | 44.8 | 9321 | 44.3 | 8695 | 44.6 | 9281 | 44.1 | 10763 | 43.3 | ||
| Geographical region | ||||||||||||
| West Malaysia | 16615 | 87.8 | 18891 | 89.7 | 17459 | 89.5 | 18541 | 88.1 | 21989 | 88.5 | ||
| East Malaysia | 2317 | 12.2 | 2173 | 10.3 | 2044 | 10.5 | 2514 | 11.9 | 2856 | 11.5 | ||
| Ethnicity | ||||||||||||
| Malay | 11233 | 59.3 | 12732 | 60.4 | 12102 | 62.1 | 12837 | 61.0 | 15242 | 61.3 | ||
| Chinese | 3522 | 18.6 | 3968 | 18.8 | 3471 | 17.8 | 3764 | 17.9 | 4433 | 17.8 | ||
| Indian | 2182 | 11.5 | 2355 | 11.2 | 2123 | 10.9 | 2284 | 10.8 | 2585 | 10.4 | ||
| Others | 1922 | 10.2 | 1793 | 8.5 | 1798 | 9.2 | 2156 | 10.2 | 2585 | 10.4 | ||
| Missing | 73 | 0.4 | 216 | 1.0 | 9 | 0.05 | 14 | 0.1 | 0 | 0 | ||
| Length of Stay | ||||||||||||
| Median (IQR) | 3 | 2–5 | 3 | 2–5 | 3 | 2–5 | 3 | 2–5 | 3 | 2–5 | ||
| Mean (SD) | 4.7 | 12.2 | 4.5 | 14.4 | 4.3 | 7.0 | 4.2 | 7.0 | 4.1 | 5.0 | ||
| Number of admissions per year | ||||||||||||
| Median (IQR) | 1 | 0–2 | 1 | 0–2 | 1 | 0–2 | 1 | 0–2 | 1 | 0–2 | ||
| Mean (SD) | 1.3 | 2.2 | 1.4 | 2.3 | 1.3 | 2.1 | 1.5 | 2.3 | 1.6 | 2.5 | ||
| Mortality rate | ||||||||||||
| In-hospital | 1309 | 6.9 | 1297 | 6.2 | 1177 | 6.0 | 859 | 4.1 | 918 | 3.7 | ||
| 30-days | 2482 | 13.1 | 2526 | 12.0 | 2285 | 11.7 | 2076 | 9.9 | 2406 | 9.7 | ||
| 1-year | 6531 | 34.5 | 6945 | 33.0 | 6299 | 32.3 | 6965 | 33.1 | 8163 | 32.9 | ||
| Readmission rate | ||||||||||||
| 30-days | 3144 | 16.6 | 3795 | 18.0 | 3387 | 17.4 | 4039 | 19.2 | 2421 | 19.6† | ||
| Total | 18932 | 21064 | 19503 | 21055 | 24845 | |||||||
[i] † Data only available for 2015 and its denominator is 12373.
Table 2
Multivariable Poisson regression analysis for readmission and mortality rates during hospital stay, 30 days and 1 year.
| READMISSION | MORTALITY | |||||||||||
|---|---|---|---|---|---|---|---|---|---|---|---|---|
| 30-DAY | IN-HOSPITAL | 30-DAY | 1-YEAR | |||||||||
| RATE RATIO (95% CI) | p-VALUE | RATE RATIO (95% CI) | p-VALUE | RATE RATIO (95% CI) | p-VALUE | RATE RATIO (95% CI) | p-VALUE | |||||
| Time | 1.02 | (1.01–1.03) | *** | 0.93 | (0.92–0.94) | *** | 0.96 | (0.96–0.97) | *** | 1.00 | (0.99–1.00) | |
| Sex (ref = Women) | ||||||||||||
| Men | 1.16 | (1.13–1.20) | *** | 1.02 | (0.97–1.08) | 1.11 | (1.07–1.15) | *** | 1.17 | (1.15–1.19) | *** | |
| Ethnicity (ref = Malay) | ||||||||||||
| Chinese | 1.12 | (1.08–1.16) | *** | 1.21 | (1.12–1.30) | ** | 1.08 | (1.03–1.13) | ** | 0.95 | (0.93–0.98) | *** |
| Indian | 1.12 | (1.07–1.17) | ** | 0.82 | (0.74–0.91) | ** | 0.80 | (0.75–0.85) | *** | 0.87 | (0.84–0.90) | *** |
| Others | 0.81 | (0.77–0.86) | *** | 1.91 | (1.77–2.07) | *** | 1.30 | (1.23–1.37) | *** | 0.96 | (0.93–0.99) | * |
| Age (ref = 60–<65) | ||||||||||||
| 20–<25 | 1.14 | (0.94–1.37) | 2.49 | (1.88–3.22) | *** | 1.73 | (1.40–2.11) | *** | 0.98 | (0.85–1.12) | ||
| 25–<30 | 1.01 | (0.86–1.17) | 2.62 | (2.12–3.21) | *** | 1.75 | (1.48–2.04) | *** | 0.99 | (0.89–1.10) | ||
| 30–<35 | 0.83 | (0.72–0.95) | ** | 2 | (1.64–2.43) | *** | 1.39 | (1.20–1.60) | *** | 0.86 | (0.78–0.94) | ** |
| 35–<40 | 0.98 | (0.88–1.08) | 1.25 | (1.01–1.53) | * | 1.09 | (0.95–1.25) | 0.83 | (0.76–0.89) | *** | ||
| 40–<45 | 0.95 | (0.87–1.03) | 1.15 | (0.96–1.36) | 0.98 | (0.88–1.10) | 0.83 | (0.78–0.88) | *** | |||
| 45–<50 | 0.94 | (0.88–1.01) | 0.88 | (0.75–1.02) | 0.84 | (0.76–0.93) | ** | 0.82 | (0.78–0.86) | *** | ||
| 50–<55 | 0.99 | (0.93–1.05) | 0.85 | (0.74–0.96) | * | 0.82 | (0.75–0.89) | *** | 0.87 | (0.83–0.91) | *** | |
| 55–<60 | 0.98 | (0.93–1.03) | 0.93 | (0.83–1.05) | 0.90 | (0.83–0.97) | ** | 0.93 | (0.89–0.96) | *** | ||
| 65–<70 | 0.97 | (0.92–1.02) | 1.07 | (0.96–1.20) | 1.08 | (1.01–1.16) | * | 1.05 | (1.02–1.09) | ** | ||
| 70–<75 | 0.91 | (0.87–0.96) | ** | 1.14 | (1.02–1.27) | * | 1.23 | (1.15–1.31) | *** | 1.15 | (1.11–1.20) | *** |
| 75–<80 | 0.86 | (0.81–0.91) | *** | 1.26 | (1.12–1.41) | *** | 1.34 | (1.25–1.44) | *** | 1.24 | (1.19–1.29) | *** |
| 80–<85 | 0.84 | (0.79–0.90) | *** | 1.53 | (1.36–1.73) | *** | 1.59 | (1.47–1.71) | *** | 1.37 | (1.31–1.43) | *** |
| 85+ | 0.75 | (0.69–0.81) | *** | 1.84 | (1.61–2.10) | *** | 1.94 | (1.79–2.11) | *** | 1.59 | (1.51–1.66) | *** |
| Intercept | 0.16 | (0.15–0.17) | *** | 0.06 | (0.06–0.07) | *** | 0.11 | (0.10–0.12) | *** | 0.3 | (0.29–0.31) | *** |
[i] * p < 0.05, ** p < 0.01, *** p < 0.001.
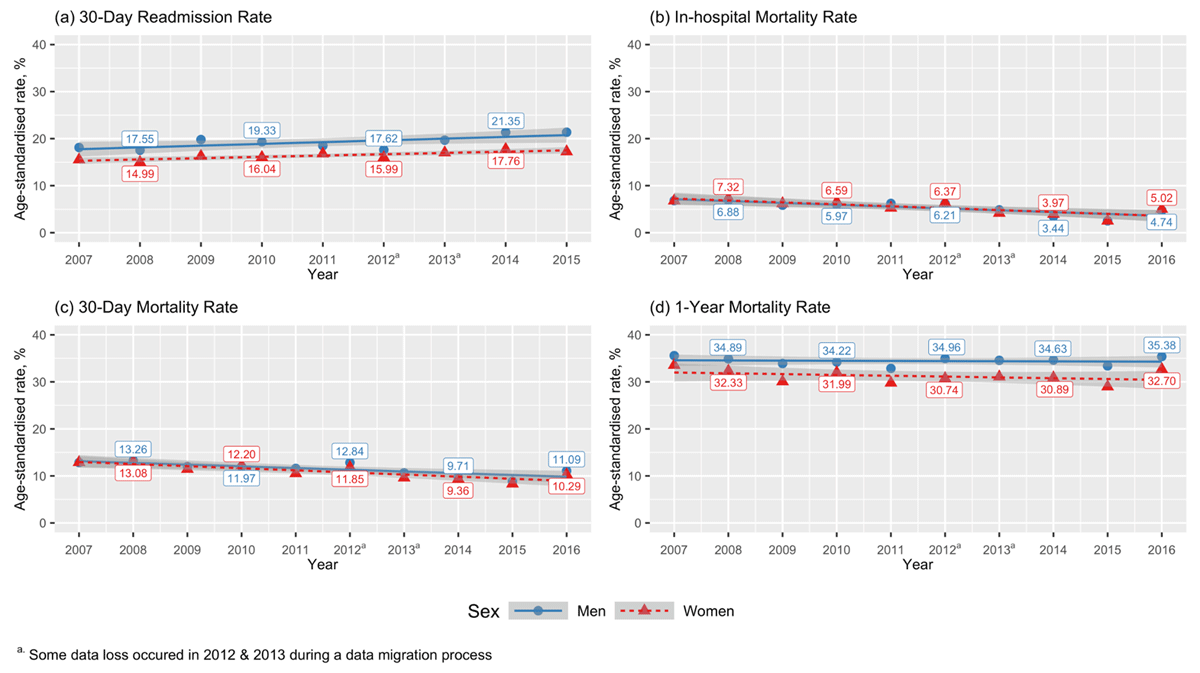
Figure 1
Trends for (a) 30-day readmission, (b) in-hospital, (c) 30-day and (d) one-year all-cause mortality rates by men and women.
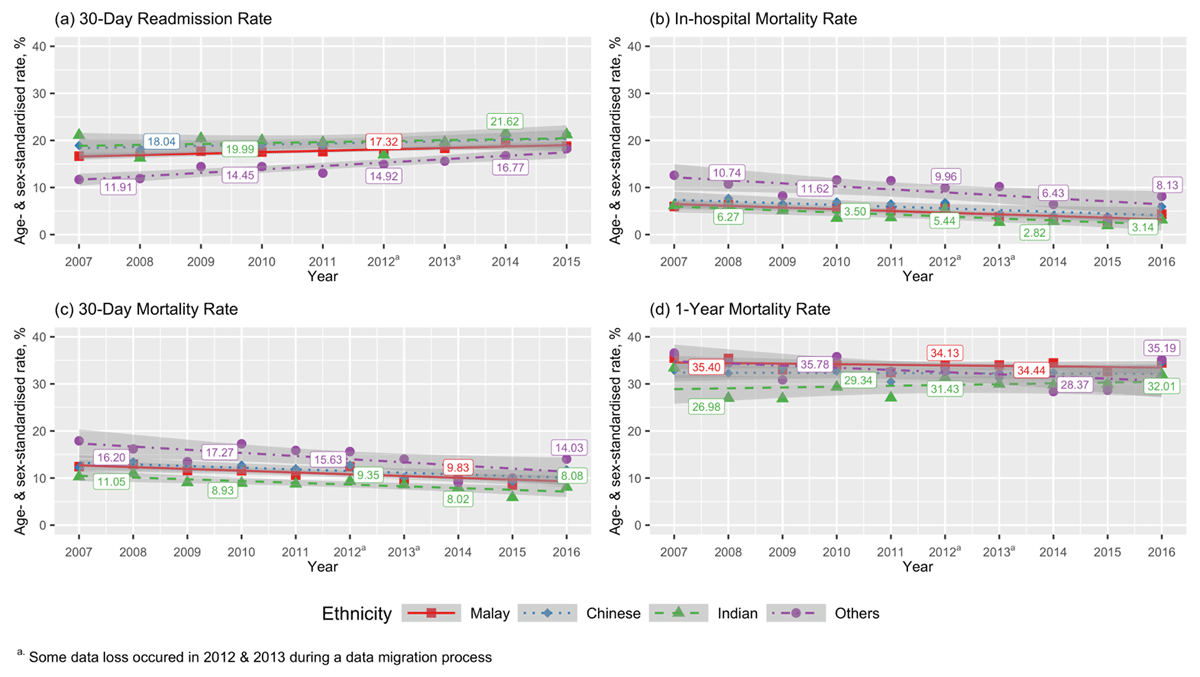
Figure 2
Trends for (a) 30-day readmission, (b) in-hospital, (c) 30-day and (d) one-year all-cause mortality rates by ethnicity.
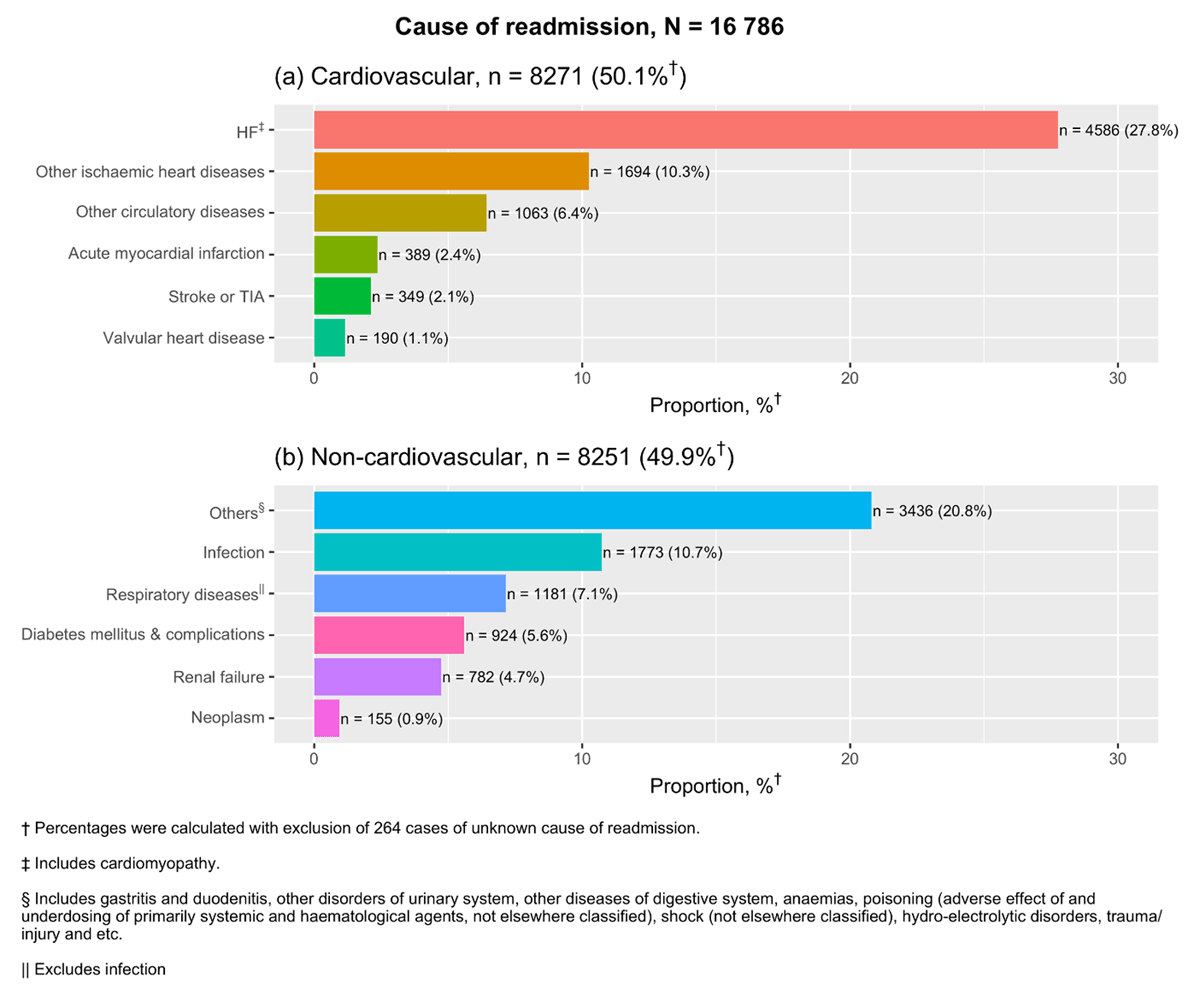
Figure 3
Causes of readmission in 30 days after index hospital admission from 2007–2015.
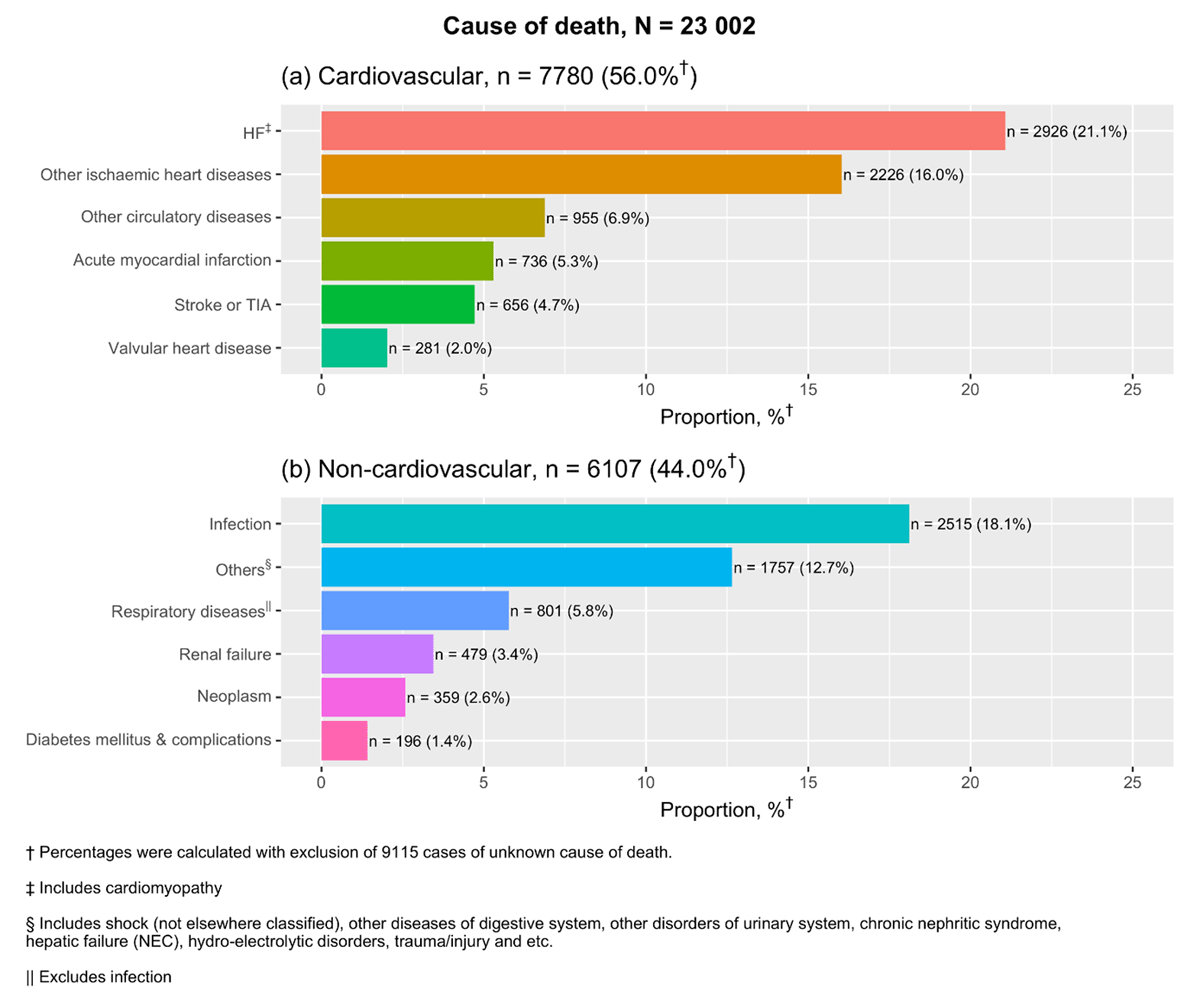
Figure 4
Causes of death for patients who died within one year after index admission from 2007–2013.
| HF | Heart failure |
| ICD | International Classification for Diseases |
| MOH | Ministry of Health |