
Table 1
Clinical and procedural characteristics of patients according to KIF 6 polymorphism.
| VARIABLE | KIF 6 POLYMORPHISM | |||
|---|---|---|---|---|
| Clinicalcharacteristics | Trp-Trp (n = 584) | Trp-Arg (n = 525) | Arg-Arg (n = 144) | p-value |
| Age (M-SD) | 68.1+/–10.7 | 67.8+/–11 | 68+/–12.3 | 0.90 |
| Male sex (%) | 68.2 | 71.6 | 65.3 | 0.94 |
| Hypertension (%) | 75.9 | 72.2 | 80.6 | 0.81 |
| Smokers (%) | 0.26 | |||
| Active smokers (%) | 19.9 | 20.6 | 22.9 | |
| Previoussmokers (%) | 22.1 | 28.4 | 20.1 | |
| Hypercolesterolemia (%) | 58 | 56.2 | 66 | 0.31 |
| Diabetes (%) | 35.3 | 35.4 | 42.4 | 0.23 |
| Family history of CAD (%) | 26.6 | 27.4 | 33.3 | 0.17 |
| Previous AMI (%) | 27.2 | 24.8 | 27.1 | 0.66 |
| Previous PCI (%) | 26 | 28.2 | 28.5 | 0.40 |
| Previous CABG (%) | 10.9 | 12.8 | 12.5 | 0.40 |
| Previous CVA (%) | 6.8 | 6.9 | 6.3 | 0.85 |
| Renal failure (%) | 12.8 | 15.8 | 15.3 | 0.21 |
| Indication for angiography | 0.15 | |||
| Stable angina or silent ischemia (%) | 22.2 | 22.3 | 20.2 | |
| Acute Coronary Syndrome (%) | 55.9 | 59.9 | 67.7 | |
| DCM or valvular disease (%) | 22 | 17.8 | 12.1 | |
| Baseline Chemistry | ||||
| Haemoglobin (M-SD) | 13.5+/–1.6 | 13.3+/–1.7 | 12.9+/–1.6 | 0.03 |
| Platelet (M-SD) | 214.4+/–60.3 | 219.4+/–70.5 | 225.1+/–70.5 | 0.16 |
| Glycaemia at admission (M-SD) | 127+/–48.4 | 124.6+/–47.2 | 125.3+/–64.7 | 0.07 |
| Baseline creatinine (M-SD) | 1+/–0.28 | 1.05+/–0.45 | 1.01+/–0.36 | 0.08 |
| Absolute creatinine increase (M-SD) | 0.08+/–0.27 | 0.07+/–0.24 | 0.11+/–0.31 | 0.30 |
| Relative creatinine increase (M-SD) | 0.09+/–0.26 | 0.09+/–0.19 | 0.13+/–0.31 | 0.20 |
| Creatinine clearance (M-SD) | 78.8+/–31.6 | 78+/–34.6 | 79.7+/–34.2 | 0.83 |
| Reactive protein C (M-SD) | 1.34+/–3.02 | 1.33+/-2.43 | 1.36+/-2.46 | 0.99 |
| Total Cholesterol (M-SD) | 160.6+/–40.8 | 161.5+/–43.1 | 158.1+/–44.7 | 0.70 |
| HDL-Cholesterol (M-SD) | 41.6+/–13.4 | 41.2+/–13 | 41.5+/–13.9 | 0.84 |
| Triglycerides (M-SD) | 134+/–71.2 | 139.4+/–98.8 | 132.6+/–67.9 | 0.48 |
| LDL-Cholesterol (M-SD) | 93.3+/–36.3 | 93.6+/–39.9 | 90.8+/–38.7 | 0.74 |
| Procedural characteristics | ||||
| PTCA (%) | 58.6 | 61.3 | 55.2 | 0.89 |
| Radial access (%) | 33.2 | 36.2 | 36.1 | 0.32 |
| Contrast volume (M-SD) | 233.7+/–157 | 231.3+/–152.5 | 237.4+/–172.9 | 0.91 |
| Theraphy at admission | ||||
| ACE I (%) | 41.4 | 42.3 | 43.4 | 0.76 |
| ARB (%) | 26.9 | 20.2 | 19.2 | 0.01 |
| Statins (%) | 54.3 | 50.9 | 58.3 | 0.90 |
| Nitrate (%) | 35.8 | 39.2 | 36 | 0.58 |
| Beta-Blockers (%) | 57.7 | 57 | 46 | 0.04 |
| ASA (%) | 59.6 | 61.7 | 71.1 | 0.03 |
| Clopidogrel (%) | 20.8 | 26.4 | 29.3 | 0.01 |
| CalciumAntagonist (%) | 22.2 | 21.9 | 27.5 | 0.35 |
| Diuretics (%) | 35.2 | 32.1 | 36.8 | 0.82 |
[i] SD = Standard Deviation; CAD = coronary artery disease; MI = myocardial infarction; PCI = percutaneous coronary intervention; CABG = coronary artery by-pass graft; DCM = dilated cardiomyopathy; HDL = high density lipoprotein; LDL = low density lipoprotein; PTCA = percfutaneous coronary intervention; ACE = angiotensin converting enzyme; ARB = angiotensin II receptor blockers; ASA = acetylsalicylic acid.
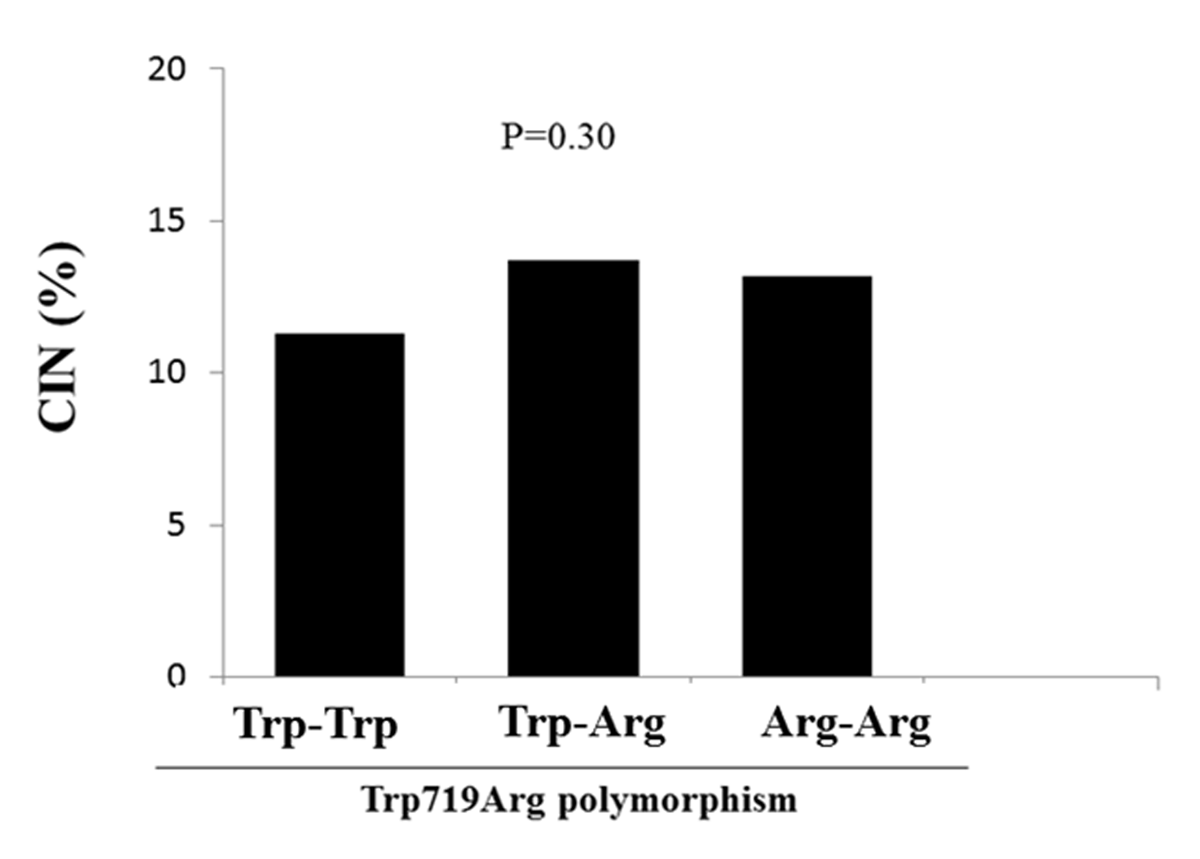
Figure 1
Bar graph showing the relationship between KIF 6 polymorphism and the risk of contrast-induced nephropathy.

Figure 2
Forrest plot showing the relationship between KIF 6 polymorphism (wild type and homozygous patients) and CIN among main risk known risk factors.
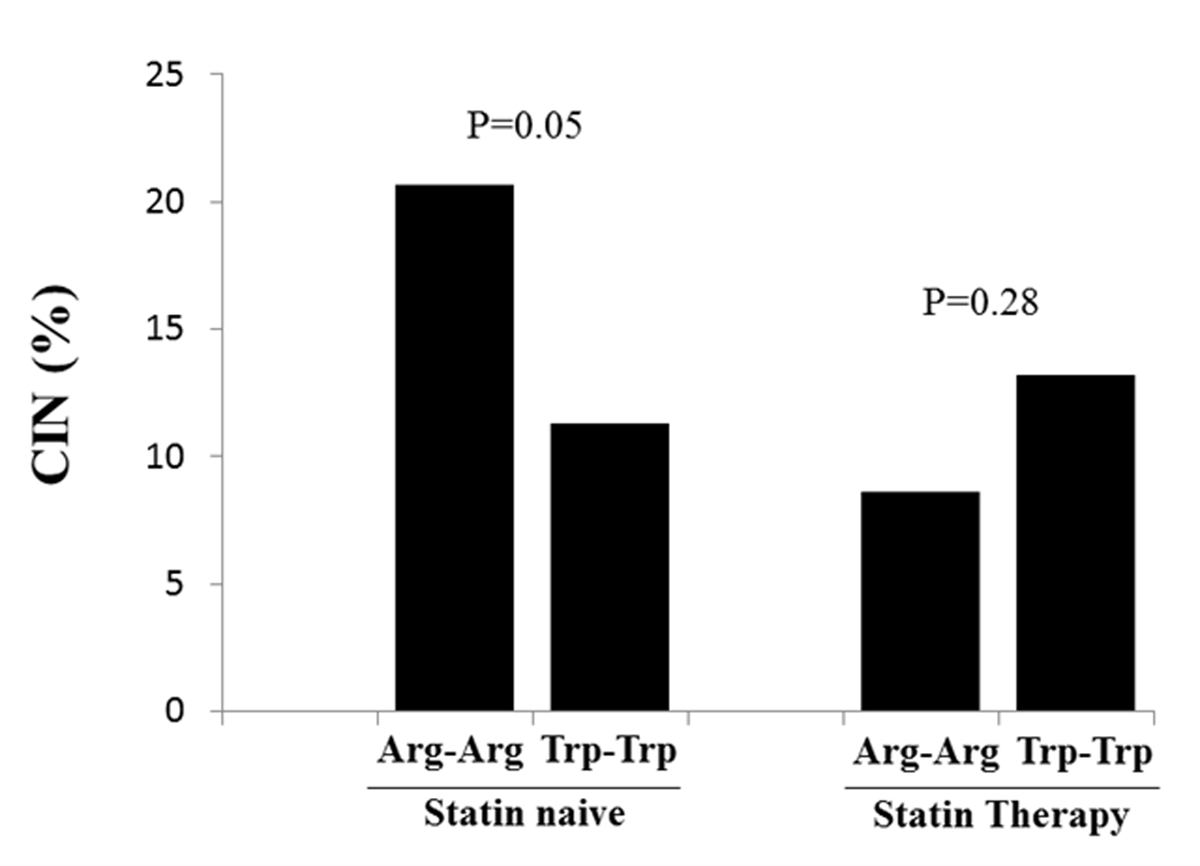
Figure 3
Bar graph showing the relationship between statin therapy at admission and the risk of contrast-induced nephropathy among homozygous and wild-type patients.