
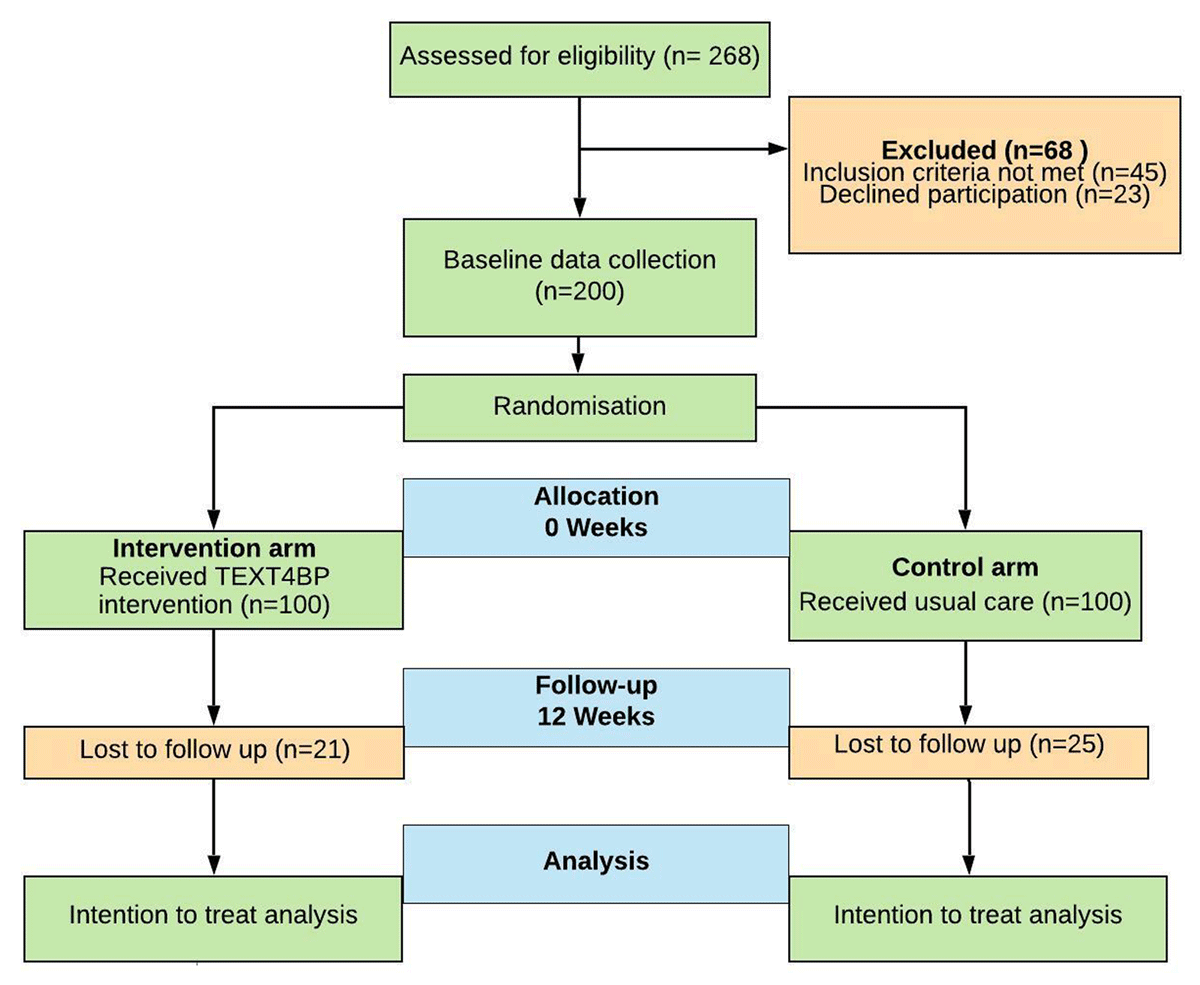
Figure 1
CONSORT flow diagram of the TEXT4BP Study.
Table 1
Comparison of baseline sociodemographic and outcome measures in the intervention and control arm.
| CHARACTERISTICS | CATEGORY | INTERVENTION ARM N = 100 | CONTROL ARM N = 100 | P VALUE |
|---|---|---|---|---|
| Age (years) | 18–45 | 32 | 23 | 0.28a |
| 46–60 | 57 | 61 | ||
| 61– 69 | 11 | 16 | ||
| Mean ± SD | 49.2 ± 9.78 | 51.7 ± 9.21 | 0.071 | |
| Sex, n | Female | 42 | 47 | 0.48 a |
| Literacy status,+ n | Literate | 82 | 72 | 0.091 a |
| Ethnicity*, n | Upper caste groups | 63 | 60 | 0.34 a |
| Relative advantages and disadvantages Janajatis | 29 | 36 | ||
| Others** | 8 | 4 | ||
| Marital status, n | Married | 88 | 92 | 0.35 a |
| Employment, n | Employed | 53 | 55 | 0.77 a |
| Religion, n | Hindu | 92 | 91 | 0.80 a |
| Others | 8 | 9 | ||
| Systolic BP (mmHg) | Mean ± SD | 134 ± 19.5 | 137 ± 25.3 | 0.38 b |
| Diastolic BP (mmHg) | Mean ± SD | 84 ± 11.6 | 86 ± 13.4 | 0.35 b |
| BP control (<140/90 mmHg) | N (%) | 60 | 54 | 0.39 a |
| Duration of hypertension (years) | Mean ± SD | 5.40 ± 6.02 | 6.50 ± 6.18 | 0.20a |
| Antihypertensive agents used | One | 73 | 74 | 0.87 a |
| More than one | 27 | 26 | ||
| Other comorbidities*** | Yes | 56 | 62 | 0.39 a |
| Hill Bone Compliance score | ||||
| Total score (56) | Mean ± SD | 25.9 ± 6.10 | 25.5 ± 6.13 | 0.61 b |
| – Medication related score (36) | Mean ± SD | 14.6 ± 4.77 | 14.0 ± 5.07 | 0.43 b |
| – Salt related score (12) | Mean ± SD | 7.06 ± 1.36 | 7.02 ± 1.31 | 0.043 b |
| – Appointment related score (8) | Mean ± SD | 4.35 ± 0.98 | 4.50 ± 0.97 | 0.28 b |
| Medication adherence self-efficacy score | Mean ± SD | 36.6 ± 7.87 | 36.6 ± 9.68 | 0.95 b |
| Knowledge of hypertension score | Mean ± SD | 17.5 ± 3.75 | 17.3 ± 3.92 | 0.66 b |
[i] Note: Number and percentage are the same as the denominator is 100 for each. a p value of Chi-square test, b p-value of the t-test * caste classification card used in STEPS survey Nepal is used for ethnicity division with six caste category [54]. ** others = (Dalit, disadvantaged non-Dalit Terai caste groups, religious minorities) *** other comorbidities: Diabetes, COPD, Arthritis, etc., + Literate: Ability to read and write.
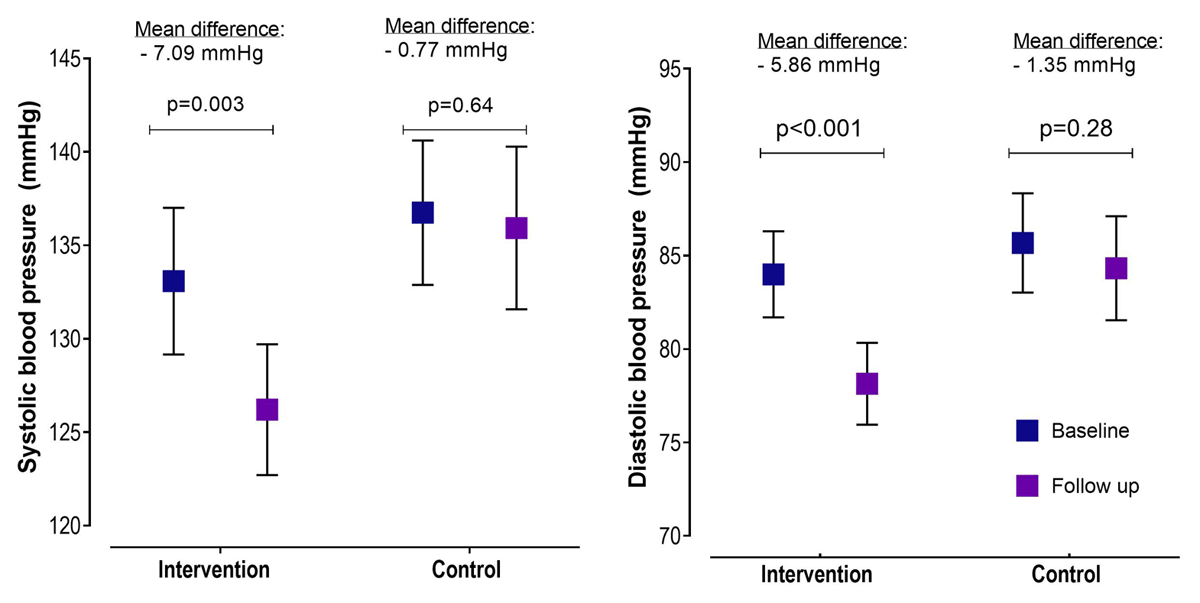
Figure 2
Change in systolic and diastolic blood pressure from baseline to follow-up in the text message intervention and control groups.
Table 2
Effectiveness of the TEXT4BP intervention among the intervention group compared to the control group.
| OUTCOME VARIABLE | INTERVENTION (12 WEEKS) M (SD) | CONTROL (12 WEEKS) M (SD) | P VALUEa | TIME*GROUPb REGRESSION COEFFICIENT MODEL 1 | TIME*GROUPb REGRESSION COEFFICIENT MODEL 2 | |||
|---|---|---|---|---|---|---|---|---|
| B (95% CI) | P VALUE | B (95% CI) | P VALUE | |||||
| Systolic BP | 126 ± 15.6 | 136 ± 18.9 | 0.001 | –6.36 (–12.5, –0.19) | 0.043 | –6.50 (–12.6, –0.33) | 0.039 | |
| Diastolic BP | 78.2 ± 9.8 | 84.3 ± 11.6 | <0.001 | –4.51 (–8.06, –0.97) | 0.013 | –4.60 (–8.16, –1.04) | 0.011 | |
| Hill Bone Compliance to High BP Therapy Scale** | ||||||||
| Total Hill Bone score [56] | 18.4 ± 2.55 | 22.5 ± 8.13 | <0.001 | –4.57 (–7.07, –2.07) | <0.001 | –4.48 (–6.97, –1.99) | <0.001 | |
| – Medication compliance score [36] | 10.1 ± 1.58 | 12.5 ± 5.76 | 0.001 | –3.01 (–4.92, –1.10) | 0.002 | –2.94 (–4.84, –1.03) | 0.003 | |
| – Salt related score [12] | 5.47 ± 1.36 | 6.59 ± 1.56 | <0.001 | –1.18 (–1.75, –0.62) | <0.001 | –1.18 (–1.75, –0.62) | <0.001 | |
| – Appointment related score [8] | 2.91 ± 1.02 | 3.43 ± 1.48 | 0.013 | –0.38 (–0.82, 0.058) | 0.95 | –0.38 (–0.82, 0.66) | 0.091 | |
| Medication adherence self-efficacy score [52] *** | 50.6 ± 2.01 | 46.7 ± 9.74 | 0.001 | 3.94 (0.55, 7.33) | 0.023 | 3.86 (0.49, 7.23) | 0.025 | |
| Knowledge of hypertension | 20.7 ± 2.39 | 18.5 ± 4.68 | <0.001 | 1.81 (0.39, 3.24) | 0.013 | 1.73 (0.32, 3.15) | 0.016 | |
[i] Note: M (SD) = Mean (Standard Deviation); a = t-test; CI = Confidence interval.
b = Results are presented as mean differences with the 95% CI at follow up (12 weeks) calculated using Mixed effect models with baseline value and control group as reference categories.
Model 1: Unadjusted; Model 2: adjusted for age, sex, education, marital status, occupation, religion, smoking, alcohol intake.
** the lower the score, the higher the adherence *** the higher the score, the better the medication adherence self-efficacy.
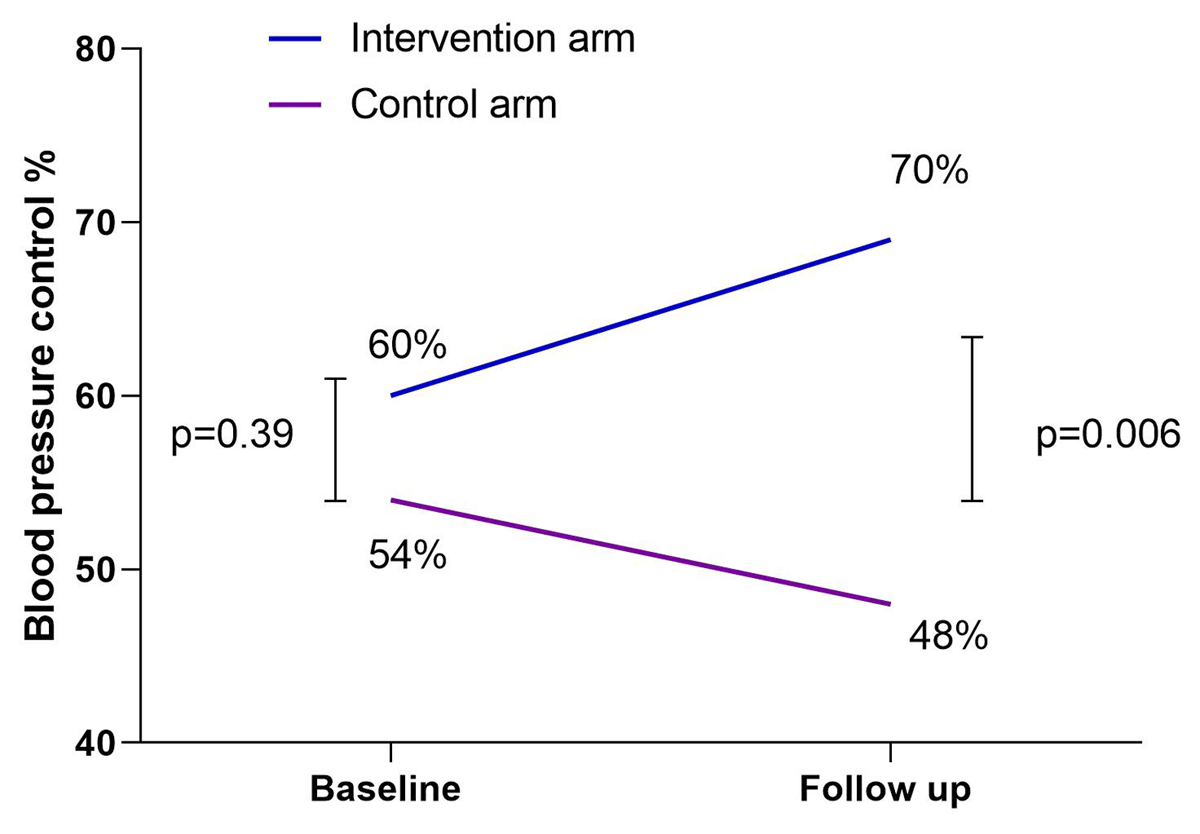
Figure 3
Blood pressure control at baseline and follow-up in the text message intervention and control groups.
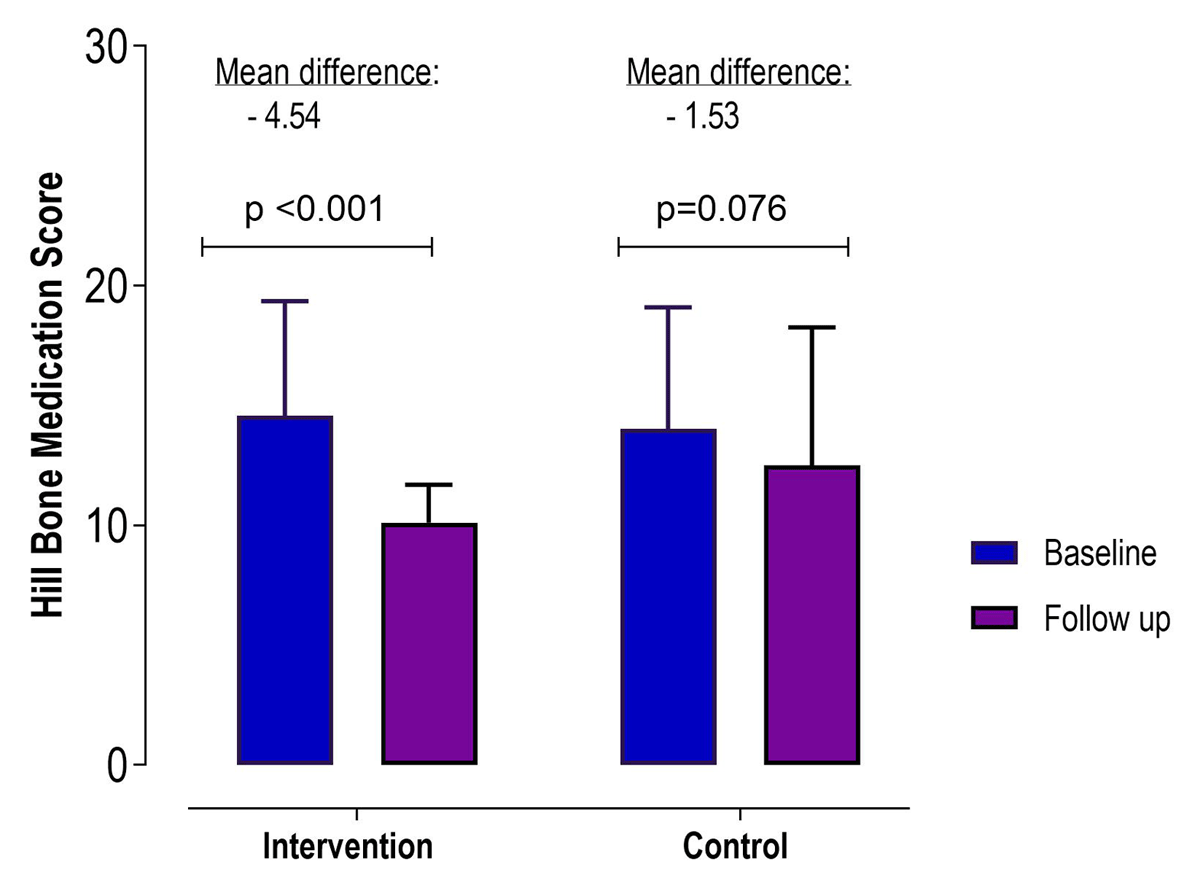
Figure 4
Change in Hill Bone medication compliance-related score from baseline to follow-up in the text message intervention group compared to the control group.
Table 3
Responses on the acceptability of the TEXT4BP intervention (n = 79).
| DO YOU THINK THOSE TEXT MESSAGES WERE | YES N (%) | NO N (%) |
|---|---|---|
| Useful, n | 70 (89) | 9 (11) |
| Culturally appropriate, n | 71 (90) | 8 (10) |
| Age appropriate, n | 71 (90) | 8 (10) |
| Would you recommend messages to others, n | 70 (89) | 9 (11) |
| Do you think those text message has had a positive impact on your | ||
| Overall BP, n | 68 (86) | 11 (14) |
| Diet or eating low salt and fat diet, n | 69 (87) | 10 (13) |
| Physical activity patterns, n | 58 (73) | 21 (27) |
| Knowledge of hypertension, n | 70 (89) | 9 (11) |
| Frequency of monitoring BP, n | 21 (22) | 58 (78) |