
Table 1
Cohort of COVID-19 patients with the 30-day outcome subclassified according to JNC8 criteria into six blood pressure stages (n = 9,531).
| TITLE OF THE GROUP JNC8 | BLOOD PRESSURE SYSTOLIC/DIASTOLIC, MMHG | N | % | |
|---|---|---|---|---|
| 1 | Normal | <120/<80 | 6697 | 70.3 |
| 2 | Elevated | 120–129/<80 | 568 | 6.0 |
| 3 | Stage-1 untreated^ | 130–139/80–89 | 457 | 4.8 |
| 4 | Stage-1 treated* | 130–139/80–89 | 711 | 7.5 |
| 5 | Stage-2 untreated^ | >40/>90 | 233 | 2.4 |
| 6 | Stage-2 treated* | >140/>90 | 865 | 9.1 |
| Total | 9,531 | 100 |
[i] * Patients were considered as treated if had previously established diagnosis of arterial hypertension, had antihypertensive prescription, and consumed medications within 90 days before the outpatient visit.
^ Patient were considered untreated if hypertension was not previously diagnosed (based on the patient history/charts), if the patient was aware of having hypertension but did not take prescribed medications or used ad hoc only in case of ‘emergency’.
Table 2
Baseline characteristics of COVID-19 patients with the 30-day outcome (n = 9,531). Hypertension was subclassified according to JNC8 criteria into six blood pressure stages (n = 9,531).
| NORMAL N = 6,697 | ELEVATED N = 568 | STAGE-1 UNTREATED N = 457 | STAGE-1 TREATED N = 711 | STAGE-2 UNTREATED N = 233 | STAGE-2 TREATED N = 865 | TOTAL N = 9,531 | |
|---|---|---|---|---|---|---|---|
| Age (years), mean ± SD | 35.9 ± 13.1 | 43.4 ± 11.3 | 51.8 ± 10.9 | 57.3 ± 10.1 | 61.4 ± 7.7 | 65.9 ± 9.7 | 41.9 ± 9.7 |
| Age ≥ 65 years, n (%) | 236 (3.5) | 23 (4.0) | 44 (9.6) | 143 (20.1) | 85 (35.6) | 428 (49.5) | 959 (10.1) |
| Sex, n (%) | |||||||
| Male | 3347 (50.0) | 305 (53.7) | 209 (45.7) | 300 (42.2) | 109 (46.8) | 420 (48.6) | 4,689 (49.2) |
| Female | 3350 (50.0) | 263 (46.3) | 248 (54.3) | 411 (57.8) | 124 (53.2) | 445 (51.4) | 4,842 (50.8) |
| Course of COVID-19 disease | |||||||
| Mild | 3,677 (54.9) | 232 (40.8) | 159 (34.8) | 298 (41.9) | 11 (4.7) | 343 (39.7) | 4,720 (49.5) |
| Moderately severe | 2,599 (38.8) | 212(37.3) | 135 (29.5) | 281 (39.5) | 72 (30.9) | 331 (38.3) | 3,630 (38.1) |
| Severe | 401 (5.9) | 116 (20.4) | 153 (33.4) | 110 (15.4) | 122 (52.3) | 147 (17.0) | 1,049 (11.0) |
| Critical (ICU admission) | 20 (0.3) | 8 (1.41) | 10 (2.2) | 22 (3.1) | 28 (12.02) | 44 (5.1) | 132 (1.38) |
| Comorbidities | |||||||
| History of myocardial infarction | 136 (2.0) | 36 (6.3) | 44 (9.6) | 73 (10.3) | 39 (16.7) | 206 (24.0) | 534 (5.6) |
| Obesity | 575 (8.6) | 225 (39.6) | 156 (34.1) | 255 (35.2) | 125 (53.6) | 350 (40.5) | 1,686 (17.7) |
| Diabetes | 262 (3.9) | 65 (11.4) | 115 (25.2) | 155 (21.8) | 115 (49.5) | 310 (35.8) | 1,022 (10.7) |
| Antihypertensive medications | |||||||
| ACEI | 189 (2.8) | 141 (24.8) | 92 (20.1) | 435 (61.2) | 42 (18.0) | 503 (58.2) | 1,387 (14.6) |
| ARB | 96 (1.4) | 45 (7.9) | 71 (15.5) | 198 (27.8) | 35 (15.0) | 395 (45.7) | 840 (8.8) |
| CCB | 49 (0.7) | 38 (6.7) | 30 (6.6) | 87 (12.2) | 18 (7.7) | 152 (17.6) | 374 (3.9) |
| BB | 339 (5.1) | 86(15.1) | 66 (14.4) | 275 (38.7) | 39 (16.7) | 407 (47.1) | 1,192 (12.5) |
| Diuretics | 121 (1.8) | 25 (4.4) | 32 (7.0) | 48 (6.8) | 16 (6.9) | 88 (10.2) | 330 (3.5) |
| Outcomes: | |||||||
| Duration of COVID-19, days1 | 8.7 ± 6.0 | 12.9 ± 7.8 | 14.9 ± 9.3 | 12.4 ± 7.7 | 21.9 ± 9.4 | 14.6± 8.2 | 10.4 ± 7.3 |
| Hospitalisation | 424 (6.33) | 120 (21.13) | 129 (28.23) | 142 (19.9) | 144 (61.8) | 224 (25.9) | 1,183 (12.4) |
| Stay in hospital, days | 9.4 ± 3.7 | 9.4 ± 3.8 | 9.3 ± 2.6 | 12.3 ± 4.7 | 11.4 ± 3.7 | 12.1 ± 5.0 | 10.5 ± 4.2 |
| Stay in ICU, days | 3.6 ± 3.4 | 3.4 ± 1.2 | 2.8 ± 1.3 | 4.1 ± 2.2 | 5.3 ± 3.1 | 5.0 ± 3.6 | 4.4 ± 3.1 |
| All-cause mortality 30-days | 13 (0.19) | 8 (1.41) | 0 | 18 (2.53) | 14 (6.01) | 59 (6.82) | 112 (1.18) |
[i] Data are n (%), where n is the number of participants with non-missing data, or mean ± SD. Baseline characteristics were calculated for the participants at the first outpatient exam. 1 COVID-19 symptoms onset to recovery or symptoms onset to death. ACEI = Angiotensin-converting enzyme inhibitors. ARB = Angiotensin-receptor blockers. BB = Beta-blockers. CCB = Calcium channel blockers CI = confidence interval. ICU = intensive care unit.
Table 3
Association between hospital admission and hypertension subclassified into six blood pressure stages according to JNC8 criteria in COVID-19 patients adjusted for confounders, multivariable logistic regression (n = 9,531).
| AVAILABLE DATA IN THE UNIVARIABLE ANALYSIS N = 9,531 | PATIENTS WHO WERE HOSPITALIZED N = 1,183 | UNIVARIABLE | MULTIVARIABLE | |||
|---|---|---|---|---|---|---|
| CRUDE ODDS RATIO (95% CI) | P VALUE | ADJUSTED ODDS RATIO (95% CI) | P VALUE | |||
| Arterial Hypertension | ||||||
| Normal | 6,697 | 424 (6.3) | 1 (ref) | 1 (ref) | .. | |
| Elevated | 568 | 120 (21.1) | 3.95 (3.16–4.95) | < 0.001 | 1.82 (1.42–2.34) | <0.001 |
| Stage-1 untreated | 457 | 129 (28.2) | 5.81 (4.63–7.29) | < 0.001 | 1.97 (1.52–2.56) | <0.001 |
| Stage-1 treated | 711 | 142 (19.9) | 3.68 (2.99–4.54) | < 0.001 | 0.91 (0.71–1.18) | 0.492 |
| Stage-2 untreated | 233 | 144 (61.8) | 23.91 (18.03–31.7) | < 0.001 | 4.51 (3.21–6.32) | <0.001 |
| Stage-2 treated | 865 | 224 (25.9) | 5.17 (4.31–6.19) | < 0.001 | 0.78 (0.61–1.01) | 0.061 |
| Age, years | 9,531 | 1.05 (1.05–1.06) | < 0.001 | 1.03(1.026–1.04) | <0.001 | |
| Sex | ||||||
| Male | 4,689 | 545 (11.6) | 1 (ref) | 1 (ref) | .. | |
| Female | 4,842 | 638 (13.2) | 1.15 (1.02–1.30) | 0.018 | 0.93 (0.98–1.30) | 0.107 |
| Myocardial infarction | ||||||
| No | 8,612 | 985 (11.4) | 1 (ref) | 1 (ref) | .. | |
| Yes | 919 | 198 (21.5) | 4.79 (3.98–5.78) | < 0.001 | 1.28 (0.98–1.30) | 0.058 |
| Obesity | ||||||
| No | 7,845 | 503 (6.4) | 1 (ref) | 1 (ref) | .. | |
| Yes | 1,686 | 680 (40.3) | 9.86 (8.63–11.26) | < 0.001 | 5.54 (4.78–6.44) | <0.001 |
| Diabetes | ||||||
| No | 8,509 | 735 (8.6) | 1 (ref) | 1 (ref) | .. | |
| Yes | 1,022 | 448 (43.8) | 8.26 (7.14–9.54) | < 0.001 | 3.35 (2.77–4.05) | <0.001 |
[i] Data are n (%) unless otherwise specified. CI = confidence interval.
Table 4
Association between ICU admission and hypertension subclassified into six blood pressure stages according to JNC8 criteria in COVID-19 patients adjusted for confounders, multivariable logistic regression (n = 9,531).
| AVAILABLE DATA IN THE UNIVARIABLEANALYSIS N = 9,531 | PATIENTS ADMITTED IN THE ICU N = 132 | UNIVARIABLE | MULTIVARIABLE | |||
|---|---|---|---|---|---|---|
| CRUDE ODDS RATIO (95% CI) | P VALUE | ADJUSTED ODDS RATIO (95% CI) | P VALUE | |||
| Arterial Hypertension | ||||||
| Normal | 6,697 | 20 (0.3) | 1 (ref) | 1 (ref) | .. | |
| Elevated | 568 | 8 (1.4) | 4.77 (2.09–10.88) | <0.001 | 1.58 (0.65 = 3.86) | 0.309 |
| Stage-1 untreated | 457 | 10 (2.2) | 7.47 (3.48–16.05) | <0.001 | 1.75 (0.79 = 3.85) | 0.165 |
| Stage-1 treated | 711 | 22 (3.1) | 10.66 (5.79–19.63) | <0.001 | 1.23 (0.62 = 2.43) | 0.555 |
| Stage-2 untreated | 233 | 28 (12.0) | 45.59 (25.26–82.29) | <0.001 | 3.05 (1.57 = 5.93) | 0.001 |
| Stage-2 treated | 865 | 44 (5.1) | 17.89 (10.49–30.50) | <0.001 | 0.95 (0.51 = 1.79) | 0.880 |
| Age, years | 9,531 | 1.10 (1.09–1.12) | <0.001 | 1.07 (1.05 = 1.09) | < 0.001 | |
| Sex | ||||||
| Male | 4,689 | 63 (1.3) | 1 (ref) | 1 (ref) | .. | |
| Female | 4,842 | 69 (1.4) | 1.06 (0.75–1.49) | 0.734 | 0.86 (0.59 = 1.26) | 0.441 |
| Myocardial infarction | ||||||
| No | 8,612 | 88 (1.0) | 1 (ref) | 1 (ref) | .. | |
| Yes | 919 | 44 (4.8) | 9.09 (6.26–13.20) | <0.001 | 1.76 (1.11 = 2.79) | 0.016 |
| Obesity | ||||||
| No | 7,845 | 27 (0.3) | 1 (ref) | 1 (ref) | .. | |
| Yes | 1,686 | 105 (6.2) | 19.23 (12.56–29.45) | <0.001 | 5.61 (3.55 = 8.88) | < 0.001 |
| Diabetes | ||||||
| No | 8,509 | 43 (0.5) | 1 (ref) | 1 (ref) | .. | |
| Yes | 1,022 | 89 (8.7) | 18.78 (12.97–27.19) | <0.001 | 4.19 (2.74–6.40) | < 0.001 |
[i] Data are n (%) unless otherwise specified. CI = confidence interval. ICU = intensive care unit.
Table 5
Association between 30-day mortality and hypertension subclassified into six blood pressure stages according to JNC8 criteria in COVID-19 patients adjusted for confounders, multivariable logistic regression (n = 9,531).
| AVAILABLE DATA IN THE UNIVARIABLE ANALYSIS N = 9,531 | PATIENTS WHO DIED N = 112 | UNIVARIABLE | MULTIVARIABLE | |||
|---|---|---|---|---|---|---|
| CRUDE ODDS RATIO (95% CI) | P VALUE | ADJUSTED ODDS RATIO (95% CI) | P VALUE | |||
| Arterial Hypertension | ||||||
| Normal | 6,697 | 13 (0.2) | 1 (ref) | 1 (ref) | .. | |
| Elevated | 568 | 8 (1.4) | 7.35 (3.03–17.79) | <0.001 | 2.49 (0.94–6.64) | 0.068 |
| Stage-1 untreated | 457 | 0 | 0 | 0.994 | 0 | 0.992 |
| Stage-1 treated | 711 | 18 (2.5) | 13.35 (6.52–27.37) | <0.001 | 1.25 (0.56–2.81) | 0.590 |
| Stage-2 untreated | 233 | 14 (6.0) | 32.87 (15.27–70.76) | <0.001 | 1.73 (0.74–4.02) | 0.203 |
| Stage-2 treated | 865 | 59 (6.8) | 37.63 (20.55–68.92) | <0.001 | 1.49 (0.75–2.99) | 0.258 |
| Age, years | 9,531 | 1.13 (1.11–1.15) | <0.001 | 1.09 (1.07–1.12) | < 0.001 | |
| Sex | ||||||
| Male | 4,689 | 48 (1.0) | 1 (ref) | 1 (ref) | .. | |
| Female | 4,842 | 64 (1.3) | 1.29 (0.89–1.89) | 0.178 | 0.97 (0.63–1.51) | 0.909 |
| Myocardial infarction | ||||||
| No | 8,612 | 57 (0.7) | 1 (ref) | 1 (ref) | .. | |
| Yes | 919 | 55 (5.9) | 18.01 (12.29–26.38) | <0.001 | 2.68 (1.67–4.31) | < 0.001 |
| Obesity | ||||||
| No | 7,845 | 18 (0.2) | 1 (ref) | 1 (ref) | .. | |
| Yes | 1,686 | 94 (5.6) | 25.68 (15.46–42.63) | <0.001 | 7.18 (4.18–12.44) | < 0.001 |
| Diabetes | ||||||
| No | 8,509 | 31 (0.4) | 1 (ref) | 1 (ref) | .. | |
| Yes | 1,022 | 81 (7.9) | 23.54 (15.48–35.81) | <0.001 | 4.18 (2.58–6.76) | < 0.001 |
[i] Data are n (%) unless otherwise specified. CI = confidence interval.
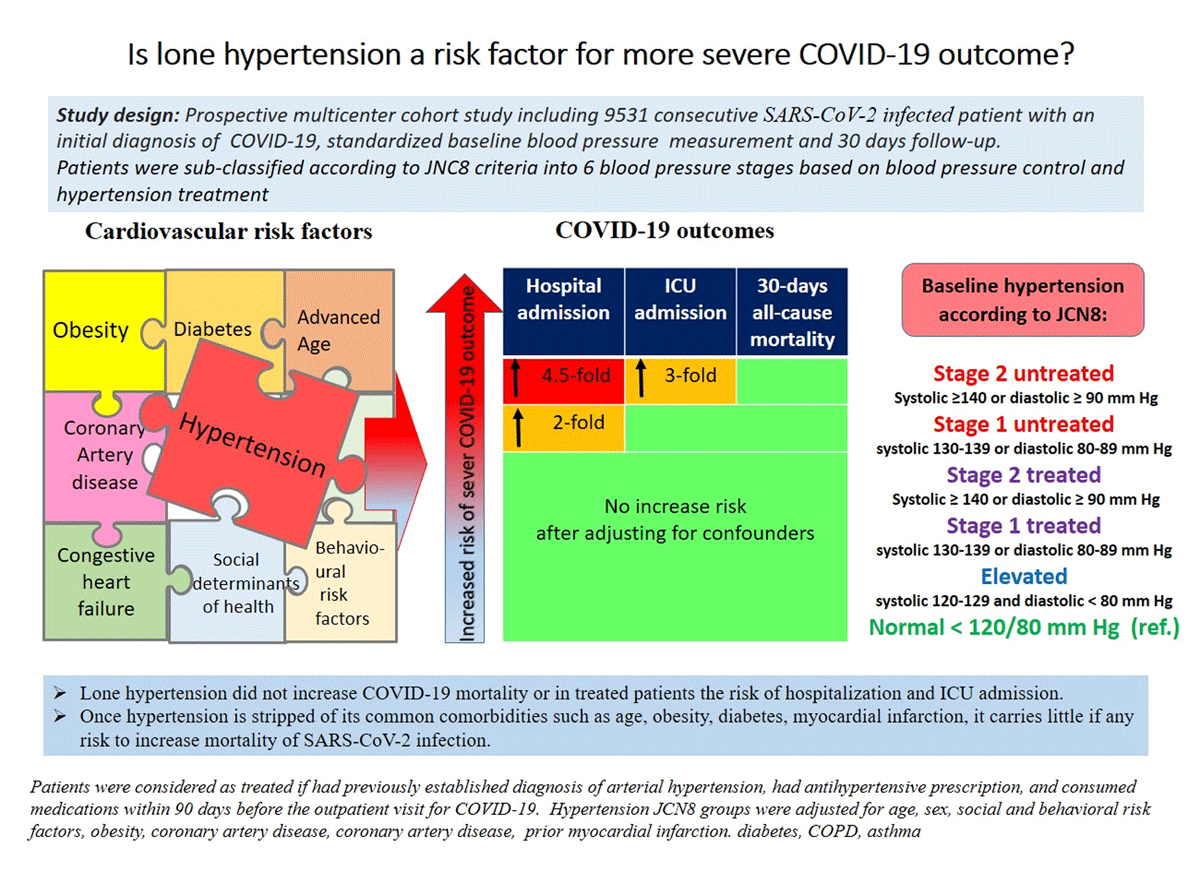
Figure 1
Lone hypertension and more severe course of COVID-19: This central illustration represents a summary of the study design, patients cohort, the study results and the conclusions.