
Table 1
Baseline characteristics of the study population.
| Overall n = 671 | Male n = 324 | Female n = 347 | p-value | |
|---|---|---|---|---|
| Median age (IQR) | 44 (39, 52) | 46 (39, 53) | 43 (38, 52) | 0.022 |
| Median years on antiretroviral therapy (IQR) | 5.9 (4.1, 8.0) | 5.5 (3.8, 7.8) | 6.3 (4.3, 8.2) | 0.007 |
| Antiretroviral therapy regimen, n (%) | ||||
| NNRTI-based | 637 (94.9%) | 310 (95.7%) | 327 (94.2%) | 0.341 |
| PI-based | 33 (4.9%) | 13 (4.0%) | 20 (5.8%) | |
| Missing | 1 (0.2%) | 1 (0.3%) | 0 (0.0%) | |
| Highest level education completed, n (%) | ||||
| Primary school or less | 385 (57.4%) | 169 (52.2%) | 216 (62.2%) | 0.030 |
| Secondary | 193 (28.8%) | 104 (32.1%) | 89 (25.7%) | |
| Beyond secondary | 93 (13.9%) | 51 (15.7%) | 42 (12.1%) | |
| Cigarette smokinga, n (%) | 23 (3.4%) | 23 (7.1%) | 0 (0.0%) | <0.001 |
| Alcohol useb, n (%) | 80 (11.9%) | 69 (21.3%) | 11 (3.2%) | <0.001 |
| Sedentary lifestylec, n (%) | 172 (25.6%) | 105 (32.4%) | 67 (19.3%) | <0.001 |
| Daily added salt to dietd, n (%) | 658 (98.1%) | 316 (97.5%) | 342 (98.6%) | 0.334 |
| Median Body Mass Index kg/m2 (IQR) | 23.2 (20.4, 26.8) | 21.7 (19.8, 24.3) | 25.2 (22, 28.4) | <0.001 |
| Undetectable viral load copies within 12 months of baseline visite (<1,000 copies/mL), n (%) | 281 (95.6%) | 146 (96.7%) | 135 (94.4%) | 0.341 |
| Diabetesf, n (%) | 20 (3.0%) | 8 (2.5%) | 12 (3.5%) | 0.456 |
| Blood pressure at baseline, n (%) | ||||
| <140/90 mm Hg | 416 (62.0%) | 215 (66.4%) | 201 (57.9%) | 0.042 |
| ≥140–159 and/or ≥ 90–99 mm Hg | 144 (21.5%) | 66 (20.4%) | 78 (22.5%) | |
| ≥160 and/or ≥ 100 mm Hg | 111 (16.5%) | 43 (13.3%) | 68 (19.6%) | |
| Taking antihypertensive medication at baseline, n (%) | ||||
| No | 513 (76.5%) | 271 (83.6%) | 242 (69.7%) | <0.001 |
| Yes | 158 (23.5%) | 53 (16.4%) | 105 (30.3%) |
[i] NNRTI: non-nucleoside reverse transcriptase inhibitor (n = 527 efavirenz and n = 110 nevirapine).
PI: protease-inhibitor (n = 1 lopinavir/ritonavir and n = 32 atazanavir/ritonavir).
a Based on self-report of current tobacco smoking, regardless of duration or number of cigarettes per day.
b Alcohol use defined as any ‘yes’ response to survey question ‘Do you drink alcohol?’, regardless of frequency or quantity.
c Sedentary lifestyle defined as spending more than half of the day seated during typical days in the past month.
d Based on self-report of adding salt to food on a daily basis.
e Out of 294 with a viral load recorded.
f Based on self-report.
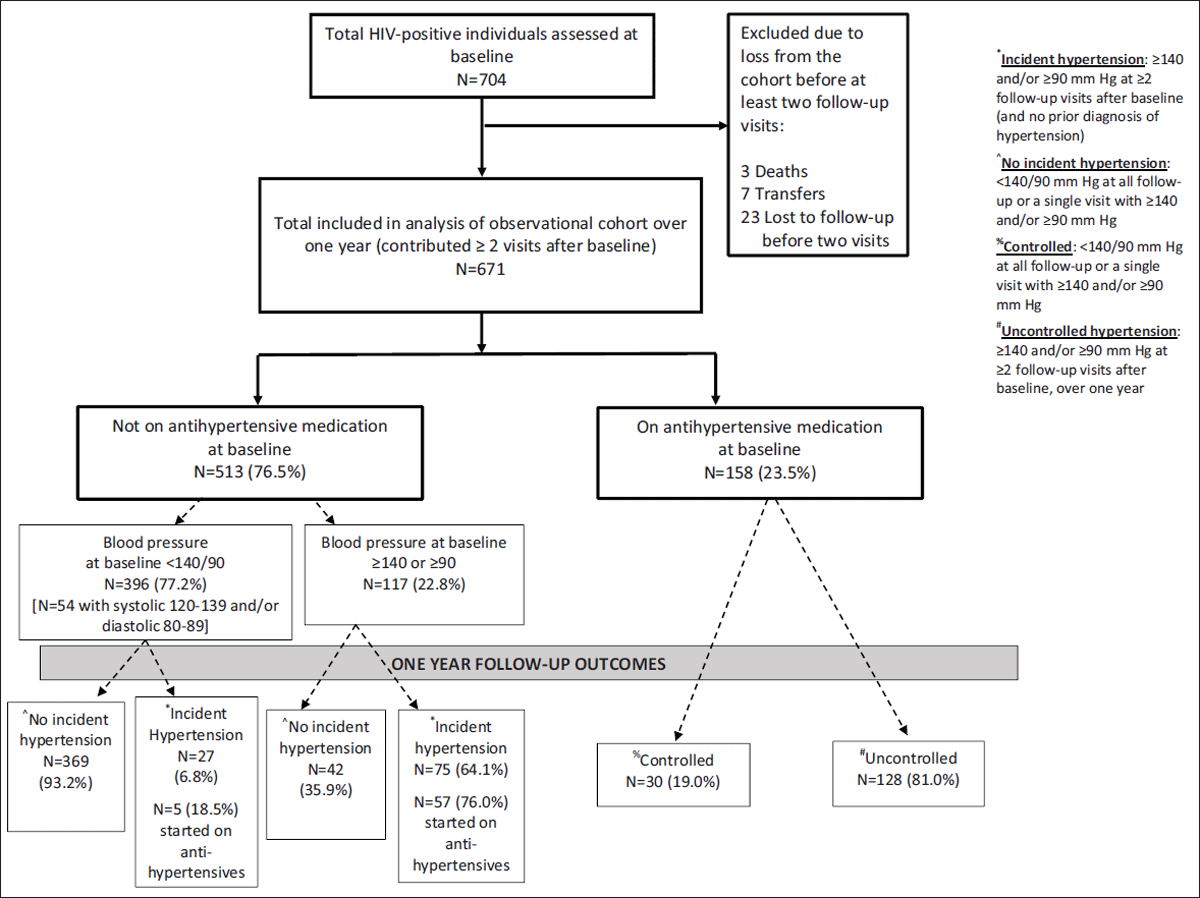
Figure 1
Flow diagram showing participants included in the observational cohort and outcomes from entry to one year of follow-up.
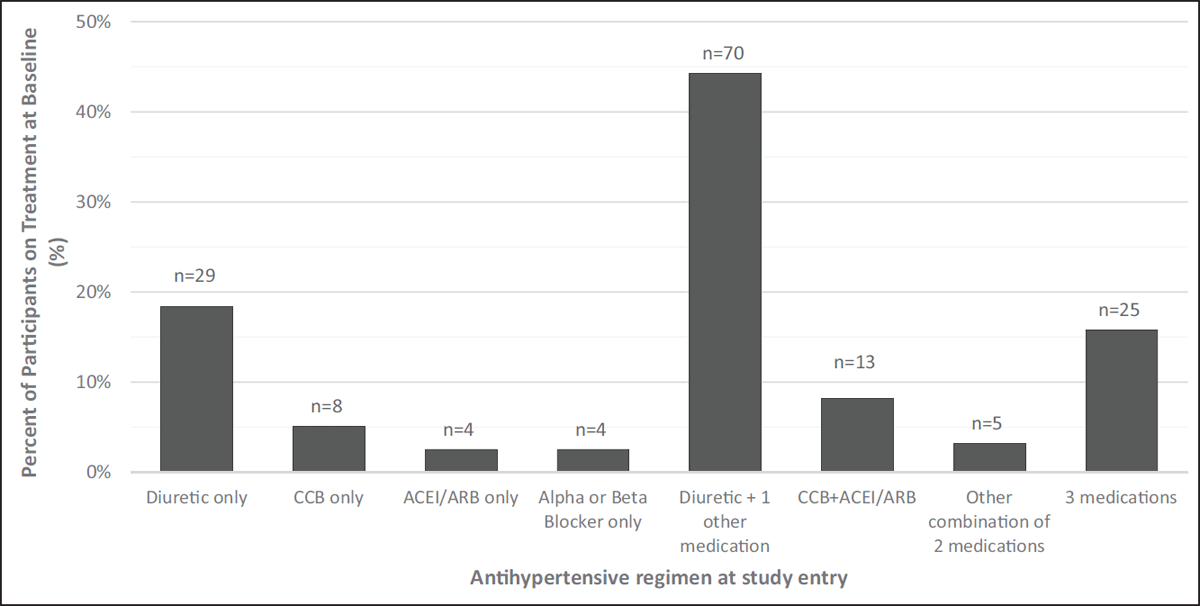
Figure 2
Antihypertensive medications at baseline among participants on treatment (n = 158).
Notes: For patients on a diuretic and one other medication, the other medication was a calcium channel blocker (CCB) for 59% (n = 41); alpha or beta blocker for 26% (n = 18), or an angiotensin-converting enzyme inhibitor (ACEI) or angiotensin receptor blocker (ARB) for 16% (n = 11). Among regimens of three medications, 92% (n = 23) included a diuretic and the most common combinations was a diuretic + CCB + ACEI or ARB (72%, n = 18).
Medications by class included:
Diuretics: hydrochlorothiazide, chlorthalidone
Calcium channel blockers: nifedipine, amlodipine, hydralazine
ACEI/ARB: enalapril, captopril, telmisartan, losartan
Beta blockers and alpha blockers: propranolol, atenolol, methyldopa.
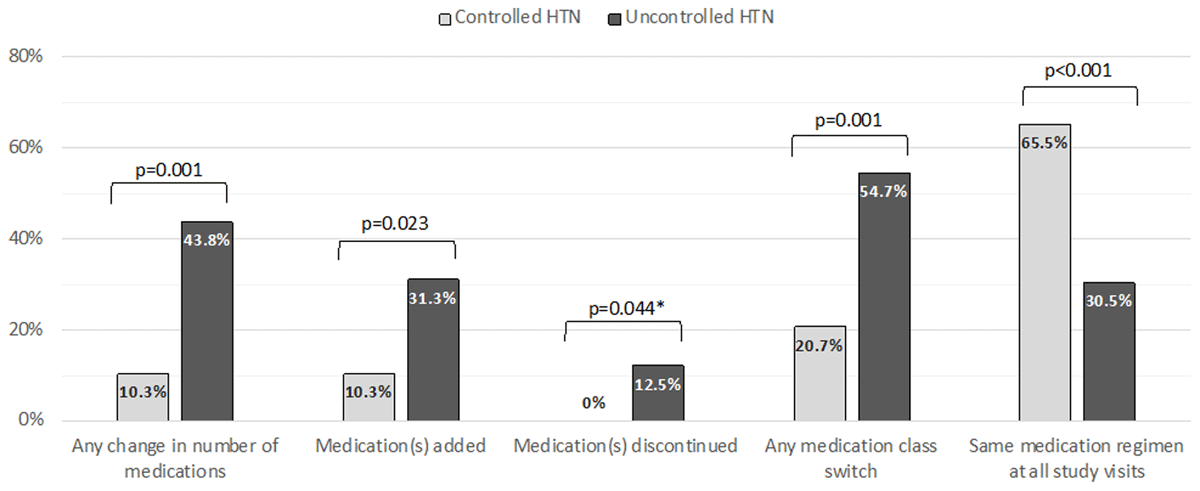
Figure 3
Changes to anthipertensive medications from entry to last visit on study among those on treatment at entry (n = 157).
Note: Data missing one participant. P-values indicate Pearson’s chi-square results or Fisher’s exact test.
Table 2
Antihypertensive medication non-adherence scores* over one year of follow-up among individuals with hypertension on at least one medication at baseline, comparing those with controlled and uncontrolled hypertension.
| Non-adherence score* | Overall** n = 157 | Hypertension | |
|---|---|---|---|
| Controlled^ n = 29 | Uncontrolled& n = 128 | ||
| 0 | 82 (52.2%) | 21 (72.4%) | 61 (47.7%) |
| 0.1–1.0 | 46 (29.3%) | 6 (20.7%) | 40 (31.3%) |
| 1.1–2.0 | 26 (16.6%) | 2 (6.9%) | 24 (18.8%) |
| 2.1–3.0 | 3 (1.9%) | 0 (0.0%) | 3 (2.3%) |
[i] * Higher score indicates higher level of non-adherence. Average weekly adherence to antihypertensive medication since last visit was self-reported at each visit and scored as follows: 0 points for missing medications less than once per week; 1 point for missing medication once per week; 2 points for missing medication two to three times per week; and 3 points for missing medication more than three times per week. Non-adherence score calculated as mean number of points per respondent across all follow-up visits.
** Data from self-reported antihypertensive medication adherence at all visits after baseline; Adherence data missing on 1 participant.
^ Controlled: blood pressure (<140 systolic and <90 mm Hg diastolic) at every visit or with only a single visit with elevated blood pressure above this level during one year of follow-up.
& Uncontrolled: ≥2 visits during the one year of follow-up with a blood pressure ≥140 systolic and/or ≥90 mm Hg diastolic.
Table 3
Summary of side effects reported by individuals on antihypertensive medication at any timepoint during follow-up (n = 99).
| Side Effects | Overall | Female | Male | p-value |
|---|---|---|---|---|
| Any side effect | 99 (45.0%) | 70 (50.7%) | 29 (35.4%) | 0.027 |
| Headache | 61 (27.7%) | 48 (34.8%) | 13 (15.9%) | 0.002 |
| Dizziness | 52 (23.6%) | 41 (29.7%) | 11 (13.4%) | 0.006 |
| Weakness | 42 (19.1%) | 33 (23.9%) | 9 (11.0%) | 0.018 |
| Swelling of legs and/or feet | 19 (8.6%) | 14 (10.1%) | 5 (6.1%) | 0.301 |
| Sexual dysfunction | 6 (2.7%) | 0 (0.0%) | 6 (7.3%) | 0.001 |
| Dry cough | 5 (2.3%) | 4 (2.9%) | 1 (1.2%) | 0.419 |
Table 4
Barriers to adherence to antihypertensive medication reported at baseline among adults with HIV and hypertension in Lilongwe, Malawi (n = 74 reporting any barrier).
| Barrier* | n (%) |
|---|---|
| You do not have enough money to buy the high blood pressure medication. | 43 (58.1%) |
| Remembering to take the medication everyday. | 29 (39.2%) |
| You do not have enough money for transport to and from clinic. | 27 (36.5%) |
| You do not feel sick and do not think you need medications. | 22 (29.7%) |
| It is difficult to take medicine every day because of other duties, such as taking care of children/family household. | 7 (9.5%) |
| You do not have enough time to go to the clinic for follow-up visits and refills. | 6 (8.1%) |
| You wanted to see a traditional healer, pastor, spiritual leader and/or take traditional treatments instead. | 1 (1.4%) |
[i] * Participants could report more than one barrier.
Table 5
Factors associated with uncontrolled blood pressure over one year of follow-up among individuals with hypertension on at least one antihypertensive medication at baseline.
| Overall n = 158 | *Controlled n = 30 | **Uncontrolled n = 128 | p-value | |
|---|---|---|---|---|
| Median age (IQR) | 51.0 (44, 57) | 51.5 (44, 55) | 51.0 (44, 57.5) | 0.838 |
| Female sex, n (%) | 105 (66.5%) | 19 (63.3%) | 86 (67.2%) | 0.687 |
| Median years on antiretroviral therapy (IQR) | 6.9 (4.8, 9.0) | 8.7 (5.4, 9.8) | 6.8 (4.5, 8.9) | 0.094 |
| Highest level education completed, n (%) | ||||
| Primary school or less | 84 (53.2%) | 18 (60.0%) | 66 (51.6%) | 0.645 |
| Secondary | 45 (28.5%) | 8 (26.7%) | 37 (28.9%) | |
| Beyond secondary | 29 (18.4%) | 4 (13.3%) | 25 (19.5%) | |
| Cigarette smokinga, n (%) | 0 (0.0%) | 0 (0.0%) | 0 (0.0%) | n/a |
| Alcohol useb, n (%) | 9 (5.7%) | 0 (0.0%) | 9 (7.0%) | 0.135 |
| Sedentary lifestylec, n (%) | 33 (20.9%) | 5 (16.7%) | 28 (21.9%) | 0.528 |
| Daily added salt to dietd, n (%) | 151 (95.6%) | 29 (96.7%) | 122 (95.3%) | 0.746 |
| Average antihypertensive non-adherence scoree | 0.54 | 0.22 | 0.61 | 0.009 |
| Mean Body Mass Index kg/m2 (IQR) | 25.5 (21.9, 29.4) | 27.1 (22.9, 30.6) | 25.4 (21.1, 29.4) | 0.334 |
| Undetectable viral load copies within 12 months of baseline visit (<1,000 copies/mL), n (%)f | 64 (97.0%) | 11 (100%) | 53 (96.4%) | 0.521 |
| Diabetesg, n (%) | 10 (6.3%) | 2 (6.7%) | 8 (6.3%) | 0.906 |
| Refilled at PIHh, n (%) | 114 (72.2%) | 23 (76.7%) | 91 (71.1%) | 0.540 |
[i] * Controlled: blood pressure (<140 systolic and <90 mm Hg diastolic) at every visit or with only a single visit with elevated blood pressure above this level during one year of follow-up.
** Uncontrolled: ≥2 visits during the one year of follow-up with a blood pressure ≥140 systolic and/or ≥90 mm Hg diastolic.
a Based on self-report of current tobacco smoking, regardless of duration or number of cigarettes per day.
b Alcohol use defined as any ‘yes’ response to survey question ‘Do you drink alcohol?,’ regardless of frequency or quantity.
c Sedentary lifestyle defined as spending more than half of the day seated during typical days in the past month.
d Based on self-report of adding salt to food on a daily basis.
e Higher score indicates a higher level of non-adherence over the one year of follow-up; score can range from 0–3. Average weekly adherence to antihypertensive medication since last visit was self-reported at each visit and scored as follows: 0 points for missing medications less than once per week; 1 point for missing medication once per week; 2 points for missing medication two to three times per week; and 3 points for missing medication more than three times per week. Non-adherence score calculated as mean number of points per respondent across all follow-up visits.
f Among 66 people with recent viral load available.
g Self-reported.
h Refilled ≥1 time at PIH during follow-up (compared to never at PIH).
Table 6
Factors associated with incident hypertension during one year of follow-up^.
| Overall n = 513 | No incident hypertension over one year* n = 411 | Incident hypertension over one year** n = 102 | p-value | |
|---|---|---|---|---|
| Median age (IQR) | 43 (38, 50) | 42 (37, 49) | 46 (40, 54) | <0.001 |
| Female sex, n (%) | 242 (47.2%) | 194 (47.2%) | 48 (47.1%) | 0.979 |
| Median years on antiretroviral therapy (IQR) | 5.6 (3.9, 7.7) | 5.4 (3.8, 7.6) | 6.3 (4.2, 8.0) | 0.083 |
| Highest level education completed, n (%) | ||||
| Primary school or less | 301 (58.7%) | 239 (58.2%) | 62 (60.8%) | 0.162 |
| Secondary | 148 (28.8%) | 125 (30.4%) | 23 (22.5%) | |
| Beyond secondary | 64 (12.5%) | 47 (11.4%) | 17 (16.7%) | |
| Cigarette smokinga, n (%) | 23 (4.5%) | 22 (5.4%) | 1 (1.0%) | 0.056 |
| Alcohol useb, n (%) | 71 (13.8%) | 58 (14.1%) | 13 (12.7%) | 0.720 |
| Sedentary lifestylec, n (%) | 139 (27.1%) | 110 (26.8%) | 29 (28.4%) | 0.735 |
| Daily added salt to dietd, n (%) | 507 (98.8%) | 408 (99.3%) | 99 (97.1%) | 0.063 |
| Mean Body Mass Index kg/m2 (IQR) | 22.6 (20.2, 26.1) | 22.3 (19.9, 25.4) | 25.3 (21.8, 28.7) | <0.001 |
| Undetectable viral load copies within 12 months of baseline visit (<1,000 copies/mL), n (%)e | 217 (95.2%) | 179 (94.2%) | 38 (100%) | 0.128 |
| Diabetesf, n (%) | 10 (1.9%) | 9 (2.2%) | 1 (1.0%) | 0.428 |
[i] ^ Includes all individuals at baseline who were not on antihypertensives (i.e. not known to be hypertensive based on chart review).
* Blood pressure: <140/90 mm Hg at all follow-up or a single visit with ≥140 and/or ≥90 mm Hg.
** Incident hypertension defined as blood pressure ≥140 and/or ≥90 mm Hg at ≥2 follow-up visits after baseline (and no prior known diagnosis of hypertension).
a Based on self-report of current tobacco smoking, regardless of duration or number of cigarettes per day.
b Alcohol use defined as any ‘yes’ response to survey question ‘Do you drink alcohol?,’ regardless of frequency or quantity.
c Sedentary lifestyle defined as spending more than half of the day seated during typical days in the past month.
d Based on self-report of adding salt to food on a daily basis.
e Among 228 people with viral load available.
f Based on self-report.