
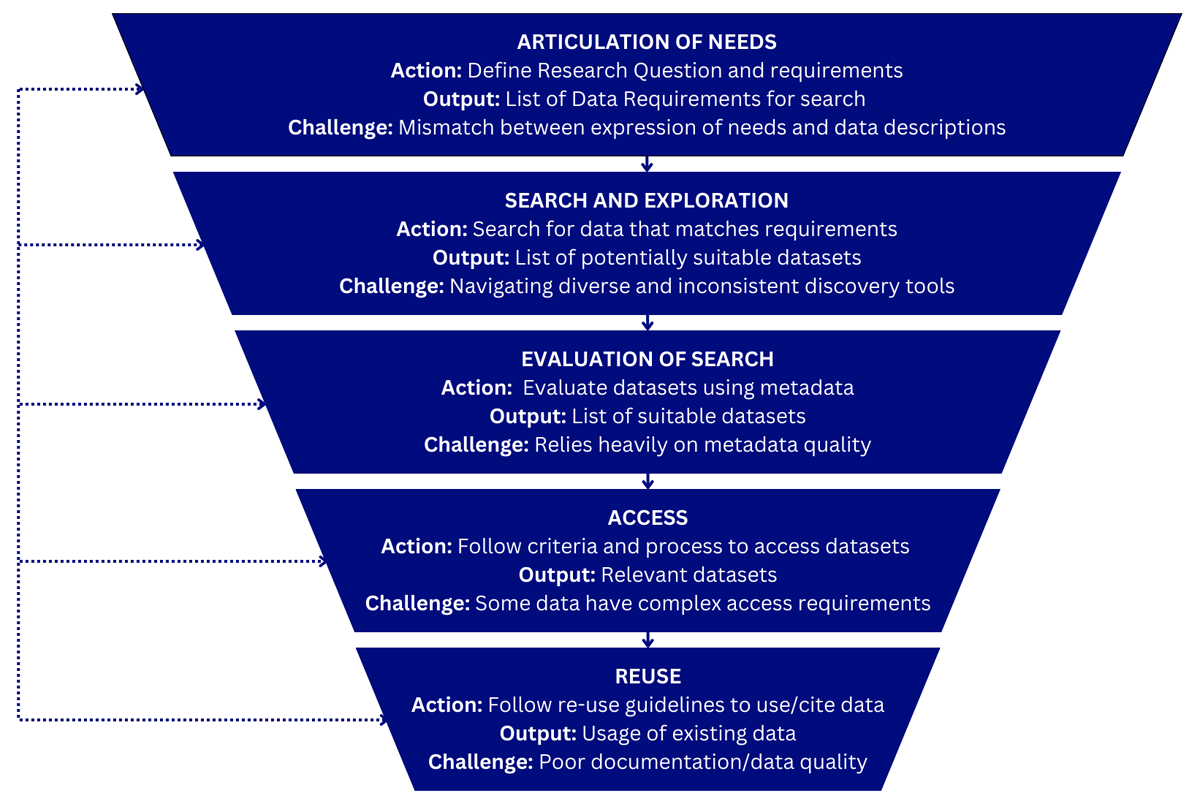
Figure 1
Iterative data discovery journey.
Table 1
Pros and cons of user study methods.
| METHODS | DESCRIPTION | PROS | CONS | EXAMPLE TOOLS |
|---|---|---|---|---|
| Survey | Collect insights on user needs, functional requirements, user background, and satisfaction with a data discovery system (e.g., System Usability Score,2 Khalsa et al., 2018) | Cost-effective, scalable, can reach a large number of users, can collect both quantitative and qualitative data. | Limited to self-reported perceptions, may lack depth, response bias can be an issue. | General: SurveyMonkey, Qualtrics, Google forms, Typeforms, Microsoft Forms |
| Interview | Structured or unstructured conversation with an individual user or a group of users (focus group) (e.g., Liu et al., 2023, Sostek et al., 2024). | Provide in-depth insights into user motivations for a data search and experience with a discovery service, allow for clarification and follow-up questions, useful for exploratory research. | Time-consuming, resource-intensive, findings may not be easily generalizable, requires skilled interviewers and interview data analysis. | Self-developed cheatsheet with interview steps and questions. AI tools can be used to transcript interview recordings and analyse interview transcripts (Wollin-Giering et al., 2024) that need to be verified by researchers. |
| Interaction log analysis | Analysis of search logs that captures user interactions with a system, allowing the analysis of search patterns, quality of relevance ranking, query and click behaviours, etc. (e.g., Kacprzak et al., 2018; Sharifpour et al., 2023) | Captures actual user behaviour beyond self-reporting, reveals data search patterns and system usage, can be tailored to specific research questions. | Lacks contextual explanations for behaviour, requires technical expertise for analysis, may not capture user motivations or frustrations directly. | Google analytics or Matomo (Quintel and Wilson, 2020) for general web traffic, most visited pages, user activities (e.g., page view, position of clicked search result). Self-coding for advance analysis of targeted investigation/research questions. |
| A/B testing | A/B testing compares two design alternatives to measure user preference and impact. This can be done with low-fidelity wireframes or fully functional systems (Vega-Gorgojo et al., 2016; Löffler et al., 2023). | Provides empirical evidence of design effectiveness, allows for direct comparison of alternatives, and can reach a large number of users. | Requires careful experiment design to ensure validity and avoid bias, can be time and cost-intensive, may not explain why one design performs better. | By randomly directing real users to alternative sites and analyse logs, or in a controlled setting where recruited users testing different designs and provide feedback3 (tools like Crazy Egg and Hotjar can record heatmaps and scroll maps). |
| Observational study | Observing users as they search for data, either in controlled environments or their natural workflow (e.g., Thomas et al., 2021) | Provides direct insights into challenges and pain points reveals unexpected behaviours and pain points. | Resource-intensive (time, personnel), potential for observer bias, user behaviour may be influenced by observation, findings may not be easily generalizable. | Can utilise screen and session recording tools, e.g., Lookback, Silverback, Hotjar, and Crazy Egg (for heatmaps). |
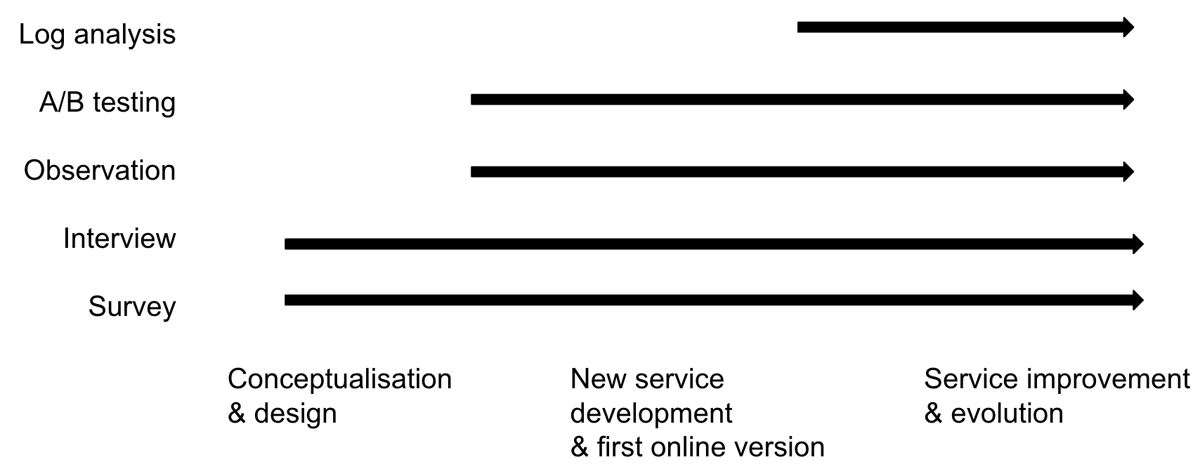
Figure 2
Recommended user study methods at different stages of data discovery service development.
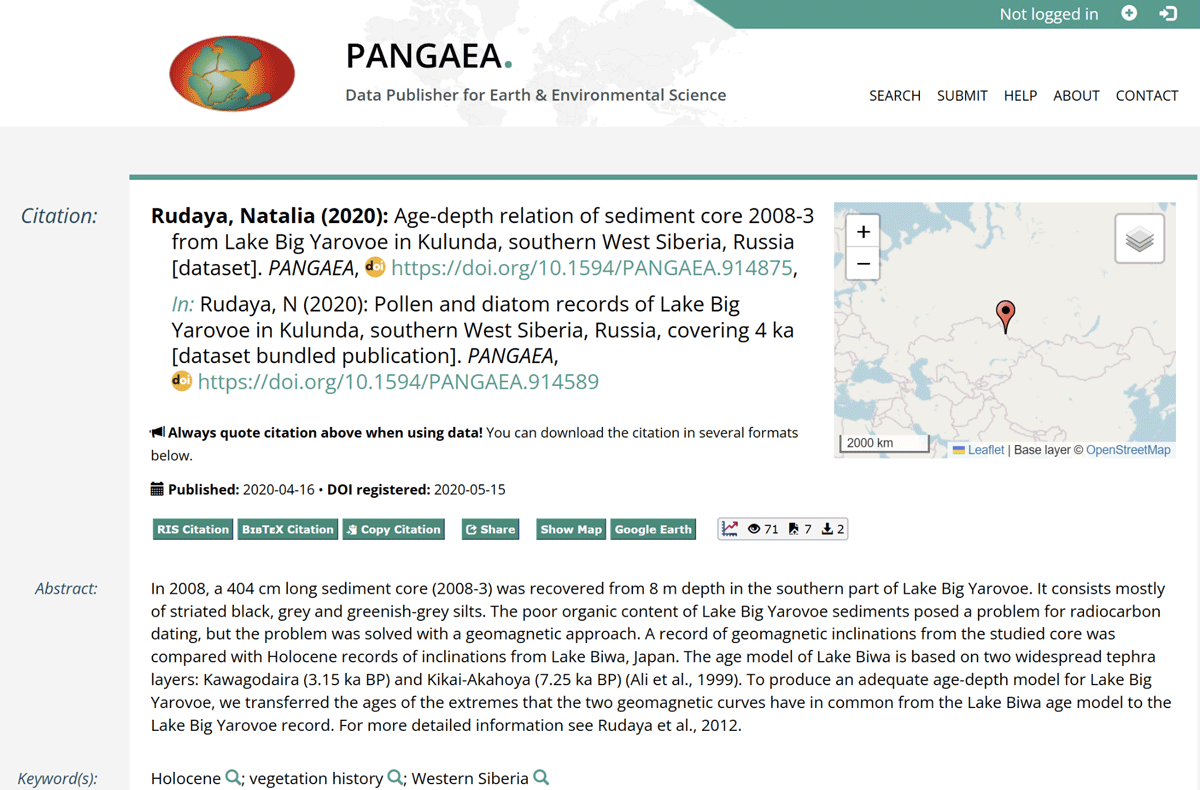
Figure 3
An example of a sub-level dataset which refers to a collection.
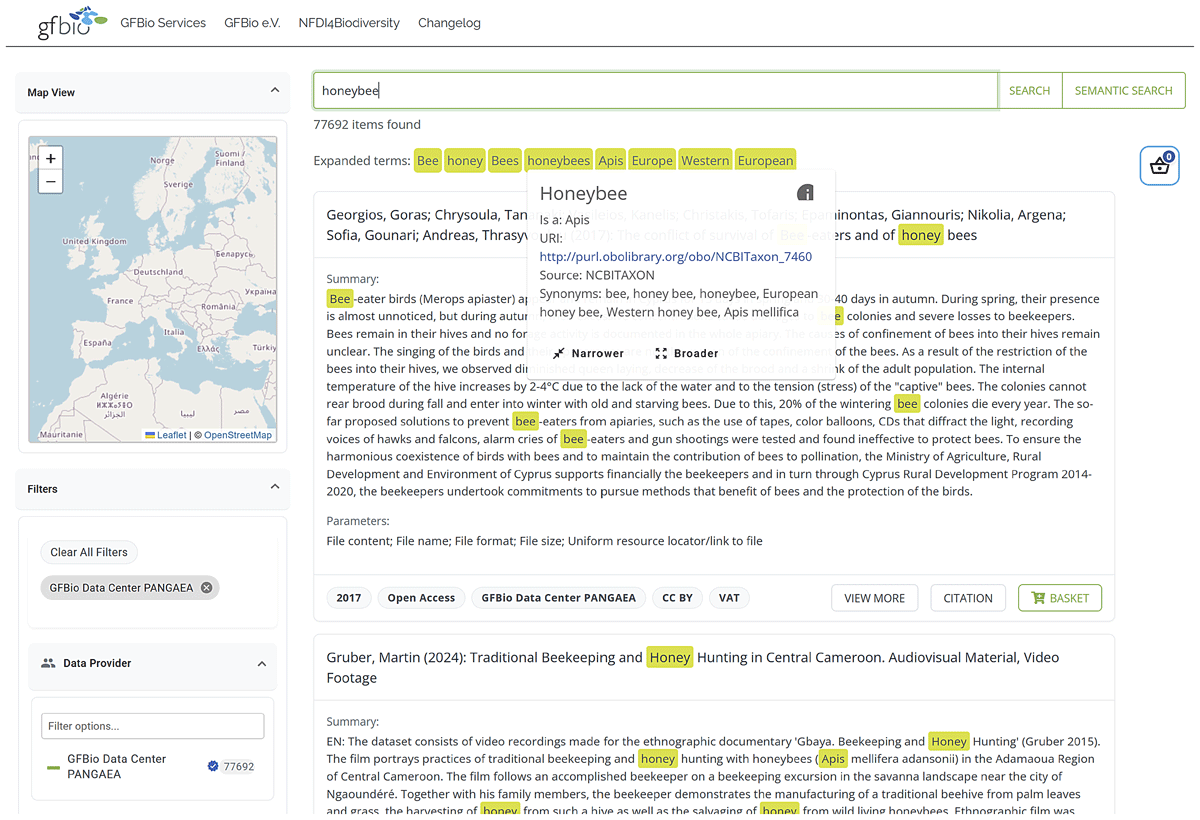
Figure 4
Screenshot of GFBio’s search interface with an expanded search including synonyms obtained from a terminology service.
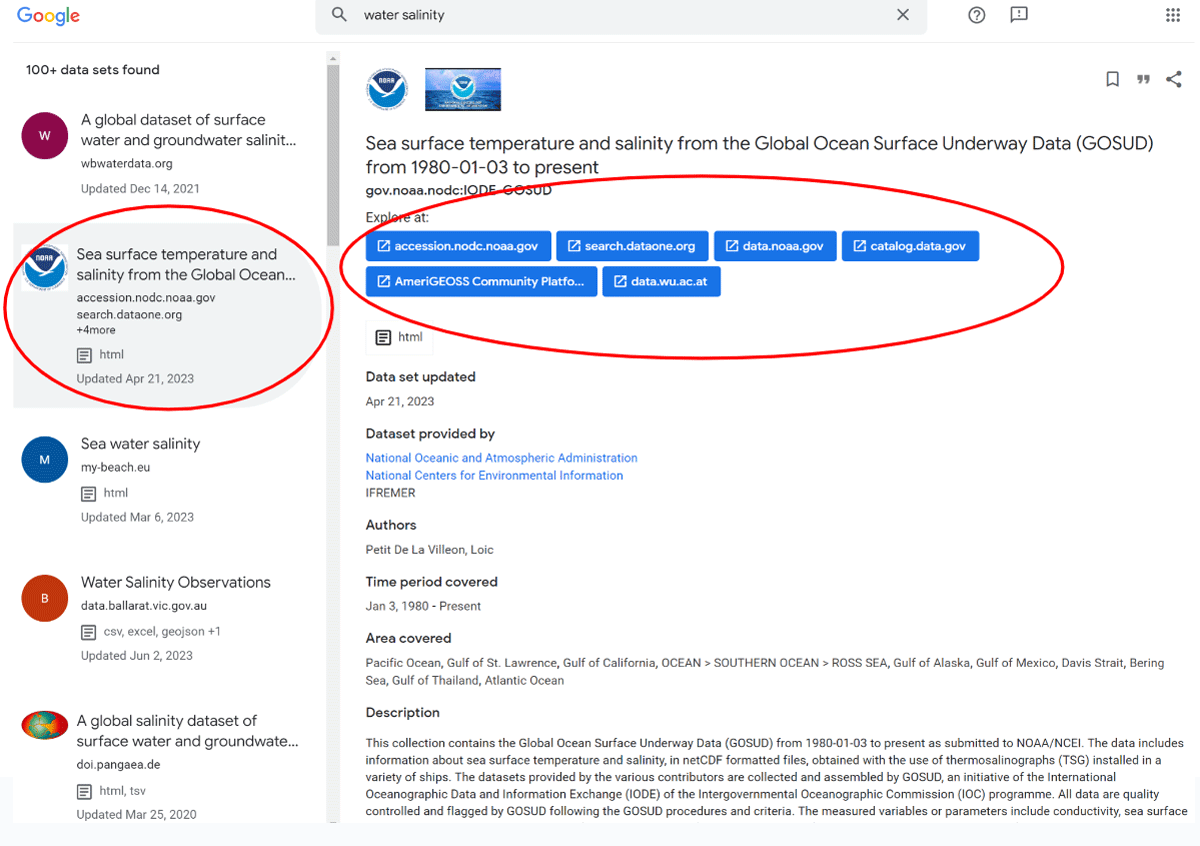
Figure 5
An example of aggregating duplicated metadata records from several data catalogues.