
Introduction
Handling scientific data according to the FAIR principles (Wilkinson et al., 2016; Bahim et al., 2020) and covering all aspects of the data life cycle can be an arduous task when no research data management (RDM) infrastructure is available (Griffin et al., 2018; Welter et al., 2023). One of the most crucial aspects is that at the beginning of the data life cycle, the data is stored in a machine-readable format, which is enhanced with additional information, known as metadata or data about data, describing the object of investigation in a structured way (Willis, Greenberg and White, 2012; Edwards et al., 2011; Pinoli et al., 2019; Ghiringhelli et al., 2023; Leipzig et al., 2021). By meeting these requirements, the data becomes more FAIR for further usage in databases (repositories) and research data workflows (Yano et al., 2022; Ghiringhelli et al., 2023; Leipzig et al., 2021). Electronic lab notebooks (ELNs) are suggested to simplify storing the data accordingly (Higgins, Nogiwa-Valdez and Stevens, 2022; Vandendorpe et al., 2024; Machina and Wild, 2013; Kanza et al., 2017). However, ELNs are often not readily available due to the complex decision-making on their implementation, resources needed to set up the system, and domain-specific RDM experts being unavailable (Higgins, Nogiwa-Valdez and Stevens, 2022; Vandendorpe et al., 2024; Machina and Wild, 2013). Even when an ELN is available, it might not be generally suitable for everyone and applicable to every experiment. For example, limitations can arise from the inhomogeneity of data recorded at a single institution, i.e., data often exists in different formats, ranging from single values (observable at a specific time) to time series data (change of an observable with time), images (such as microscope images), or surveys. Each data set may have different requirements regarding storage, evaluation, and description (Higgins, Nogiwa-Valdez and Stevens, 2022; Vandendorpe et al., 2024; Machina and Wild, 2013). Furthermore, the investigated systems are often highly inhomogeneous, i.e., standards for data storage and annotation might not exist, and if they exist, they are often very specific to a certain system or domain. Thus, the available ELN solutions are often not suitable (Higgins, Nogiwa-Valdez and Stevens, 2022; Vandendorpe et al., 2024; Machina and Wild, 2013). Finally, new researchers, e.g., freshly graduated students, usually lack the necessary skills and (domain) knowledge (RDM or programming) to develop a solid and sustainable RDM infrastructure (Whitmire, 2015; Molloy and Snow, 2012).
In this work, we present a lightweight approach for handling data on the file system level, which can be adapted locally on the individual user’s workstation, including automatic annotation of research data with metadata in a data-interchange format (here YAML) that is both human- and machine-readable. We then bundle data and metadata in a frictionless Data Package, an open standard data container1 that simplifies exploration, evaluation, validation, and definition of workflows (Jejkal et al., 2022), rendering the data already FAIR on the file system level.
The Python-based unitpackage application programming interface (API) (Engstfeld et al., 2024) plays a central role in simplifying the creation of Data Packages and their exploration by extending the frictionless framework (Karev et al., 2024). In some cases, data is only available from figures, such as in old publications. We briefly present svgdigitizer (Engstfeld et al., 2023), which extracts data from such figures and writes frictionless Data Packages that can be explored using the unitpackage API. Examples of further usage of Data Packages created with our approach include defining a domain-specific metadata schema to annotate the data, turning a collection of Data Packages into a simple database on the file system, which can be explored interactively in, i.e., Jupyter Notebooks. The workflow from storing to exploring data is illustrated for tabular (time-series) data stored as plain-text CSV (comma-separated values) commonly recorded in the laboratory. Applications of such well-annotated data are illustrated for data from the research area of electrochemistry, for which the community has not settled on a standard yet.
In total, our approach does not require a complex RDM infrastructure but only fundamental skills in Python programming. We will discuss how our approach to storing annotated data automatically in the files system will allow the creation of documentation of the data, provide easy access to the data, and improve interoperability for further use in more complex workflows (Jejkal et al., 2022) or ELN solutions.
Results and Discussion
In the first section, we discuss the fundamental requirements for storing data for our workflow, namely file naming conventions and data exchange formats, and present simple ways to annotate data automatically with metadata. The second section demonstrates the potential of storing data in containers using the unitpackage API. In the final section, we show how data following a metadata schema can be used in more complex workflows, allowing for direct comparison between literature data and local data using the same infrastructure.
Data Preparation
File Naming Conventions
When storing experimental data, filenames are still commonly used to store metadata, such as the date, time, user, sample name, or system-specific information such as concentrations, starting weight, or temperature. While this approach allows for convenient searching with file system tools, limitations in file names (length and allowed character set) typically lead to heavy usage of acronyms. The acronyms used are then often only known to the experimentalist who recorded the data. While adopting a file naming convention (the RDM-kit elixir authors) used by the peers in the laboratory would mitigate this issue, sharing such data beyond the boundaries of the laboratory is hard, and processing such metadata in a robust way automatically is virtually impossible. For the approach presented in this work, filenames do not really matter. They only must be unique because they will be used as the unique identifier for the underlying data. Nonetheless, including minimum information in the filename can help organise files in the file system.
Metadata Files, Templates, and Schemas
Instead of trying to squeeze additional descriptive information about the data (metadata) in the length-limited filename, the header or the footer of the data file itself, a piece of paper, or another unstructured text file, it is far more beneficial to store this information in a data exchange format such as YAML (Ben-Kiki, Evans and döt Net, 2001), JSON (Crockford, 2006), or XML (W3C, 1998). An example set of metadata is shown for all three file formats in Figure 1. For simple metadata files, these formats are interchangeable by various converters. Creating these files does not require any additional software but can simply be written with any kind of text editor. Preferably, these editors support syntax highlighting, for example, highlighting key-value pairs with different colors (see Figure 1b). From a practical perspective, YAML is presumably the most human-readable and, hence, accessible format. In addition, YAML can contain comments as inline annotations (starting with a #). This is specifically relevant to the creation of instructive templates for other users.

Figure 1
An example set of metadata presented in different data exchange formats, i.e., a) YAML, b) JSON, and c) XML, storing metadata in key-value pairs, illustrating the complexity of the respective format’s syntax and highlighting the human readability of YAML.
In contrast to the file name, the metadata files can now contain an almost limitless amount of information in a structured way on the investigated system, the data itself, the operator, or technical details on the experimental setup. A sample YAML file for an electrochemical measurement, which can be adapted to other types of measurements, can be found in the supporting material (see Data Availability Statement). In principle, the desired file with default values is saved in the file system in a, let’s say, template folder, which can be reused for annotating files (see below), and only specific values must be changed. Once the metadata structure has matured and the workflow for data acquisition and evaluation is refined (see below), a metadata schema, such as a JSON Schema (Group, 2020), can be derived. The schema defines how a metadata file must be structured and can be used to validate the YAML-formatted metadata while recording data. Furthermore, such schemas help design metadata templates for more complex ELN systems.
Metadata Acquisition
To save time, it is desirable to generate metadata whenever data is created instead of writing metadata manually. This can be achieved by tracking file creation events, i.e., the moment files are written into a folder, for example, by a data acquisition software. We illustrate the approach using the Python watchdog package (the watchdog development team). It provides flexibility in the development phase as it can be tested in a Jupyter environment, as illustrated in the supporting information (see Data Availability Statement). To unambiguously associate the metadata with a specific file, we suggest creating a metadata file with the same name as the recorded file, including the suffix.2 Additional suffixes must be added to declare the content of the metadata file. For example, upon creating a data.csv, a data.csv.meta.yaml is stored.3 When a series of measurements is performed, the user only has to change individual key-value pairs in the template file.
A standalone solution to tag files with metadata employing a graphical user interface (GUI) is desirable for the end-user without programming knowledge. For this purpose, we created autotag-metadata, a PyQt-based standalone application that can be installed and run on the local workstation (Hermann and Engstfeld, 2024). The key components are shown in Figure 2. The program watches for file creation events upon which a YAML file containing the metadata is created from a YAML template. The metadata can also be edited in a separate text editor, allowing for advanced syntax highlighting and schema validation, ensuring the highest quality of the acquired metadata. Furthermore, we are exploring an application created in Jupyter, based on ipywidgets (etiquetado-voila), for use cases requiring more flexibility. These tools are still under development and are currently tailored to the specific needs of our applications. Note that these tools allow for automatic tagging of files and can be used for any file type, such as text files, PDFs, video clips, or vacation images.

Figure 2
a) Snapshot of the graphical user interface of the autotag-metadata program (Hermann and Engstfeld, 2024), which monitors b) the file system for file creation events and tags files with metadata. The program can be coupled with c) external editors, such as VSCodium, which provides syntax highlighting and can be used for validating the metadata against a schema.
Tabular (Time Series) Data – CSV
As mentioned above, data can be very different (single values, tabular data, images, etc.). Here, we focus on tabular (time series) data that are often stored as CSV as shown in Figure 3a (the most popular standard among the delimiter-separated values (DSV) formats). A key issue is that the field names (column names) are often not sufficient or incomplete (missing units) to understand the meaning of the values of each field. Furthermore, from a certain dimension, such as the time t, we cannot infer whether it is a relative or absolute time or whether a temperature T is measured in Kelvin or Celsius. Such information can also be stored in the YAML template, as illustrated in Figure 3b. The structure of the frictionless standard fields (columns) is extended as described below. Note that each field must have a unique name; otherwise, they can not be unambiguously addressed. If several columns share the same name, the names must be converted first. The units should preferably be represented by a string (text) that can be interpreted by a program used in the following data evaluation process. Astropy’s unit notation is leveraged for unitpackage (Robitaille et al., 2013; Astropy Collaboration et al., 2022).

Figure 3
Example content of files for a) time series data stored as a CSV recorded by a user with a specific instrument and b) metadata stored as YAML along with the CSV, for example using autotag-metadata (Hermann and Engstfeld, 2024) (see text for details). The YAML metadata file describes the structure of the CSV in a structured way, here in the keys within figure description.fields, including the units to the column names and a description of the measured values. In addition, the metadata can contain additional information on the CSV, such as the user who recorded the data, the research question describing why the measurement was performed, the instrument used, or the values set at the instrument.
Exploring Data
Once local files are annotated, browsing and filtering by metadata is facilitated for programmatic approaches. For example, dedicated methods allow loading all metadata files in a directory and filtering them for specific keys or values, such as a user or a sample. This aspect is elaborated on in the following section. The code, input files, and resulting output files from the Figures and Listings are provided in the supporting information (see Data Availability Statement).
Data Packages
The files created in the previous section (CSV and YAML) are now transformed into a frictionless Data Package. A simple Data Package consists of a single resource in a JSON (package.json). The structure of the file-based resource data.csv is described in the schema key. Preferably, the resource contains additional information on the fields (such as units and descriptions) and other metadata from the YAML file describing the data (see above). We create Data Packages containing a single resource, denoted as unitpackage. To interact and create such unitpackages, we developed the unitpackage API (Engstfeld et al., 2024), which is based on the frictionless framework. Using the YAML and CSV from Figure 3, a Data Package can be created as follows.

The code will store the CSV and JSON in the specified output directory (outdir). A collection of unitpackages can be loaded with the unitpackage API to browse, explore, modify, or visualize the entries. The unitpackage documentation provides a detailed description and usage examples. Note that we limited the visualization of entries to simple plotly-based plots (Plotly Technologies Inc., 2015), where the modular approach of unitpackage allows for implementing plots with specific properties (see below) or different Python packages, such as matplotlib (Hunter, 2007). Excerpted are some relevant features of unitpackage.
A collection of unitpackages can be loaded from a specific directory, such as the outdir used above.
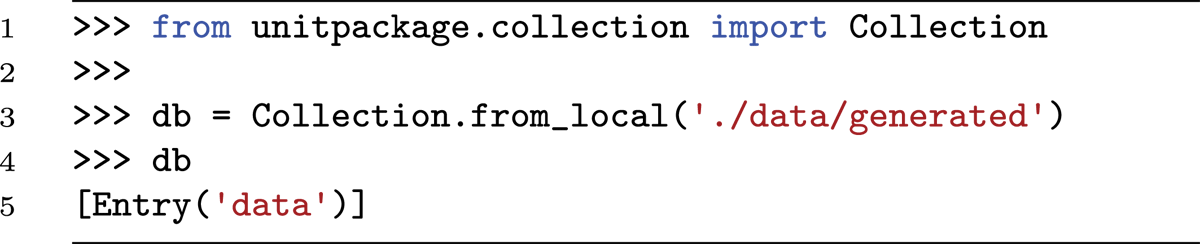
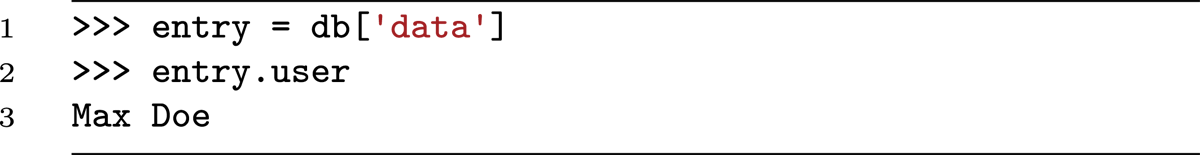
The collection can be filtered to return a new collection based on a predicate in the metadata or boundary conditions defined on the underlying data (see examples in the supporting information provided in the Data Availability Statement). Alternatively, a single entry can be selected by its identifier (lowercase data filename without suffix). The descriptors defined in the YAML are accessible through that entry.
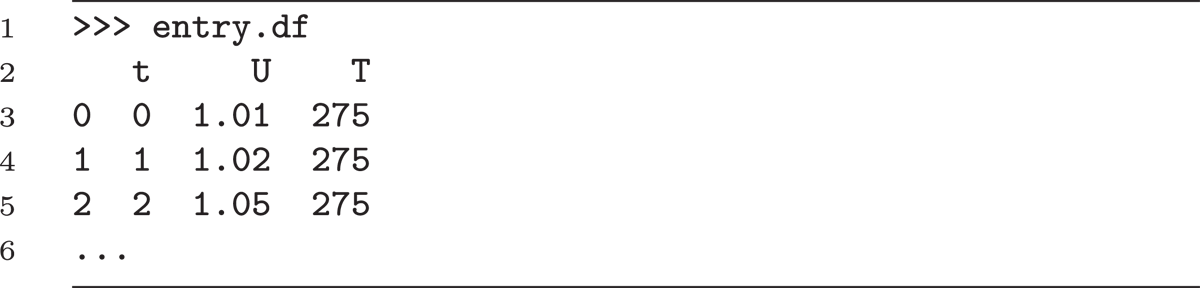
The data from the CSV can be loaded as a pandas DataFrame, one of the very prominent frameworks to work with tabular data (Wes McKinney, 2010; the pandas development team, 2020).
First simple operations with units are implemented.

The metadata and data can now be used in conjunction, for example, to calculate new quantities. In the example data in Figure 3, the resistance of a resistor should be determined when a current is applied to it, and the voltage across the resistor is measured. The resistance can be calculated using Ohm’s law (R = U/I).

Here, I is an astropy quantity. The values in the pandas DataFrame are dimensionless, but the units can be retrieved from the field description to construct an astropy quantity, which allows computing the resistance R, which is also as an astropy quantity object.
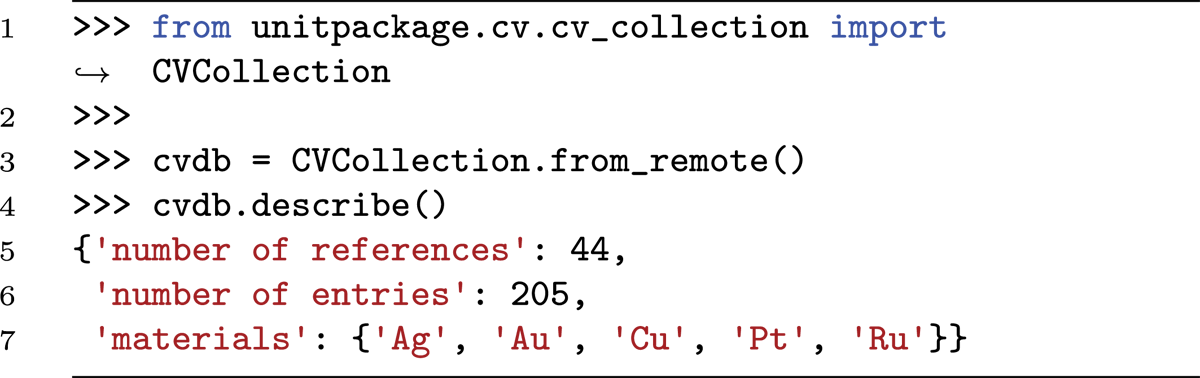
The supporting information provides further examples, illustrating how (i) databases of unitpackages can be filtered for specific properties, (ii) unitpackages can be created from existing data or pandas DataFrames, (iii) collections can be retrieved from remote repositories, containing, for example, supporting data to original works such as in Reference (Engstfeld, 2024; Engstfeld et al., 2024), and (iv) specific classes of entries and databases can be created, which provide, for example, direct access to certain properties such as entry.R.
Standardizing Raw Data
The aforementioned examples showing the usage of the unitpackage API are designed to work with CSV, containing a single header line prepending the lines containing the comma-separated values (according to the W3C recommendation for tabular data). The structure of output data recorded with existing in-house software or software from a proprietary device usually deviates from such an ideal CSV structure. The files usually contain several header lines and/or footer lines, which can vary between measurements with different routines and might as well come in different formats. A detailed discussion on the structure and possibilities of loading such files using the Python clevercsv package can be found elsewhere (van den Burg, Nazábal and Sutton, 2019). For our case, we suggest writing a loader that creates a simple pandas DataFrame with a single header line and using the approach to store the pandas DataFrames as a Data Package with the unitpackage API (see supporting information). The metadata possibly included in the CSV header and footer can be (processed and) included in the metadata of the unitpackage.
Another issue is that the column names for files recorded with different software (controlling different devices) are different for the same type of measurement. For example, the header name for a recorded voltage could be given as U/V, voltage [mV], or volt [W/A]. In that case, it is useful to define an internal standard, such that all files are stored simply using, e.g., U, for the measured voltage. As illustrated above, storing the units in the header name is unnecessary since they are included as metadata in the Data Package resource. Note that only the structure changes in the converted files, and the data is still identical to that in the original files.
Demonstrators
The advantages and use cases of storing data and making metadata machine-readable are illustrated using unitpackages for electrochemistry data, with tools developed by the echemdb community (the echemdb development team). The data pertain to studies on the electrochemical properties of well-defined single-crystal electrodes investigated by a commonly employed technique (cyclic voltammetry). The materials used are very well-defined, and the measurement technique is well-established within the community. Over recent decades, such studies have provided significant fundamental insights, aiding in the understanding of more complex three-dimensional systems found in applied research and practical applications. This makes it an ideal benchmark for comparing experimental data, published figures, and computational results.
Electrochemistry Metadata Schema
To date, schemas to describe electrochemical systems fulfilling our requirements are unavailable. There are, however, a few resources and ontologies describing electrochemical terms in general (Bard, Inzelt and Scholz, 2012; Pingarrón et al., 2020). Also, terms used to describe battery-related systems might be helpful (Clark et al., 2022; Stier and Gold, 2024). Linking the terms of our metadata schema to these ontologies, for example, using JSON-LD (The JSON-LD development team) is envisioned. This aspect is, however, beyond the scope of this work. For further information, the reader is referred to other projects (from different research areas) that use such an approach (Rocca-Serra and Sansone, 2019; Jacob et al., 2020; Blumberg et al., 2021).
Due to the lack of a metadata schema, a schema for electrochemical data was developed using the approach with YAML templates described above (the echemdb development team). The descriptors were defined based on the systems investigated in our laboratory and those reported by other groups. By including data from other research groups, we could identify descriptors that might not have been relevant to our work. Over time, the metadata schemas have been adapted, simplified, and restructured to create generalized objects common for any research area (curation, projects, figure description, and experimental) and system-specific objects, which include our information for electrochemical data. In a final step, a JSON schema was developed (the echemdb development team), which is used to validate the YAML metadata for actual data. An extensive YAML file can be found in the supporting information and Ref. (the echemdb development team).
Literature Data
Scientific results are often compared with and validated against data in scientific publications, but such data is usually only available as a plot in a printed (PDF) version. We developed svgdigitizer, which extracts the data from curves carefully retraced using scalable vector graphics (SVG) (Engstfeld et al., 2023). An outstanding feature of svgdigitizer is that the workflow based on SVG allows for a relatively easy review process of the digitized data with the original PDF file as the only prerequisite. In combination with a YAML file containing the metadata extracted manually from the publication (following the schema for electrochemical data described above), a unitpackage can be created. We collected and stored such YAML and SVG files for electrochemical data in a git repository, which validates the YAML files against a JSON schema (the echemdb development team) and creates unitpackages from all files upon merging pull requests. The output packages are created for specific versions of the metadata schema.
Custom Unitpackage Module
To interact and explore the cyclic voltammetry (CV) data, we added CVEntry and CVCollection to the unitpackage module, with which certain descriptors in the metadata can be accessed more conveniently, or statistics on the collection can be displayed. For displaying the CVs, we adapted the plotly plot interface to return specifically standard plots of type I–E or j–E (or U instead of E). The data can be retrieved from the GitHub repository using the unitpackage API. Storing electrochemical data locally using the same metadata structure allows for direct comparisons between measured and published data.
Displaying and Organizing Collections
The machine-readable experimental or literature collections can, in combination with the unitpackage API, be displayed in an appealing way using web frameworks/technologies for creating static or dynamic websites. The frictionless toolbox offers Livemark for this purpose. To display the electrochemical collection on a website (the echemdb community developers), we used MKDOCS (the MKDOCS development team). On the website, the data is sorted in overview pages based on the material used for the electrodes, as illustrated in a snapshot in Figure 4a. The table contains a thumbnail of the measured curve generated from the CSV and descriptors commonly used to describe the electrochemical system. For each entry, a separate page is generated as illustrated for a single entry in Figure 4b. The page provides information on the entries’ source, the most important descriptors to the community, an interactive plot, and collapsible tabs for the different metadata categories available, extracted and generated from the unitpackage.

Figure 4
Snapshots of an electrochemical database displayed on the echemdb website (the echemdb community developers) generated from frictionless Data Packages, which in turn were inferred from literature data using svgdigitizer (Engstfeld et al., 2023). a) Overview page showing a list of entries with the most relevant selected descriptor relevant to the community from the metadata in the Data Package, including a thumbnail of the data. b) A page of an individual entry reached by clicking on the thumbnail in a), which provides detailed information on the respective entry, summarizing metadata and including an interactive plot. Both pages include links to the original publication.
Most simply, one can explore, organize, evaluate, and describe the data interactively in Jupyter Notebooks. Such notebooks can also be served using web frameworks. One rather straightforward solution is the use of Jupyter Book (Executable Books Community, 2020), and other solutions such as ipywidgets or Solara allow the creation of interactive dashboards. The Jupyter Book interface was used elsewhere to document the workflow described in the first two sections of this work (the echemdb development team). This approach is an optimal solution to create an interactive ELN locally from files in the file system, which can be made available along with a scientific publication.
Conclusion
In this work, we showcase a lightweight approach to annotating data with machine-readable metadata automatically. Converting the annotated files into frictionless Data Packages makes data significantly more FAIR on the file-system level. In this way, the descriptive information for the data remains available when lab notebooks (paper or electronic) are not available. The unitpackage Python API provides an interface for exploring the data for specific properties. Furthermore, it provides a simple, extensible framework for visualizing data using existing Python packages or evaluating data collections, making use of both the values from the actual data and the information in the metadata. The approach might also interest those who want to share their data in an appealing way.
Overall, our file system-based approach running on local workstations can serve as a complementary or interim solution to more complex systems such as ELNs or hosted databases. We are confident that the approach presented here will help raise awareness of structured data and metadata in institutions with little knowledge of this topic.
Data Accessibility Statement
The data supporting the findings of this study are openly available in Zenodo at https://zenodo.org/doi/10.5281/zenodo.13739617 or directly from the GitHub repository at https://github.com/echemdb/manuscript_echemdb_rdm/. The main documentation files from the repository can also be found on the journal’s website, including the getting started section with installation instructions, a simple example to tag files using the watchdog module, more extensive documentation of the unitpackage module, and an extensive example YAML file for laboratory data. All tools provided by the authors were tested on Windows, Linux, and macOS for Python 3.8 to 3.12.
Notes
[1] See HDF5 (Collette et al., 2021), RO-Crate (Soiland-Reyes et al., 2022), and BagIt (Kunze et al., 2018) for other data container formats.
[3] Including the suffix of the data file in the metadata file is mostly relevant when a data acquisition software stores different data types with the same name but different suffixes. An example would be where the acquisition software stores along with the data.csv a data.yaml, which contains information, i.e., on the device used to perform a measurement.
Competing Interests
The authors have no competing interests to declare.