
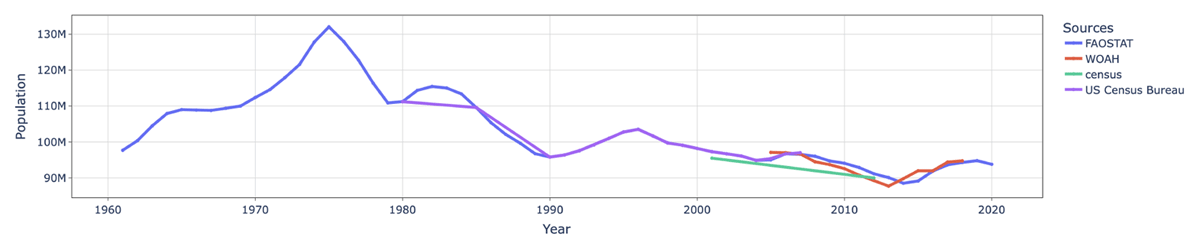
Figure 1
Graph of cattle Populations in the USA between 1960–2020.
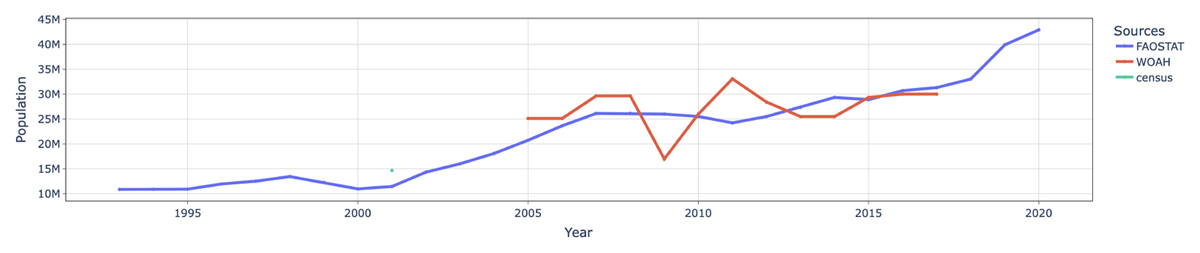
Figure 2
Graph of sheep Populations in Ethiopia between 1993–2017.
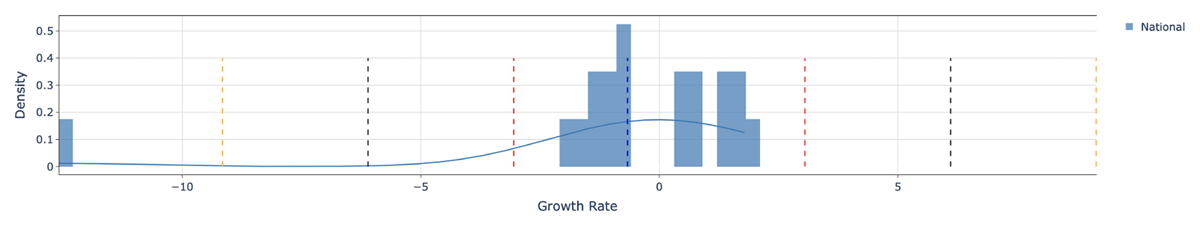
Figure 3
The growth rates for cattle in the USA from USA national data are shown as a histogram with the normal curve superimposed on top. The first STD line is red, the second STD is black, and the third STD is yellow.
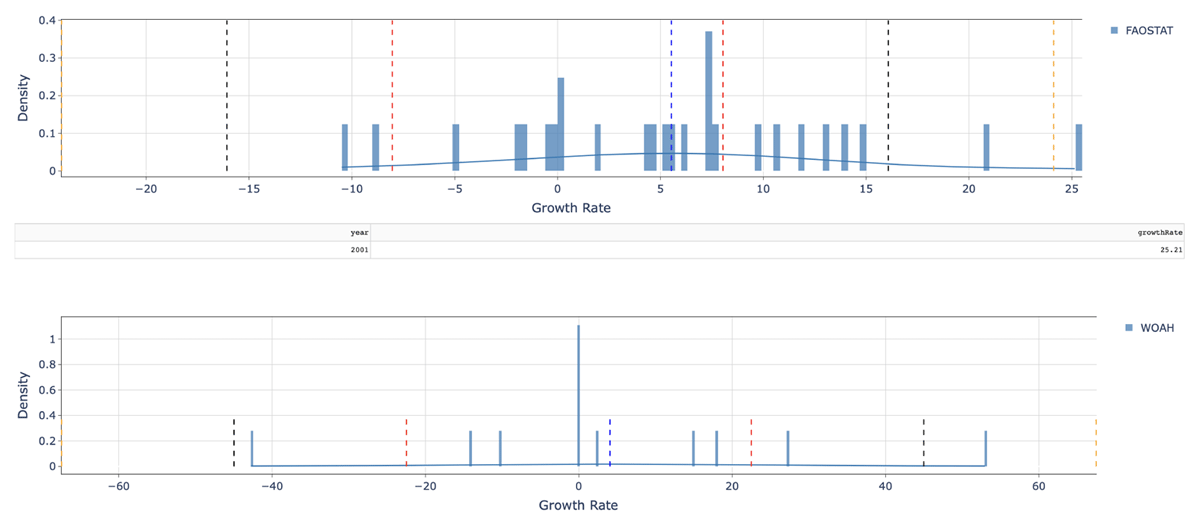
Figure 4
The growth rates for sheep in Ethiopia from FAOSTAT (Top) and WOAH (Bottom) are plotted to normal curves. The first standard deviation line is red, the second standard deviation line is black, and the third standard deviation line is yellow.
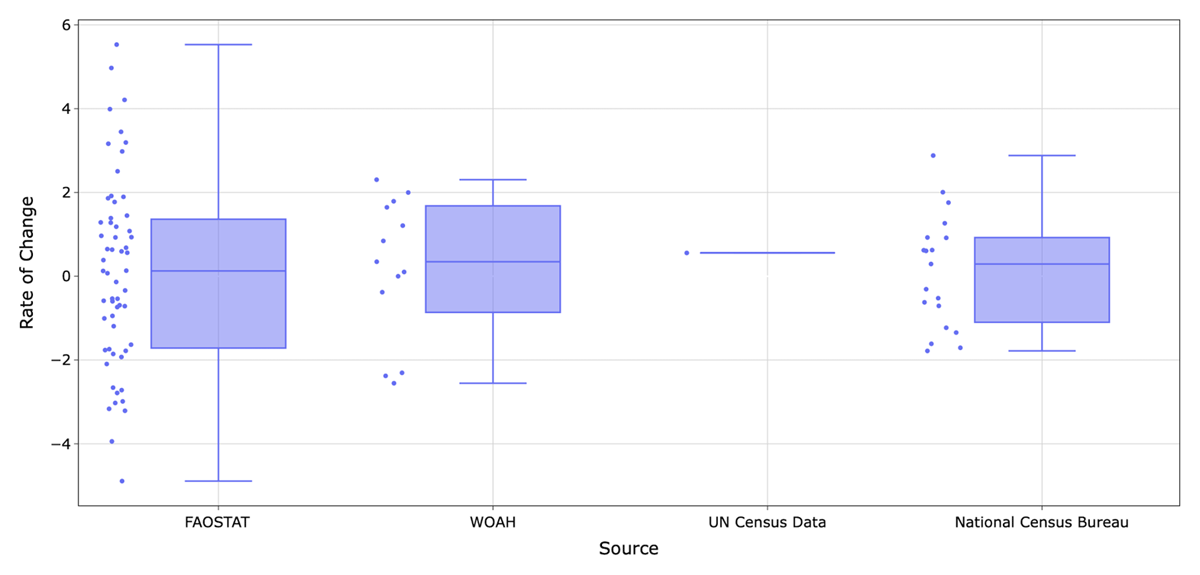
Figure 5
The interquartile ranges for cattle in the United States of America. This shows the interquartile ranges of the yearly rate of change in animal population numbers from the sources FAOSTAT, WOAH, UN Agriculture Census Data, and the National data from the United States. Note that the data from the UN Agriculture Census Data was taken in two different years, 2001 and 2012, so the rate of change was averaged across the 11 years.
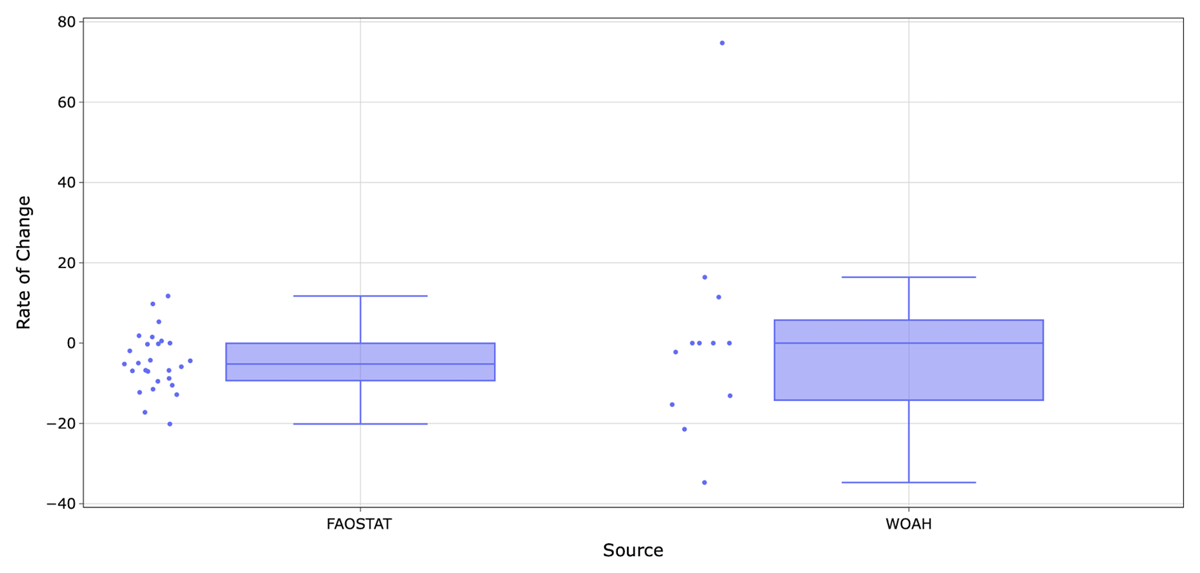
Figure 6
The interquartile ranges for sheep in Ethiopia between 1960 and 2020. Shows the interquartile ranges of the yearly rate of change in animal population numbers from the sources FAOSTAT and WOAH.
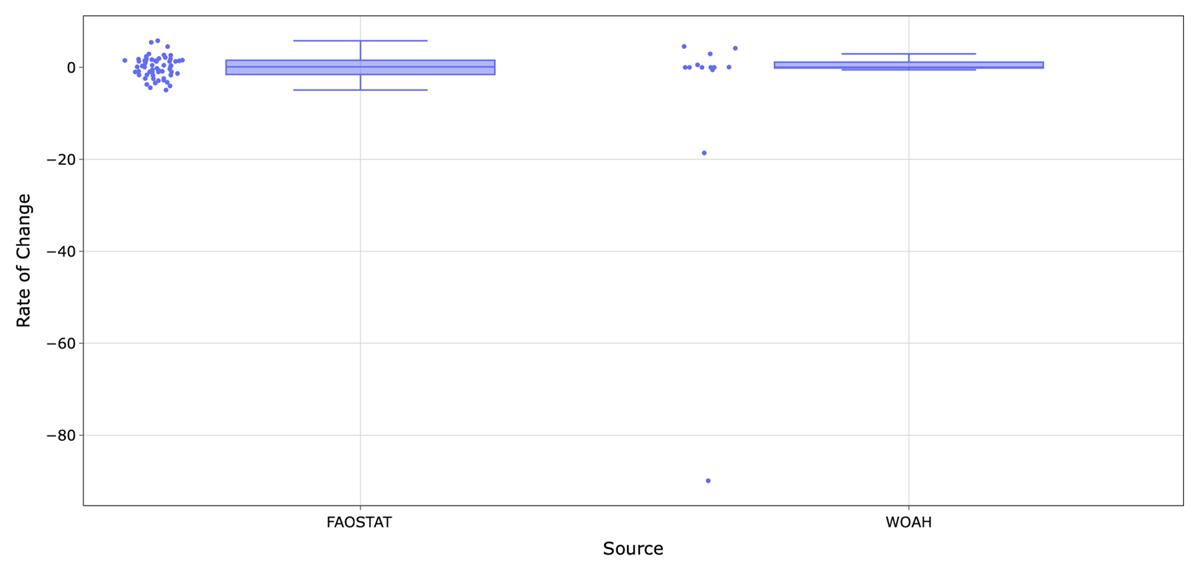
Figure 7
The interquartile range for goats in South Africa. Shows the interquartile ranges of the yearly rate of change in animal population numbers from the sources FAOSTAT and WOAH between 1960 and 2020.
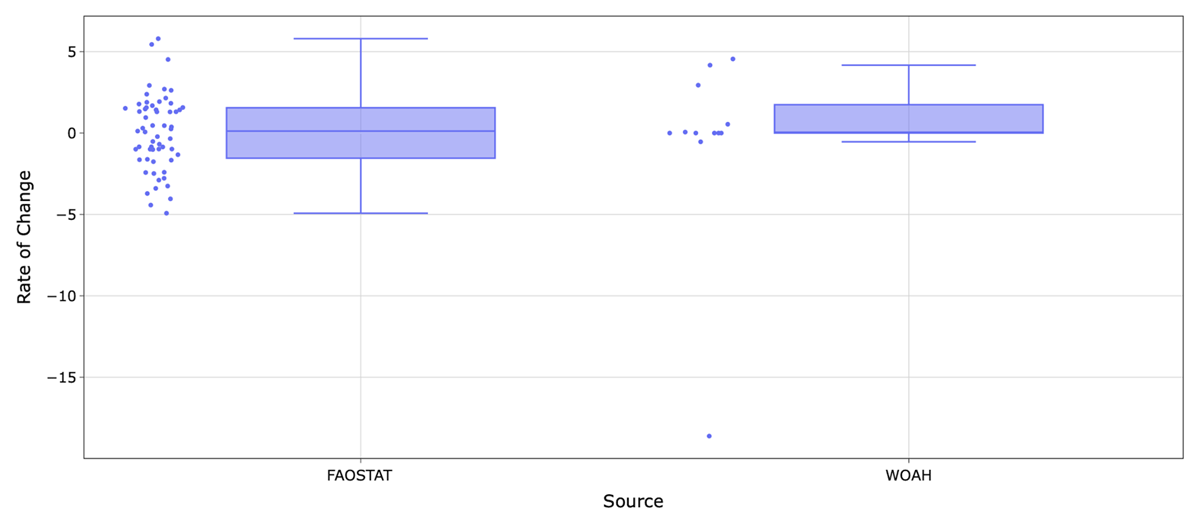
Figure 8
The interquartile ranges for goats in South Africa excluding the outliers.
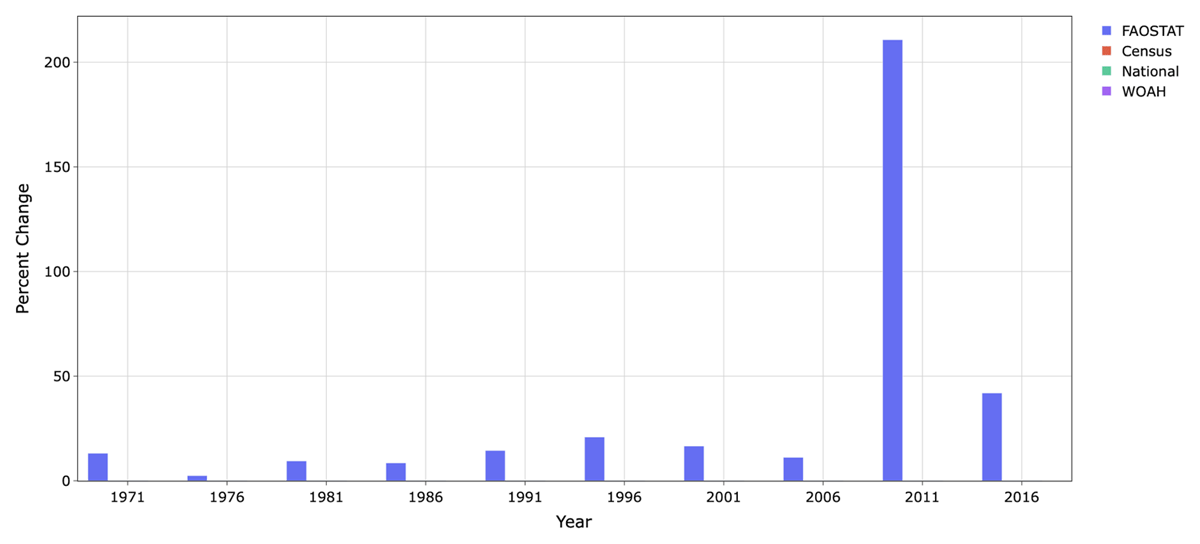
Figure 9
Finding the rate of change between two five-year averages for the chicken population in the United States of America.
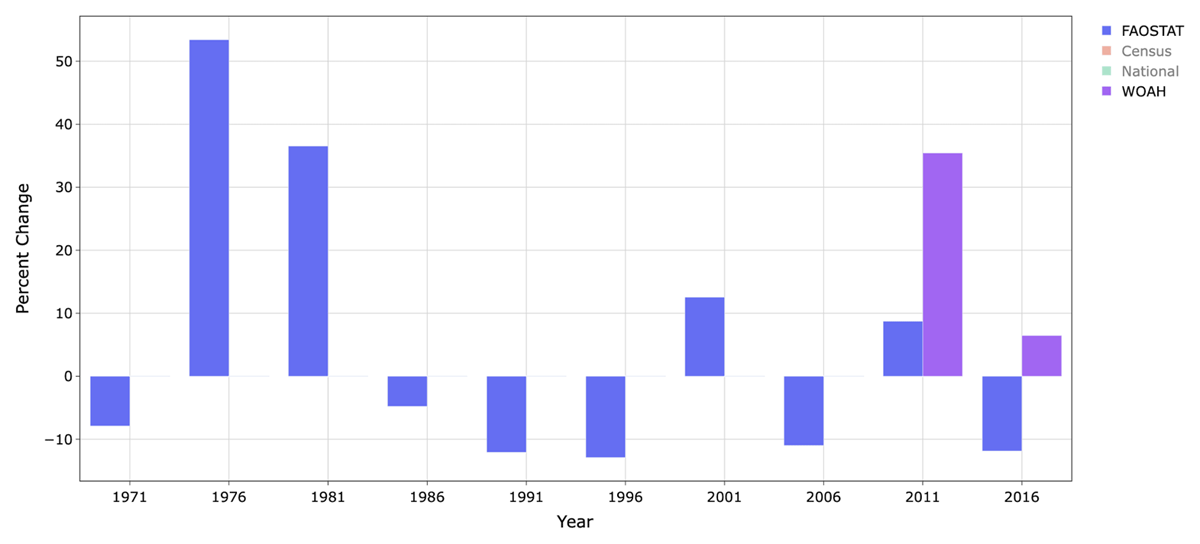
Figure 10
The rate of change between trailing five-year averages for the cattle population in Botswana for the sources FAOSTAT and WOAH.
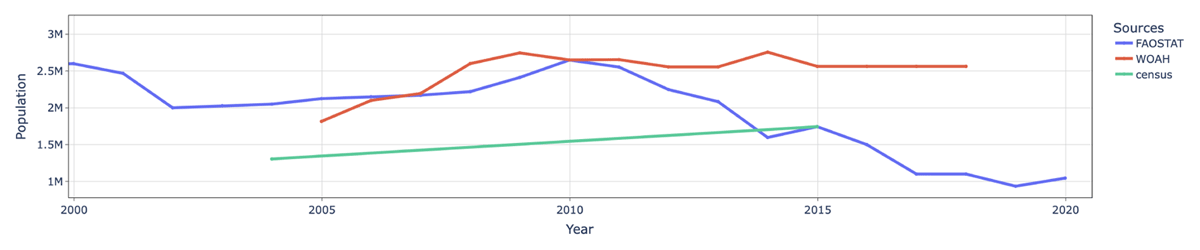
Figure 11
Shows the population of cattle in Botswana between 2000 and 2020 for FAOSTAT, WOAH, and UN Agriculture Census data.
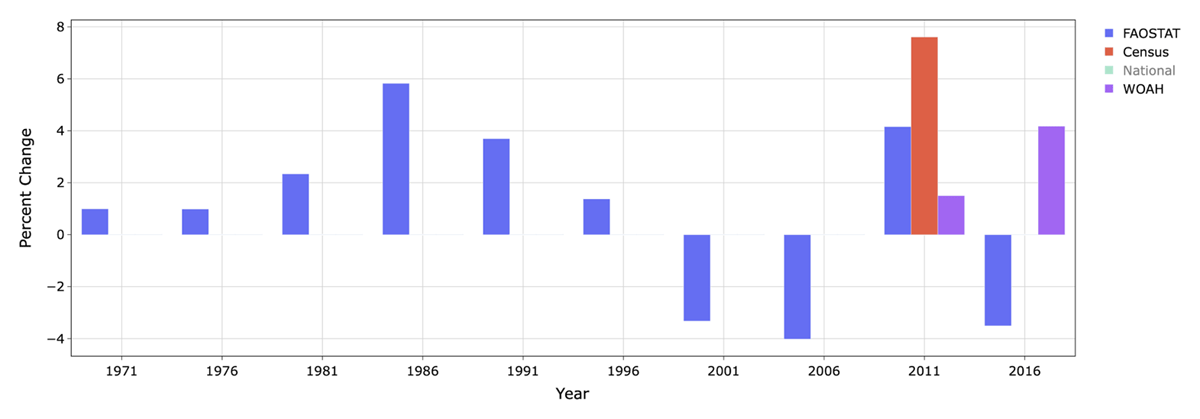
Figure 12
Finding the rate of change between two trailing five-year averages for the cattle population in India.
| DATA SOURCE | TIME | SPECIES | COUNTRY ISO3 | SOURCE | POTENTIAL REASONING |
|---|---|---|---|---|---|
| FAOSTAT | 2008 | Chickens | USA | 5 Year Population Avg | Change in counting method for chickens |
| FAOSTAT | 1970–1980 | Cattle | USA | 5 Year Population Avg and Growth Rates | Reduction in red meat consumption in Americans |
| WOAH | 2009 | Sheep | ETH | IQR | Likely inconsistency in data collection or distribution |
| WOAH | 2006 | Cattle | ARG | IQR | Likely inconsistency in data collection or distribution |
| UN | 2007 | Goats | MEX | IQR | Unknown, likely miss counting given other sources being significantly higher for this year |