
Table 1
Workflow for Dimensions.ai searches on publications referencing major SARS-CoV-2 data repositories.
| REPOSITORY | SEARCH QUERY | COVID-19 RELATED TERMS | ADDITIONAL FILTERS |
|---|---|---|---|
| GISAID | ‘GISAID’ OR ‘EpiCoV’ OR ‘Global initiative on sharing all influenza data’ |
|
|
| NCBI | ‘NCBI Virus’ OR ‘genebank’ OR ‘National Center for Biotechnology Information’ OR ‘Accession: PRJ’ OR ‘International Nucleotide Sequence Database Collaboration’ | ||
| ENA | ‘The Covid-19 Data Portal’ OR ‘European Nucleotide Archive’ OR ‘ENA’ OR ‘Accession: PRJ’ OR ‘International Nucleotide Sequence Database Collaboration’ | ||
| DDBJ | ‘DDBJ’ OR ‘DNA Data Bank of Japan’ OR ‘Accession: PRJ’ OR ‘International Nucleotide Sequence Database Collaboration’ |
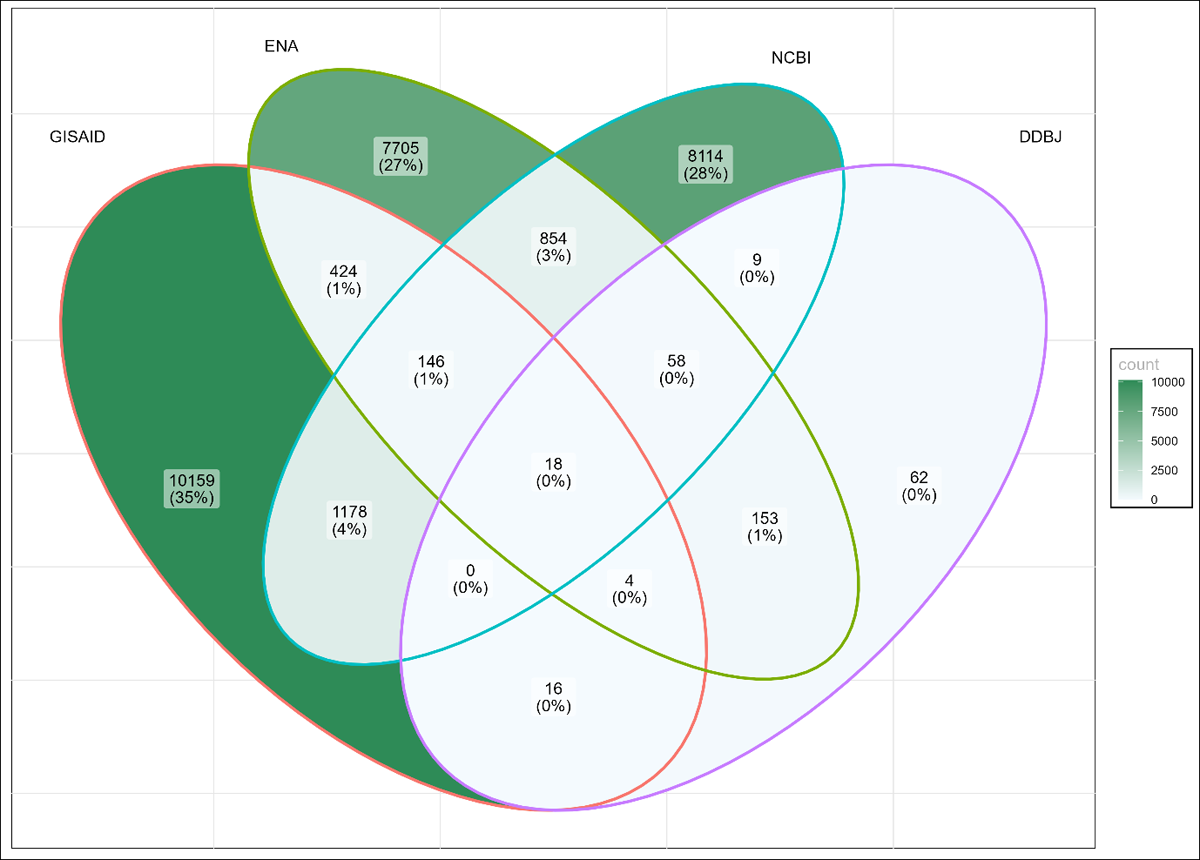
Figure 1
Corpus similarity across major SARS-CoV-2 repositories: Similarity of publication corpuses across major SARS-CoV-2 repositories (January 2020–January 2023). Each oval represents a repository’s corpus with GISAID (red), ENA (green), NCBI (blue) and DDJB (purple). The total number of unique publications are labelled for each overlapping circle as well as the percentage of the entire corpus.
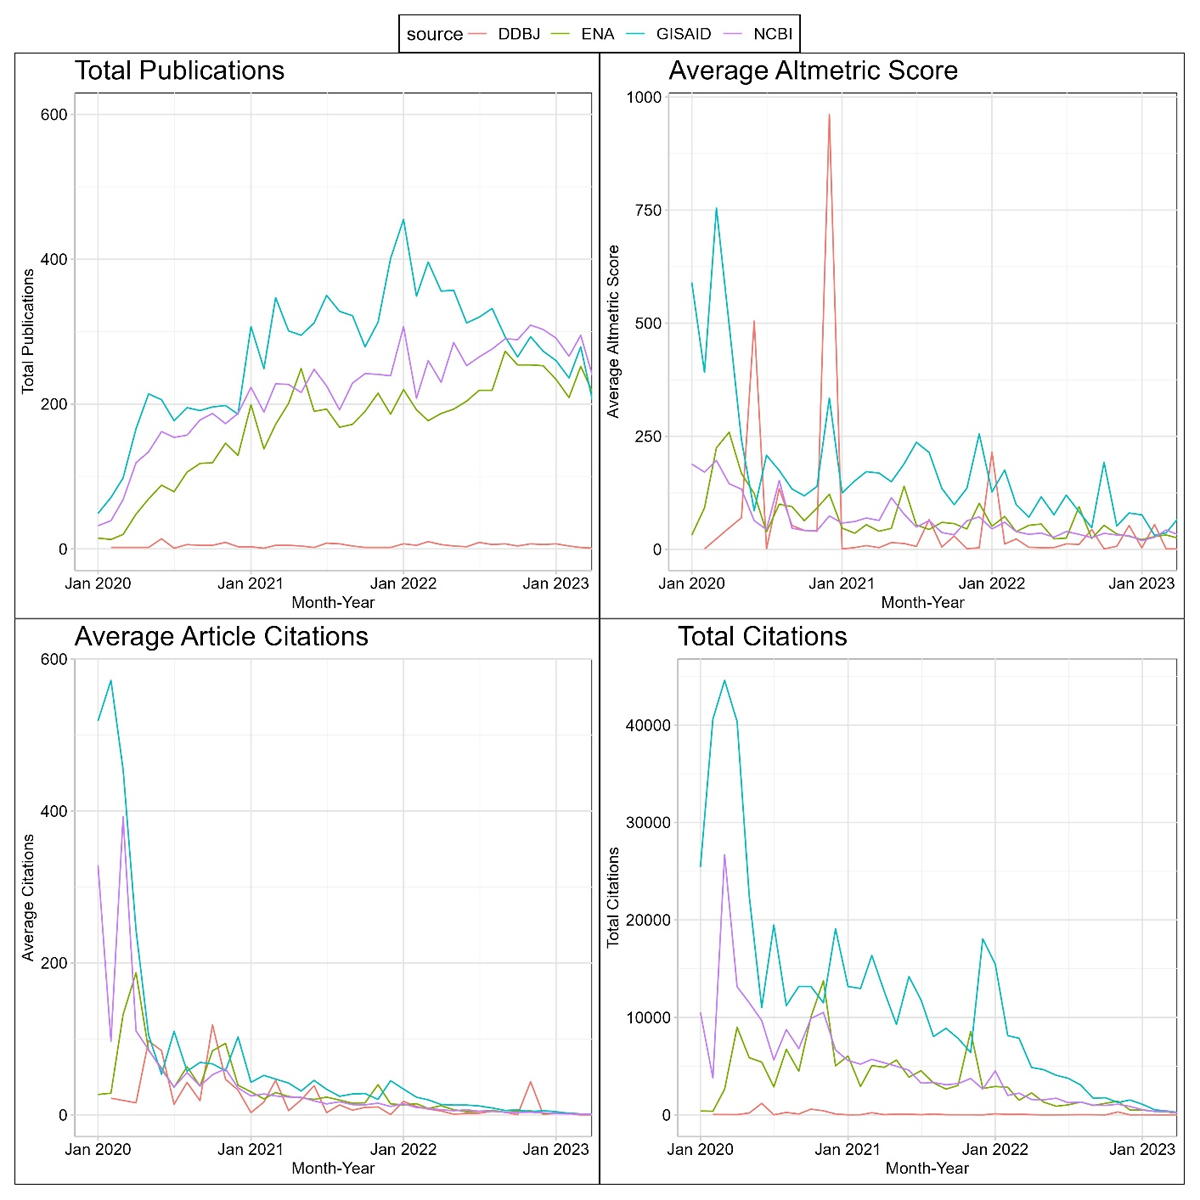
Figure 2
Temporal trends in scholarly metrics across major SARS-CoV-2 repositories. This line graph illustrates longitudinal variations in key bibliometric indicators: (1) Total Number of Publications (top left), (2) Average Citations per Publication (top right), (3) Average Altmetric Score (bottom left) and (4) Cumulative Citation Count (bottom right). Data points span from January 2020 to January 2023. The DNA Data Bank of Japan (DDBJ), National Center for Biotechnology Information (NCBI), European Nucleotide Archive (ENA), and Global Initiative on Sharing All Influenza Data (GISAID) are represented by red, purple, green and aqua blue lines, respectively.
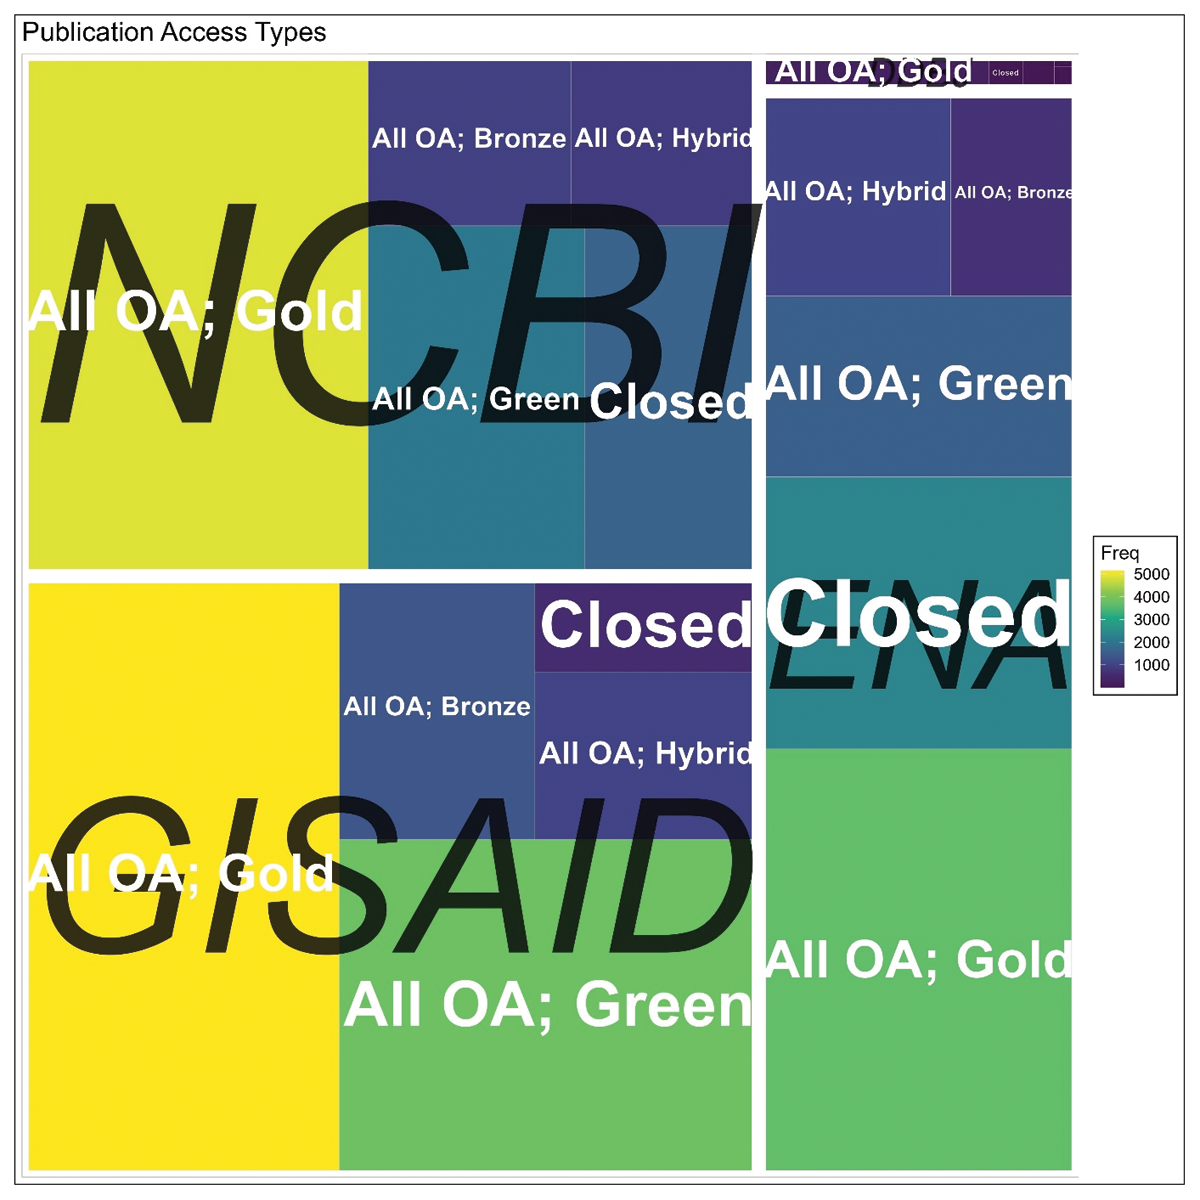
Figure 3
Publication access types across major SARS-CoV-2 repositories. This treemap quantifies the distribution of open access (OA)—Gold, Green, Bronze and Hybrid—and closed access publications across The DNA Data Bank of Japan (DDBJ), National Center for Biotechnology Information (NCBI), European Nucleotide Archive (ENA) and Global Initiative on Sharing All Influenza Data (GISAID). Each rectangle’s area is proportional to the frequency of publications within that category. Databases are delineated by white borders and labelled at their centres in italicised black text. Within each database, access types are labelled in white text.
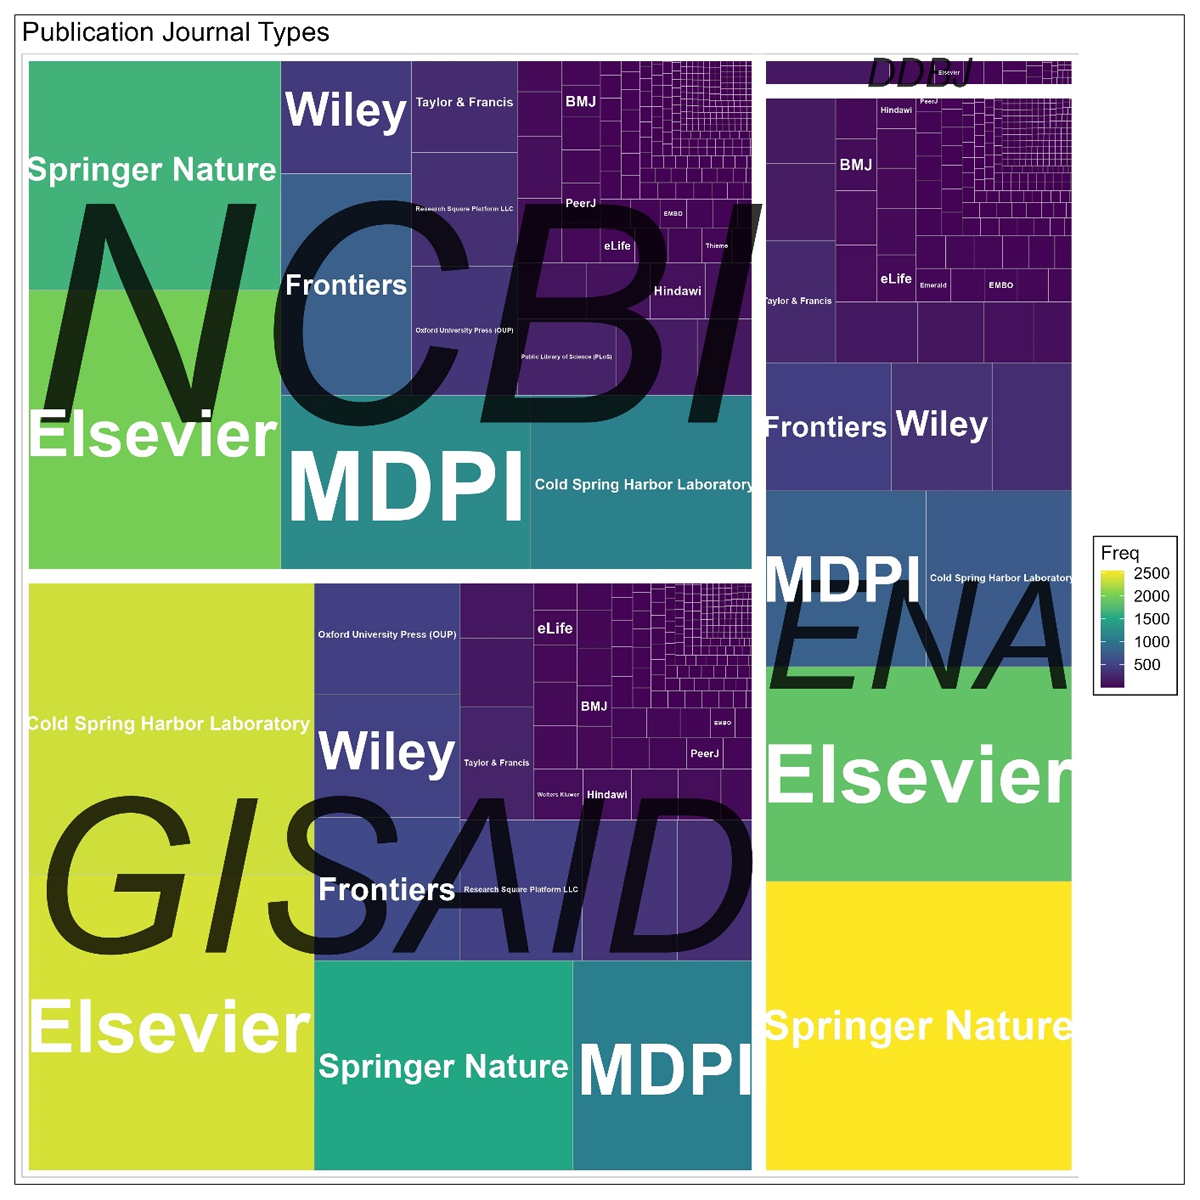
Figure 4
Publisher landscape across major SARS-CoV-2 repositories. This treemap quantifies the distribution of publishers across The DNA Data Bank of Japan (DDBJ), National Center for Biotechnology Information (NCBI), European Nucleotide Archive (ENA) and Global Initiative on Sharing All Influenza Data (GISAID). Each rectangle’s area is proportional to the frequency of publications within that category. Databases are delineated by white borders and labelled at their centres in italicised black text. Within each database, publishers are labelled in white text.
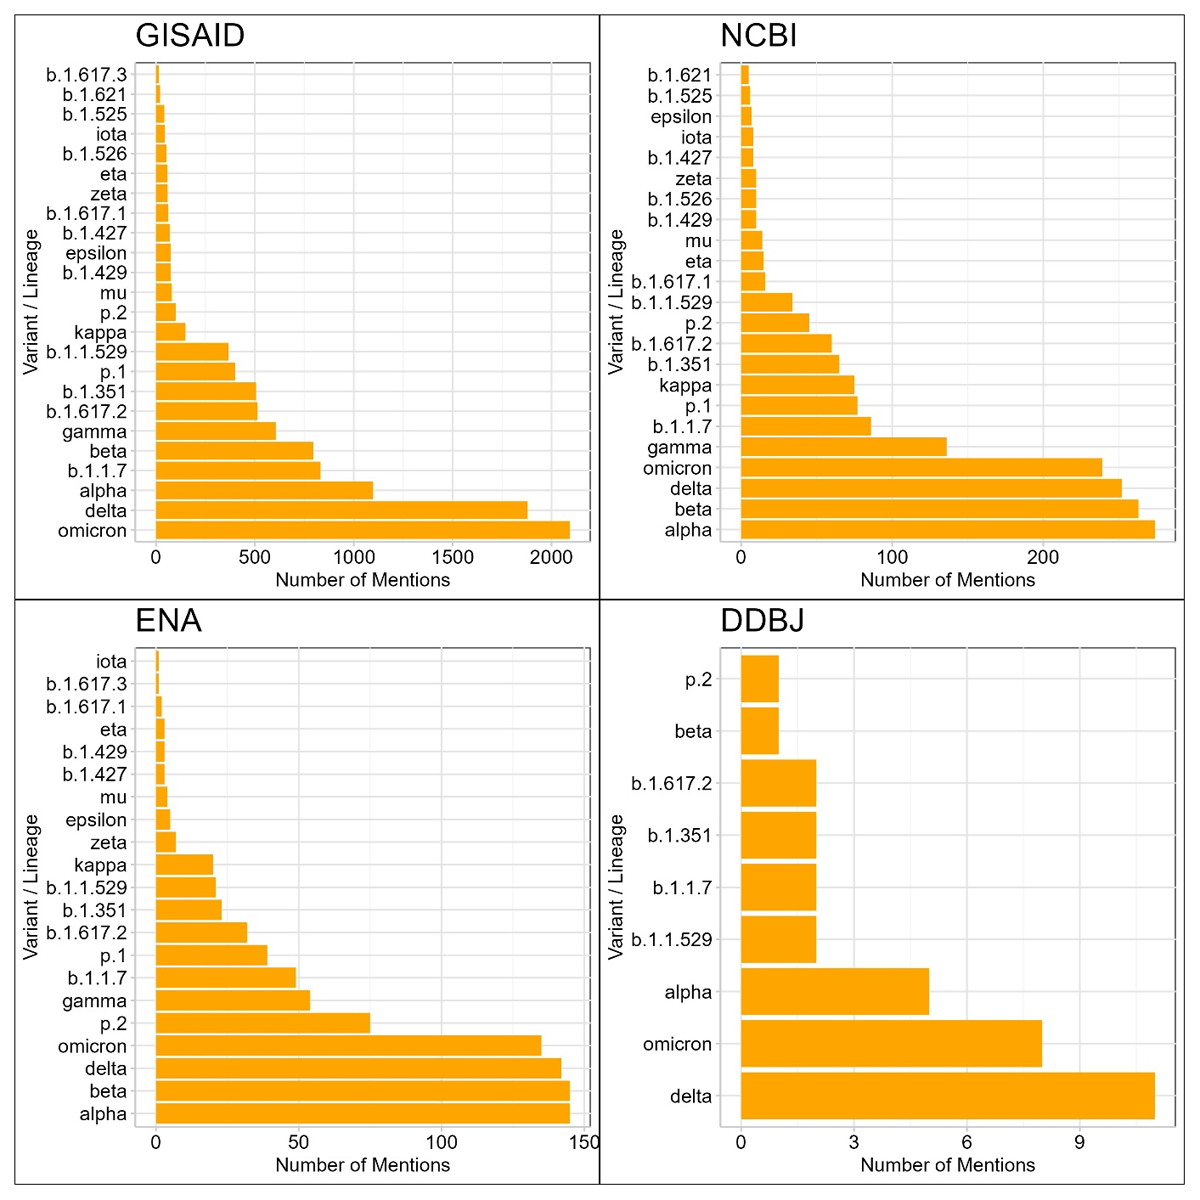
Figure 5
Frequency distribution of viral variants mentioned in abstracts across major SARS-CoV-2 repositories. This bar chart represents the frequency of mentions for specific viral variants and lineages in the dataset’s abstracts. WHO labels (e.g., alpha, beta) and Pango lineages (e.g., b.1.1.7, b.1.351) are accounted for. Each bar corresponds to a distinct variant or lineage, ordered in descending frequency of mentions. The x-axis quantifies the number of abstracts mentioning each variant and the y-axis identifies the respective variants and lineages.
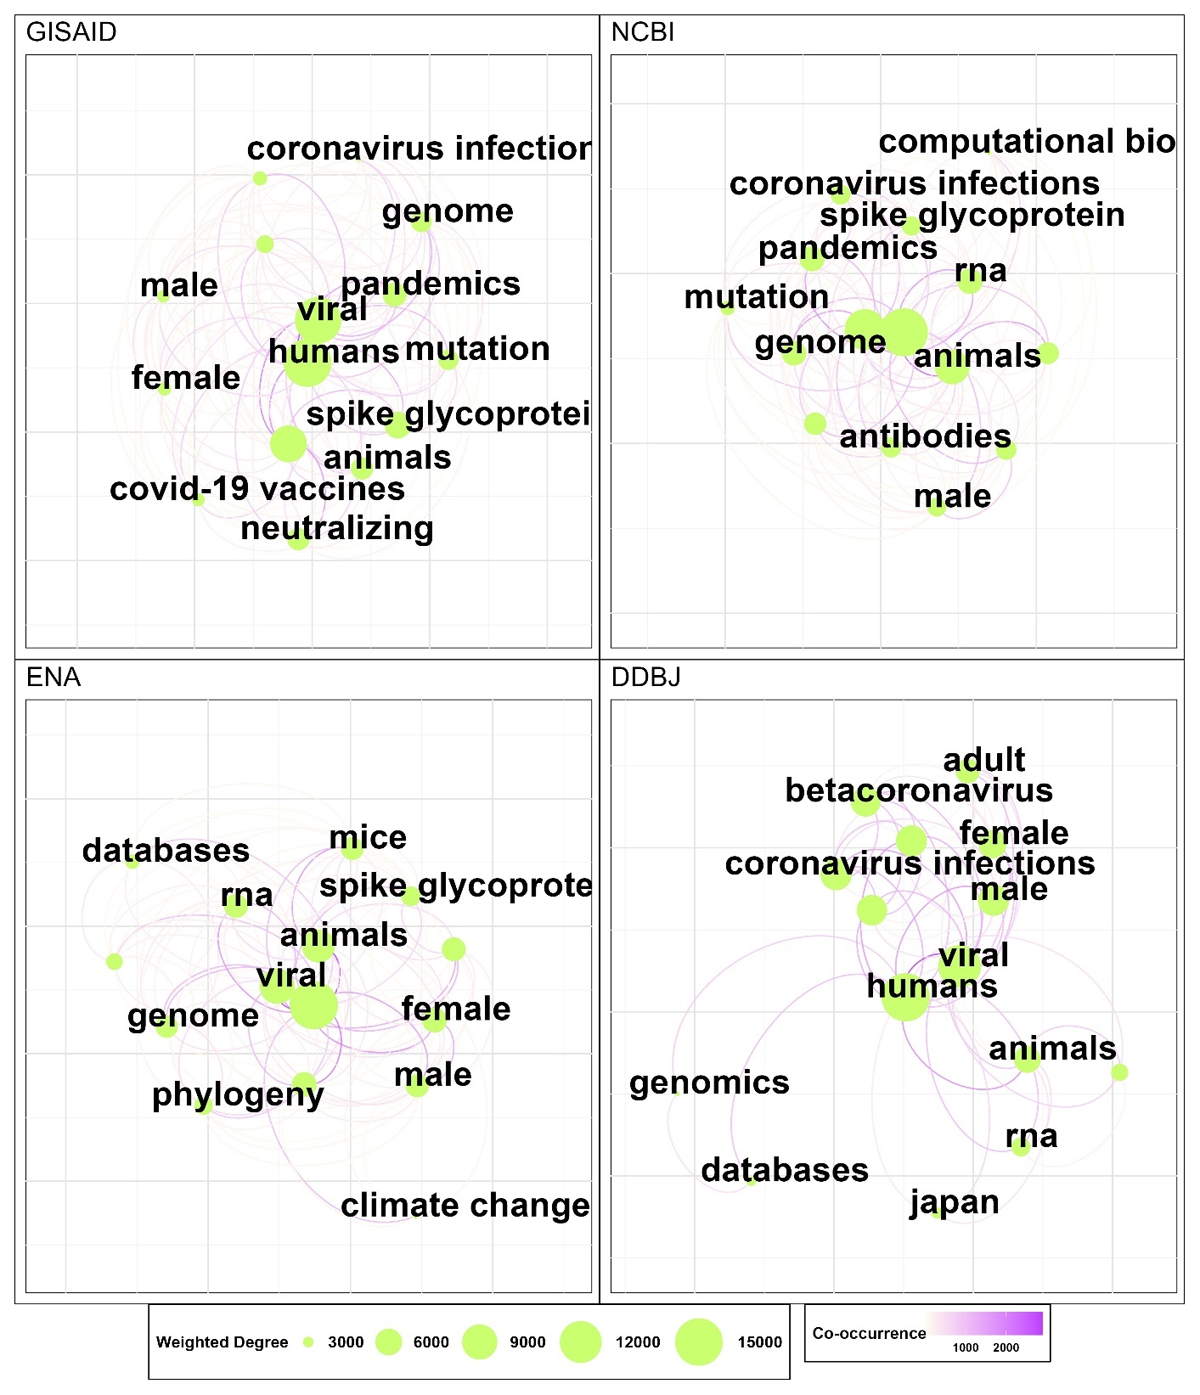
Figure 6
Co-occurrence network of top MeSH terms across major SARS-CoV-2 repositories. This graph depicts a co-occurrence network of the top 15 Medical Subject Headings (MeSH) terms within the given dataset, represented as nodes. Edges between nodes are weighted by the frequency of co-occurring terms across publications, and edge thickness scales with weight; edges with weight below a threshold of 5 are excluded for clarity. Node size is dictated by the node’s degree and colour is mapped to betweenness centrality.
Table 2
Number of papers per number of authors across major SARS-CoV-2 repositories. This table displays the cumulative number of papers per number of authors for each repository between 2020 and 2022.
| NUMBER OF AUTHORS | |||||||||||
|---|---|---|---|---|---|---|---|---|---|---|---|
| 1 | 2–5 | 5–10 | 10–20 | 20–50 | 50–100 | 100–250 | 250–500 | 500–1000 | 1000–5000 | ||
| Repo | Year | Number of Papers | |||||||||
| GISAID | 2020 | 64 | 609 | 548 | 511 | 275 | 25 | 4 | 0 | 3 | 1 |
| GISAID | 2021 | 93 | 911 | 1062 | 1207 | 634 | 60 | 7 | 0 | 5 | 1 |
| GISAID | 2022 | 95 | 916 | 1135 | 1254 | 672 | 45 | 12 | 0 | 2 | 1 |
| ENA | 2020 | 72 | 420 | 304 | 178 | 104 | 18 | 9 | 1 | 1 | 0 |
| ENA | 2021 | 275 | 1219 | 608 | 410 | 198 | 28 | 14 | 0 | 1 | 1 |
| ENA | 2022 | 407 | 1347 | 875 | 525 | 180 | 30 | 12 | 4 | 0 | 1 |
| NCBI | 2020 | 80 | 613 | 546 | 288 | 114 | 14 | 3 | 0 | 0 | 0 |
| NCBI | 2021 | 126 | 1032 | 965 | 542 | 209 | 27 | 5 | 0 | 3 | 0 |
| NCBI | 2022 | 113 | 1189 | 1258 | 718 | 210 | 21 | 4 | 0 | 0 | 0 |
| DDBJ | 2020 | 15 | 49 | 36 | 16 | 3 | 0 | 0 | 0 | 0 | 0 |
| DDBJ | 2021 | 10 | 22 | 19 | 17 | 1 | 0 | 0 | 0 | 0 | 0 |
| DDBJ | 2022 | 6 | 32 | 23 | 23 | 7 | 0 | 1 | 0 | 0 | 0 |
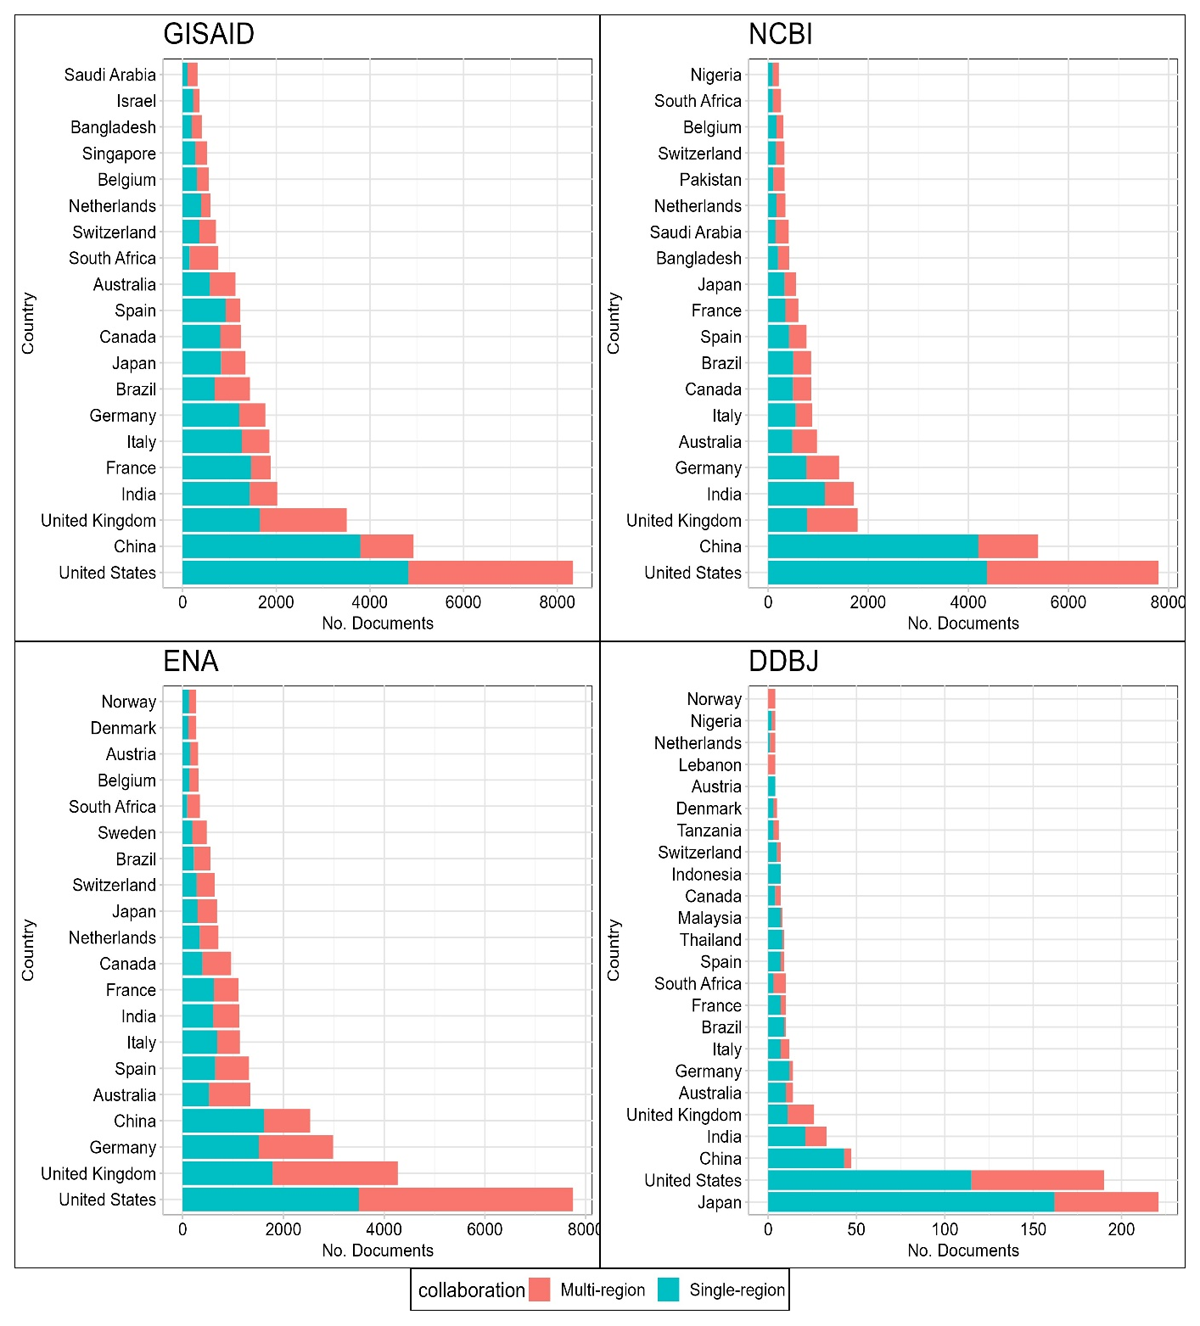
Figure 7
Distribution of single- and multi-region collaborations in scholarly publications by top 20 countries across major SARS-CoV-2 repositories. This stacked bar chart portrays the extent of single-region and multi-region collaborations in scholarly documents for the top 20 countries based on publication volume. The x-axis indicates the number of documents associated with each country, and the y-axis lists the countries in descending order of total documents. The colours in each bar segment represent the type of collaboration: single-region or multi-region.
Table 3
Income collaboration across major SARS-CoV-2 repositories. This table presents the share of income group (based on World Bank classifications) collaborations for each repository.
| INCOME COLLABORATION | GISAID | NCBI | ENA | DDBJ |
|---|---|---|---|---|
| HI-HI | 7894 (41.3%) | 6340 (41.5%) | 10372 (47.7%) | 151 (64.3%) |
| HI-LI | 138 (0.72%) | 113 (0.74%) | 163 (0.8%) | 6 (2.6%) |
| HI-LMI | 2161 (11.3%) | 2161 (14%) | 1724 (8%) | 51 (21.7%) |
| HI-MIX | 2099 (11%) | 1754 (11.2%) | 3830 (24.7%) | 14 (6%) |
| HI-UMI | 6494 (34%) | 4521 (30.3%) | 5376 (26%) | 49 (20.9%) |
| LMI-LI | 4 (0.02%) | 19 (0.15%) | 21 (1%) | 2 (0.9%) |
| UMI-LI | 17 (0.09%) | 16 (0.1%) | 13 (0.06%) | 12 (5.1%) |
| UMI-LMI | 269 (1.41%) | 349 (2.28%) | 224 (1%) | 0 (0%) |
| UMI-MIX | 25 (0.13%) | 14 (0.1%) | 19 (0.09%) | 0 (0%) |
Table 4
Comparative network statistics across major SARS-CoV-2 repositories. This table delineates the network attributes of various databases across distinct classifications: Authors, Country, Funder and Institution. Metrics included are node count, edge count, clustering coefficients and density scores.
| DATABASE | TYPE | CLUSTERING COEFFICIENT | DENSITY | MEAN DEGREE | MEAN WEIGHTED DEGREE | MAX COMMUNITY SIZE | MEAN COMMUNITY SIZE | MEDIAN COMMUNITY SIZE | MIN COMMUNITY SIZE | TOTAL COMMUNITIES | NUMBER OF EDGES | NUMBER OF NODES |
|---|---|---|---|---|---|---|---|---|---|---|---|---|
| DDBJ | Authors | 0.96 | 0.01 | 16.13 | 17.54 | 101.00 | 8.75 | 7.00 | 2.00 | 246.00 | 17,359.00 | 2152.00 |
| Country | 0.42 | 0.08 | 4.56 | 16.70 | 43.00 | 19.00 | 12.00 | 2.00 | 3.00 | 130.00 | 57.00 | |
| Funder | 0.77 | 0.68 | 8.15 | 44.15 | 13.00 | 13.00 | 13.00 | 13.00 | 1.00 | 53.00 | 13.00 | |
| Institution | 0.60 | 0.01 | 5.24 | 5.60 | 71.00 | 4.80 | 3.00 | 2.00 | 87.00 | 1095.00 | 418.00 | |
| ENA | Authors | 0.99 | 0.00 | 246.25 | 252.47 | 2987.00 | 11.28 | 6.00 | 2.00 | 6179.00 | 8,583,776.00 | 69,717.00 |
| Country | 0.71 | 0.29 | 43.54 | 9220.42 | 153.00 | 153.00 | 153.00 | 153.00 | 1.00 | 3331.00 | 153.00 | |
| Funder | 0.93 | 0.92 | 14.71 | 1752.82 | 17.00 | 17.00 | 17.00 | 17.00 | 1.00 | 125.00 | 17.00 | |
| Institution | 0.90 | 0.03 | 221.45 | 242.59 | 6395.00 | 68.30 | 2.00 | 2.00 | 101.00 | 763,790.00 | 6898.00 | |
| GISAID | Authors | 0.91 | 0.00 | 158.61 | 207.15 | 3310.00 | 18.25 | 8.00 | 2.00 | 4679.00 | 6,771,757.00 | 85,387.00 |
| Country | 0.65 | 0.26 | 40.50 | 823.06 | 159.00 | 159.00 | 159.00 | 159.00 | 1.00 | 3220.00 | 159.00 | |
| Funder | 0.93 | 0.91 | 13.63 | 2289.00 | 16.00 | 16.00 | 16.00 | 16.00 | 1.00 | 109.00 | 16.00 | |
| Institution | 0.31 | 0.00 | 27.35 | 48.77 | 4447.00 | 48.24 | 3.00 | 2.00 | 125.00 | 82,446.00 | 6030.00 | |
| NCBI | Authors | 0.97 | 0.00 | 57.73 | 61.32 | 1088.00 | 10.59 | 7.00 | 2.00 | 7002.00 | 2,140,401.00 | 74,155.00 |
| Country | 0.56 | 0.19 | 27.31 | 741.80 | 148.00 | 148.00 | 148.00 | 148.00 | 1.00 | 2021.00 | 148.00 | |
| Funder | 0.89 | 0.84 | 13.41 | 1448.12 | 17.00 | 17.00 | 17.00 | 17.00 | 1.00 | 114.00 | 17.00 | |
| Institution | 0.30 | 0.00 | 24.98 | 32.79 | 5956.00 | 49.50 | 2.00 | 2.00 | 131.00 | 81,002.00 | 6485.00 |
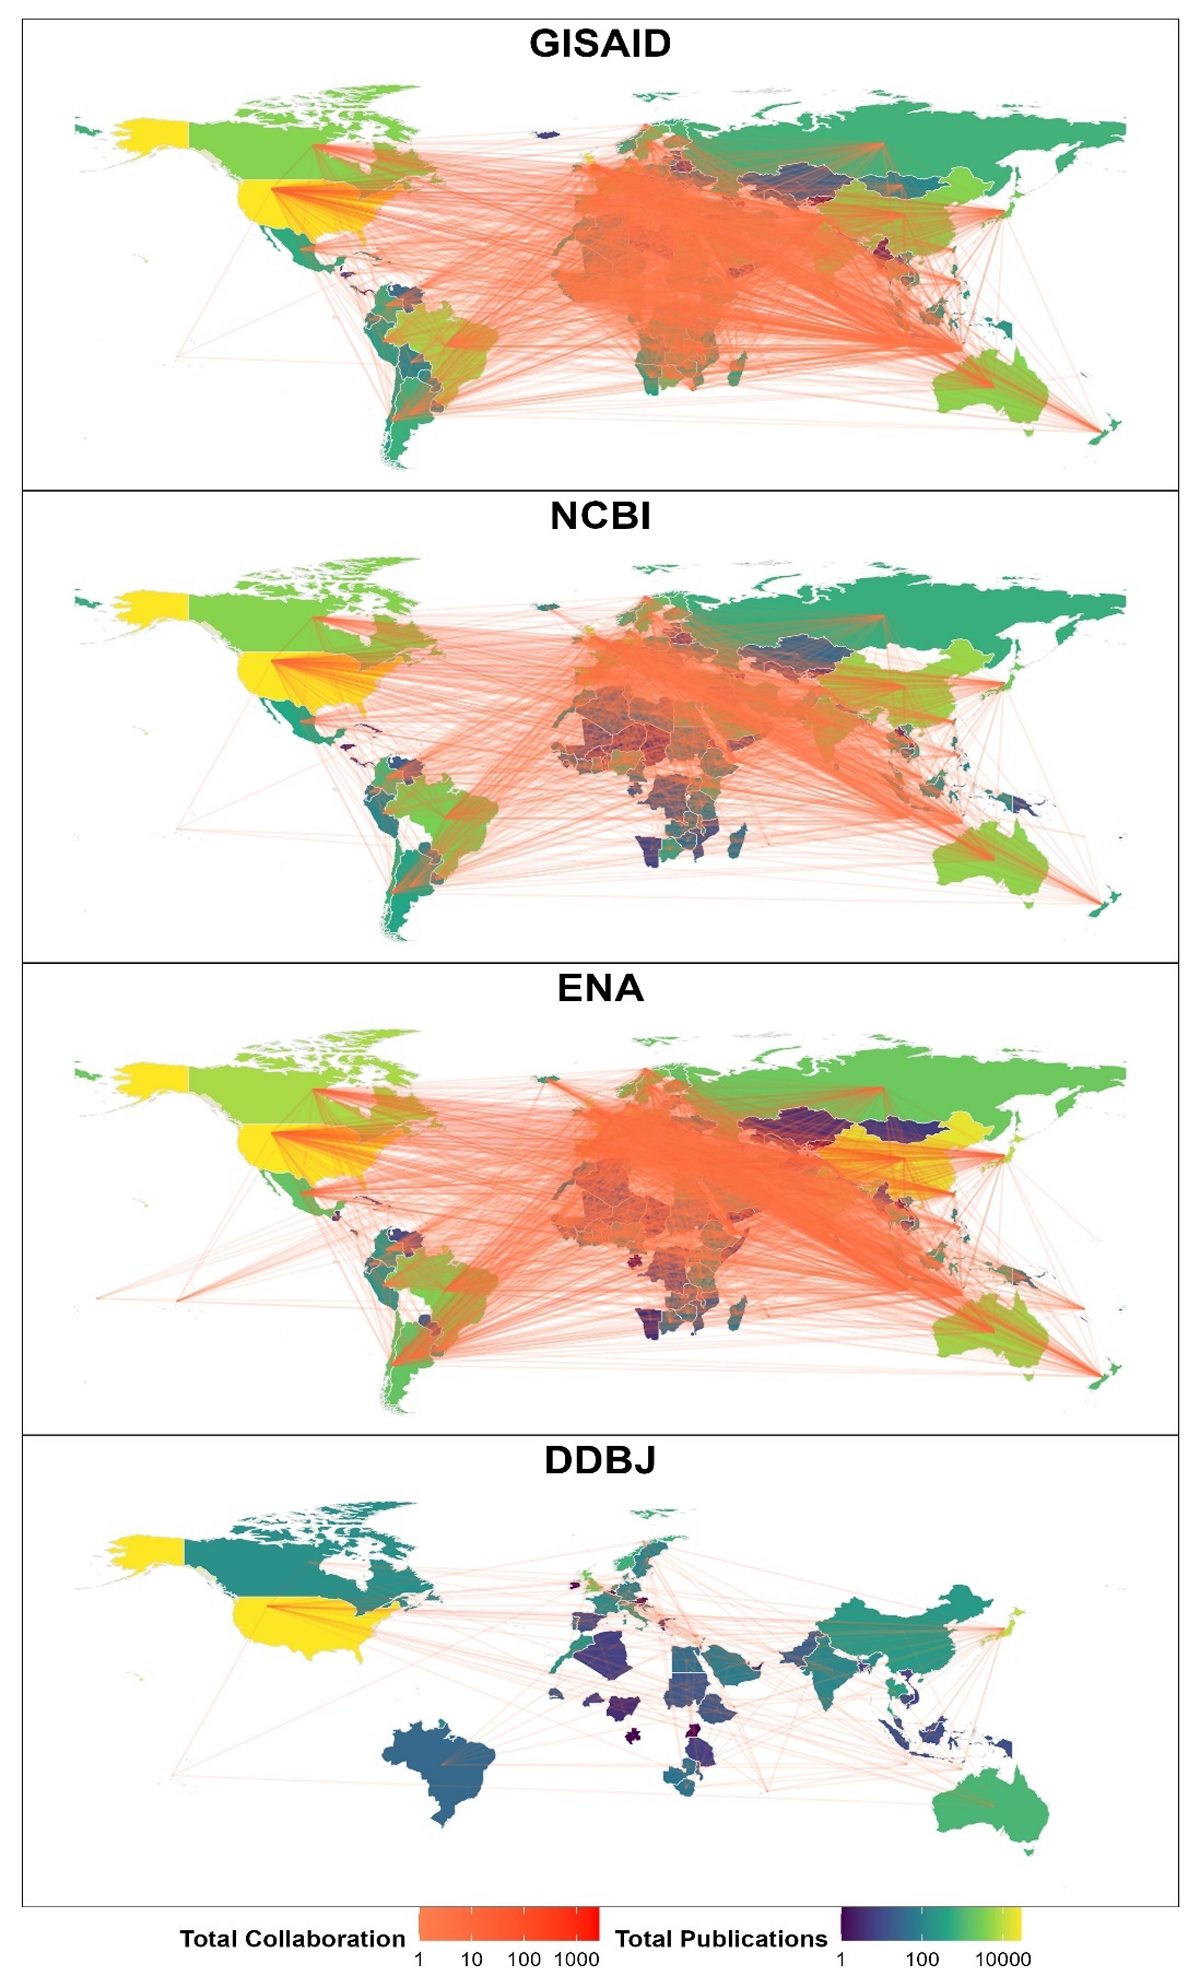
Figure 8
Country collaborations across major SARS-CoV-2 repositories. The figure provides a visual representation of global collaborations among countries. It plots a geographical map overlaid with collaboration lines between countries, where the colour of the lines represents the intensity or weight of the collaborations. Countries are color-coded based on their total number of publications.
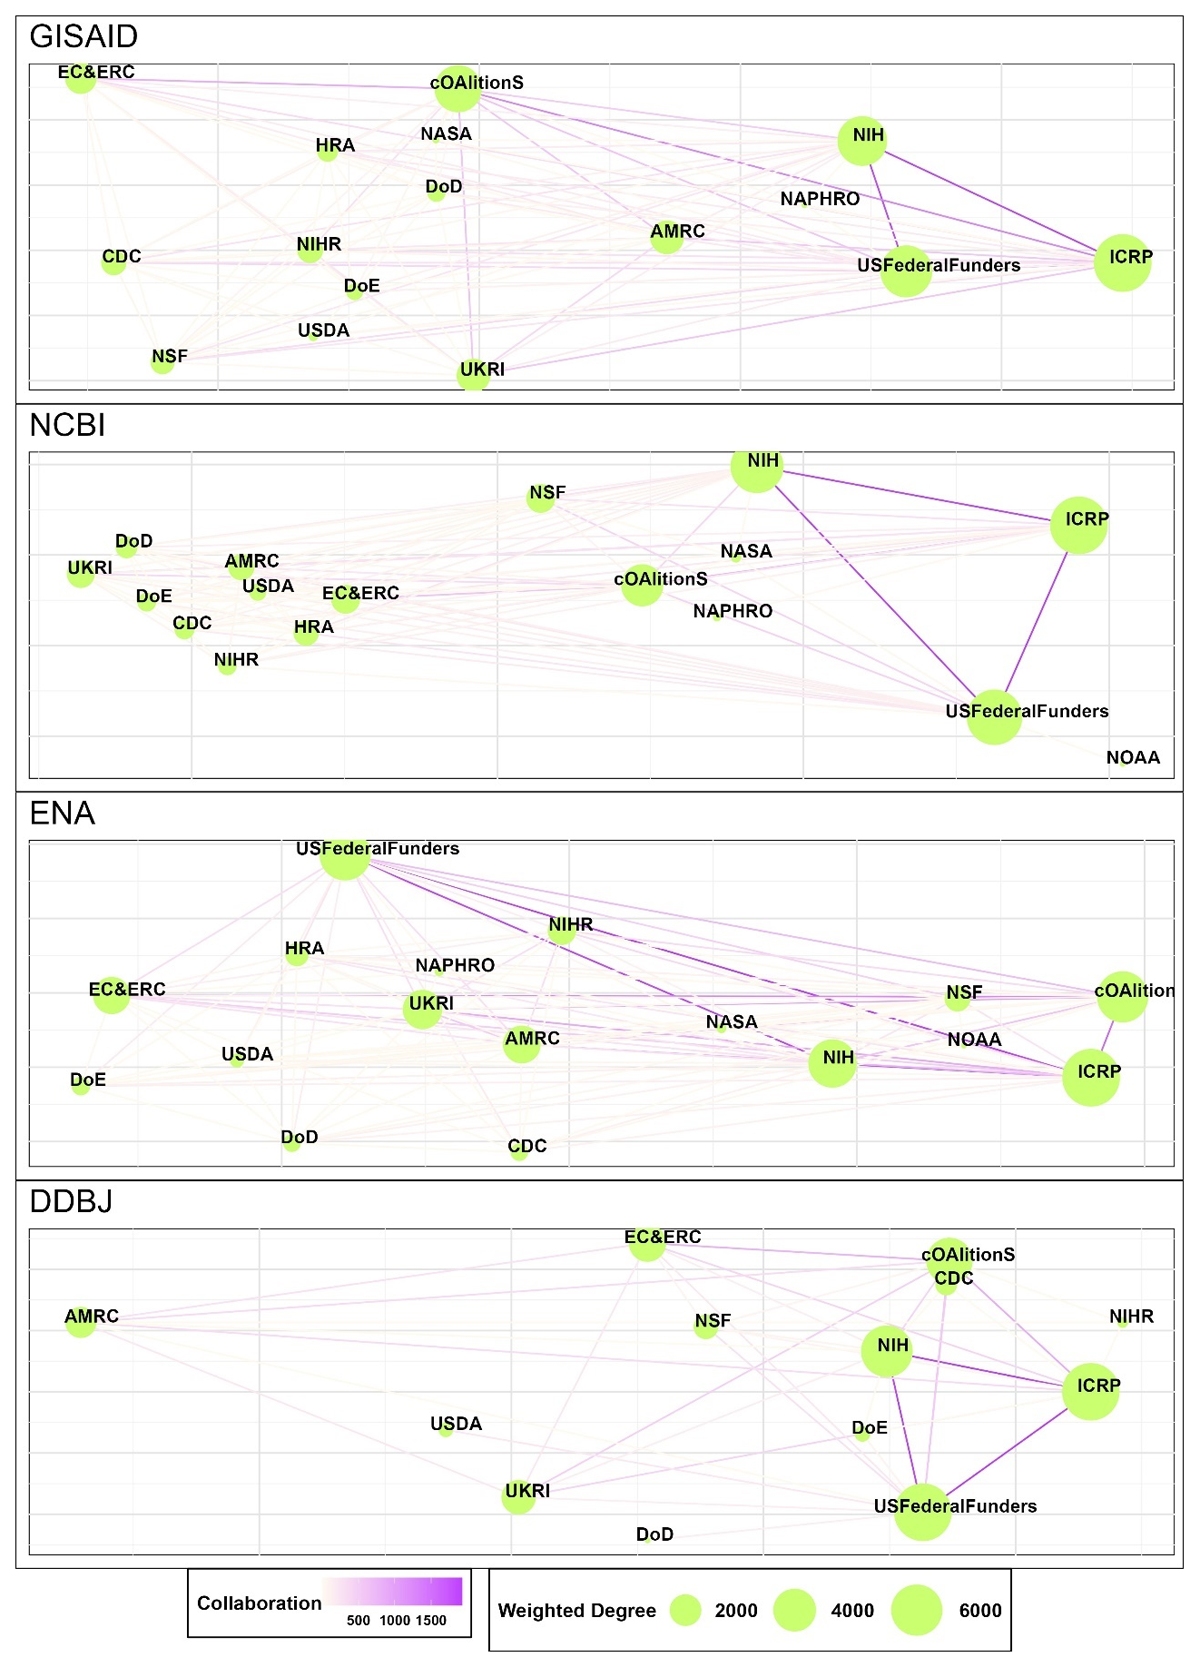
Figure 9
Funder group collaborations across major SARS-CoV-2 repositories. This graph depicts a collaboration network of funder groups within the given dataset, represented as nodes. Edges between nodes are weighted by the frequency of co-occurring funders across publications. Node size is dictated by the node’s weighted degree.
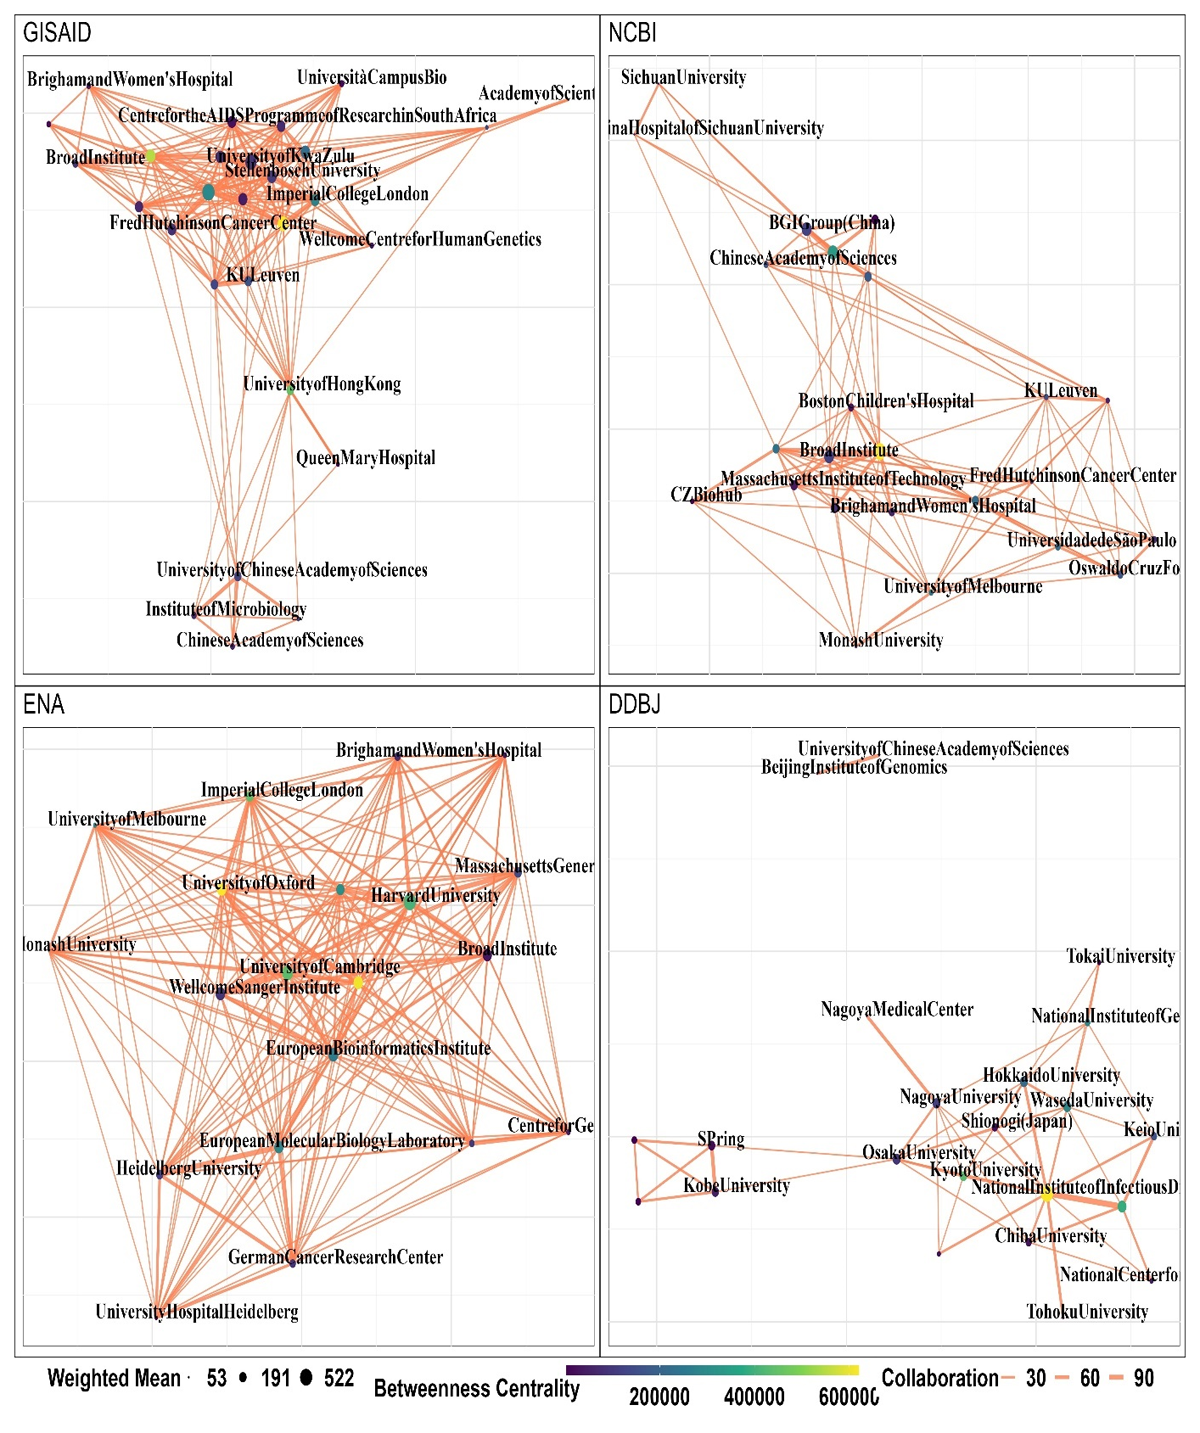
Figure 10
Institution group network across major SARS-CoV-2 repositories. This graph depicts a collaboration network of the institutions within the given dataset, represented as nodes. Edges between nodes are weighted by the frequency of collaborating institutions across publications. Node size is dictated by the node’s weighted degree, and colour is mapped to betweenness centrality, following a viridis scale.
Table 5
List of pros and cons for the strategies adopted by each repository based on results.
| BIBLIOMETRIC INDICATORS | KEYWORD & VARIANT DISTRIBUTION | COUNTRY COLLABORATION | REUSE NETWORKS | |||||
|---|---|---|---|---|---|---|---|---|
| PRO | CON | PRO | CON | PRO | CON | PRO | CON | |
| GISAID | Best performance in Altmetric and citation indicators. Predominantly Open Access papers. | Reduced Aggregate of publications compared to the entire INSDC. | Focus on therapies and treatments. Most number of mentioned variants for WHO and Pangleo Highest weighted degree. | Highest single region collaboration. | Small share of low-income collaboration High income only collaborations being the dominate collaboration. | Biggest density of Author and country collaboration. | Sparse Institutional collaboration. | |
| ENA | Best INSDC member in terms of impact factor metrics. Primarily Open Access Papers. | Features highest closed access. | Focus on animal and sex studies and wider methods like computational biology. | Less mentions of variants compared to GISAID and NCBI. | Highest multi-region collaboration share Highest High income MIX collaboration. | Small share of low-income collaboration High income only collaborations being the dominate collaboration. | Highest density of institutional and funder collaboration Greater author and country collaboration than NCBI Shorter paths in comparison to NCBI and GISAID. | Smaller share of authors compared to GISAID. |
| NCBI | Most number of articles from the INSDC group. Primarily Open Access. | Focus on animal and sex studies and wider methods like computational biology. | Less mentions of variants compared to GISAID. | Highest High Income Lower-Middle-Income collaboration Leading collaborators from the most type of income group | Small share of low-income collaboration High income only collaborations being the dominate collaboration. | Greater Institution collaboration than GISAID Smaller Average Paths than GISAID | Smallest Author and country Collaboration size between GISAID and ENA | |
| DDBJ | Spike of very influential papers citing. Predominantly gold open access. | Lowest number of publications In general, lowest impact factor metrics. | Focus on internal studies on human population. | Least number of variants mentioned. Lowest weighted degree and degree. | Small share of low-income collaboration High income only collaborations being the dominate collaboration. | |||